
dukeposh
@t_dukeposh

What symbols does the trader recommend buying?
Purchase History
پیام های تریدر
Filter
dukeposh
FETUSDT|C&H Setup +100% Breakout MA cluster-A High Quality Break

Cup&Handle setup with a high quality breakout the confluent MA cluster—especially the 200-day— as the gatekeeper. If price hold above the ma200 (and the nearby 20/50) cluster a high-quality breakout and more likely to break the handle and the cup rim. Here is how I’d weigh it and trade it: DON'T WAIT FOR CUP RIM BREAKOUT Priority of BUY signal strength indication: 1. Daily close & hold above the ma200 dynamic resistance the most institutions watch - follow BUY 2. Cup handle breakout watch for volume expansion on the break (> 20-day average) 3. Cup rim breakout with a golden cross ma20 reclaim > ma50 curl up is a follow-through BUY Decision matrix: - Breaks above key fib level - look for a shallow retest of the breakout line / MA bundle at key fib zone 38.2% - 61.8% liquidity zone for proper trailing stop / limit order. Target - TP1 100% fib zone (+50%) - TP2 extended 161.8% (+100%) SL slightly below previous low RR: 3:1 Always trade with affordable risk and respect your stop!
dukeposh
DOGEUSDT|Pullback Confluent Support -cup&handle next ext. +80%

DOGE - retraced at the confluent support zone, high potential pullback buy position: - SMA50 Dynamic support—often attracts mean-reversion buys. - cup & handle support retest Price retested prior breakout zone—flips resistance to support. - key 38% Fib “sweet spot” pullback level after corrective moves. - Previous Change of Character marks shift from bearish to bullish structure—support confluence. Potential Entry & Risk Management Entry Zone - Aggressive: immediate handle breakout support - Conservative: Wait for liquidity pattern and re-bounce confirmation candle above SMA50 Stop-Loss -Below Cup Handle low -10% larger position prior swing high RR:2.5/1 -Suggested SL: previous low -0.17 USDT - 5% below entry Initial Targets -Key resistance 61.8% Fib retracement — 0.217 USD -100% Prior swing high — 0.26 USD -162% Next extended target - 0.35 USD Trade Rationale -Mean-reversion into SMA50 and Fib 38.2% zone aligns multiple buyers. -Pattern support: Cup & handle retest confirms breakout strength. -Structure flip: CoCh zone indicates bullish regime shift. Watch-Outs -Rejection below 0.188 USD erodes support cluster—invalidates setup. -Rising volume on bounce is crucial—low-volume lifts often fail. -Beware broader market sell-offs impacting altcoins. Next Steps: -Monitor 4-hour candlestick close inside entry zone. -Check volume spike on reversal candle. -Adjust risk dynamically if price gravitates toward upper channel resistance. Always trade with affordable risk and respect your stop..
dukeposh
ADAUSDT|Triangle Setup WXYX2Z (1-2) +180% - Revisit $1.82 Target
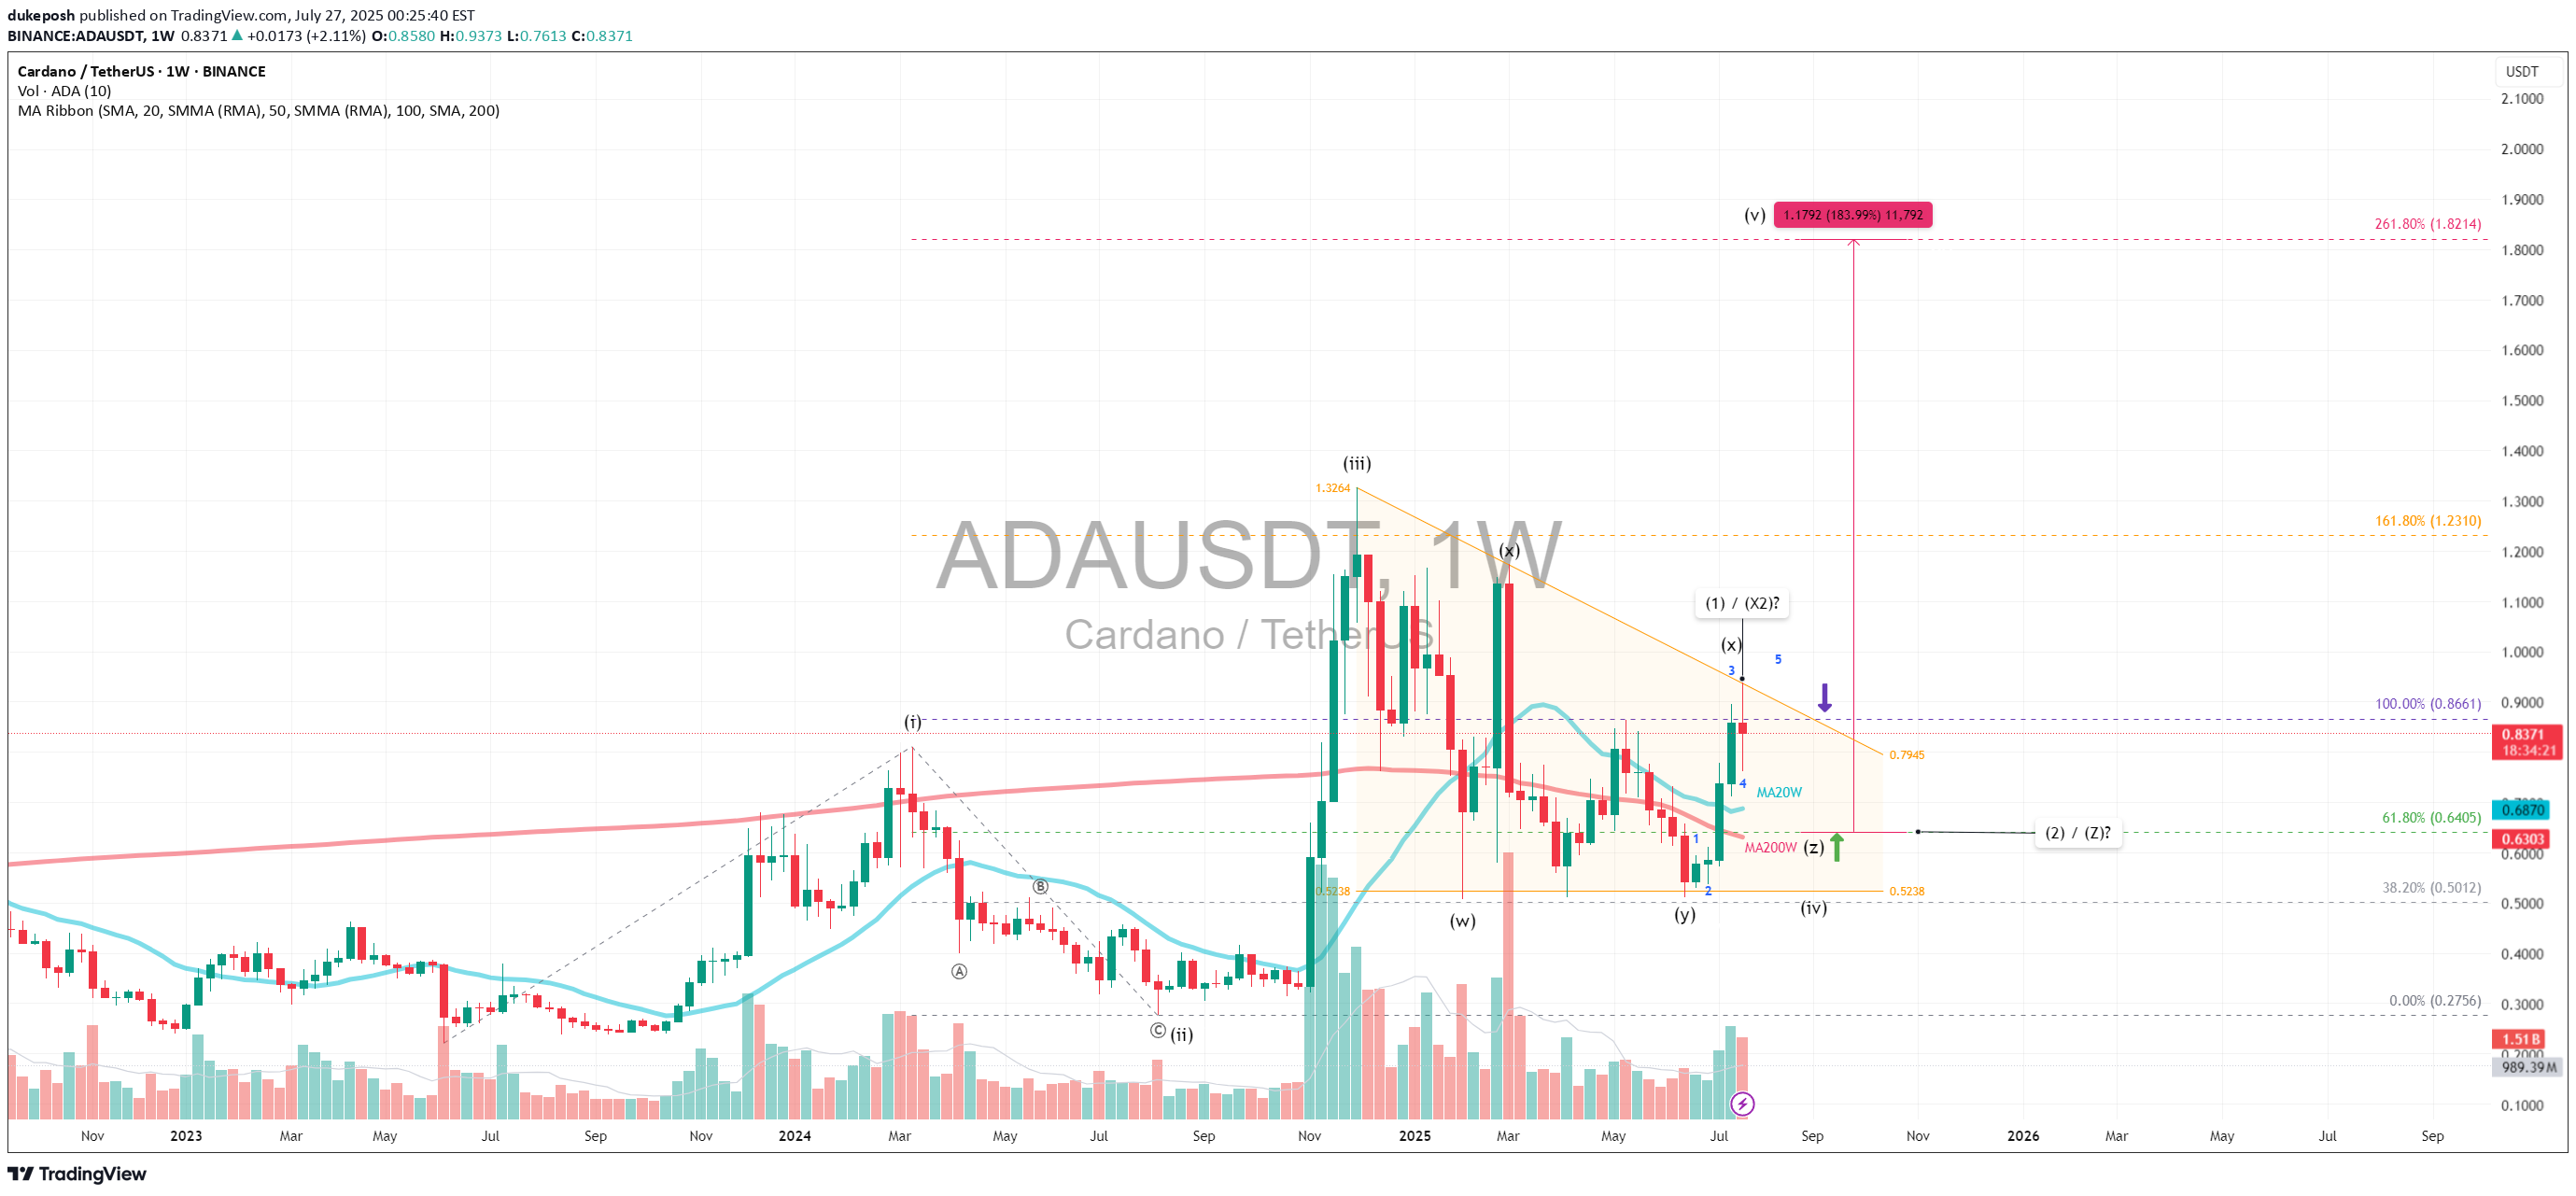
Primary Pattern: A contracting triangle within a larger corrective structure, likely wave 4. Wave Count: A diagonal 5-wave impulse (i–v), followed by a WXY (X2) Z complex correction, suggesting wave 4 is still unfolding, possibly nearing completion. Current Price: $0.83 with volume and SMA ribbon golden crosses showing bullish signal and near completion of accumulation phase. Fibonacci Extension: Targeting diagonal wave 5 at 261.8% extension from the base of wave 1 aligns with the projected target of $1.82, which matches the height of the triangle target. This also coincides with a +180% move from the possible upcoming wave Z or wave 2 —technically ambitious, but plausible if wave 5 kicks off with momentum. Wave 4 Triangle Context: The WXY(X2)Z structure implies a complex sideways correction which is typical of wave 4 behavior 1.6x - 2x wave 2 time extension Key Support: Entry: If X or 1 is nearing completion, and triangle support holds at key support MA20W Fibonacci 61.8%, the breakout into wave 5 could be explosive—especially with diagonal structure suggesting a leading diagonal pattern. SL: Triangle Support is the last liquidity / smart money entry Always trade with affordable risk and respect your stoploss!
dukeposh
DOGEUSDT | Bullish Cup & Handle Revisiting Target +500% (1 USD)?
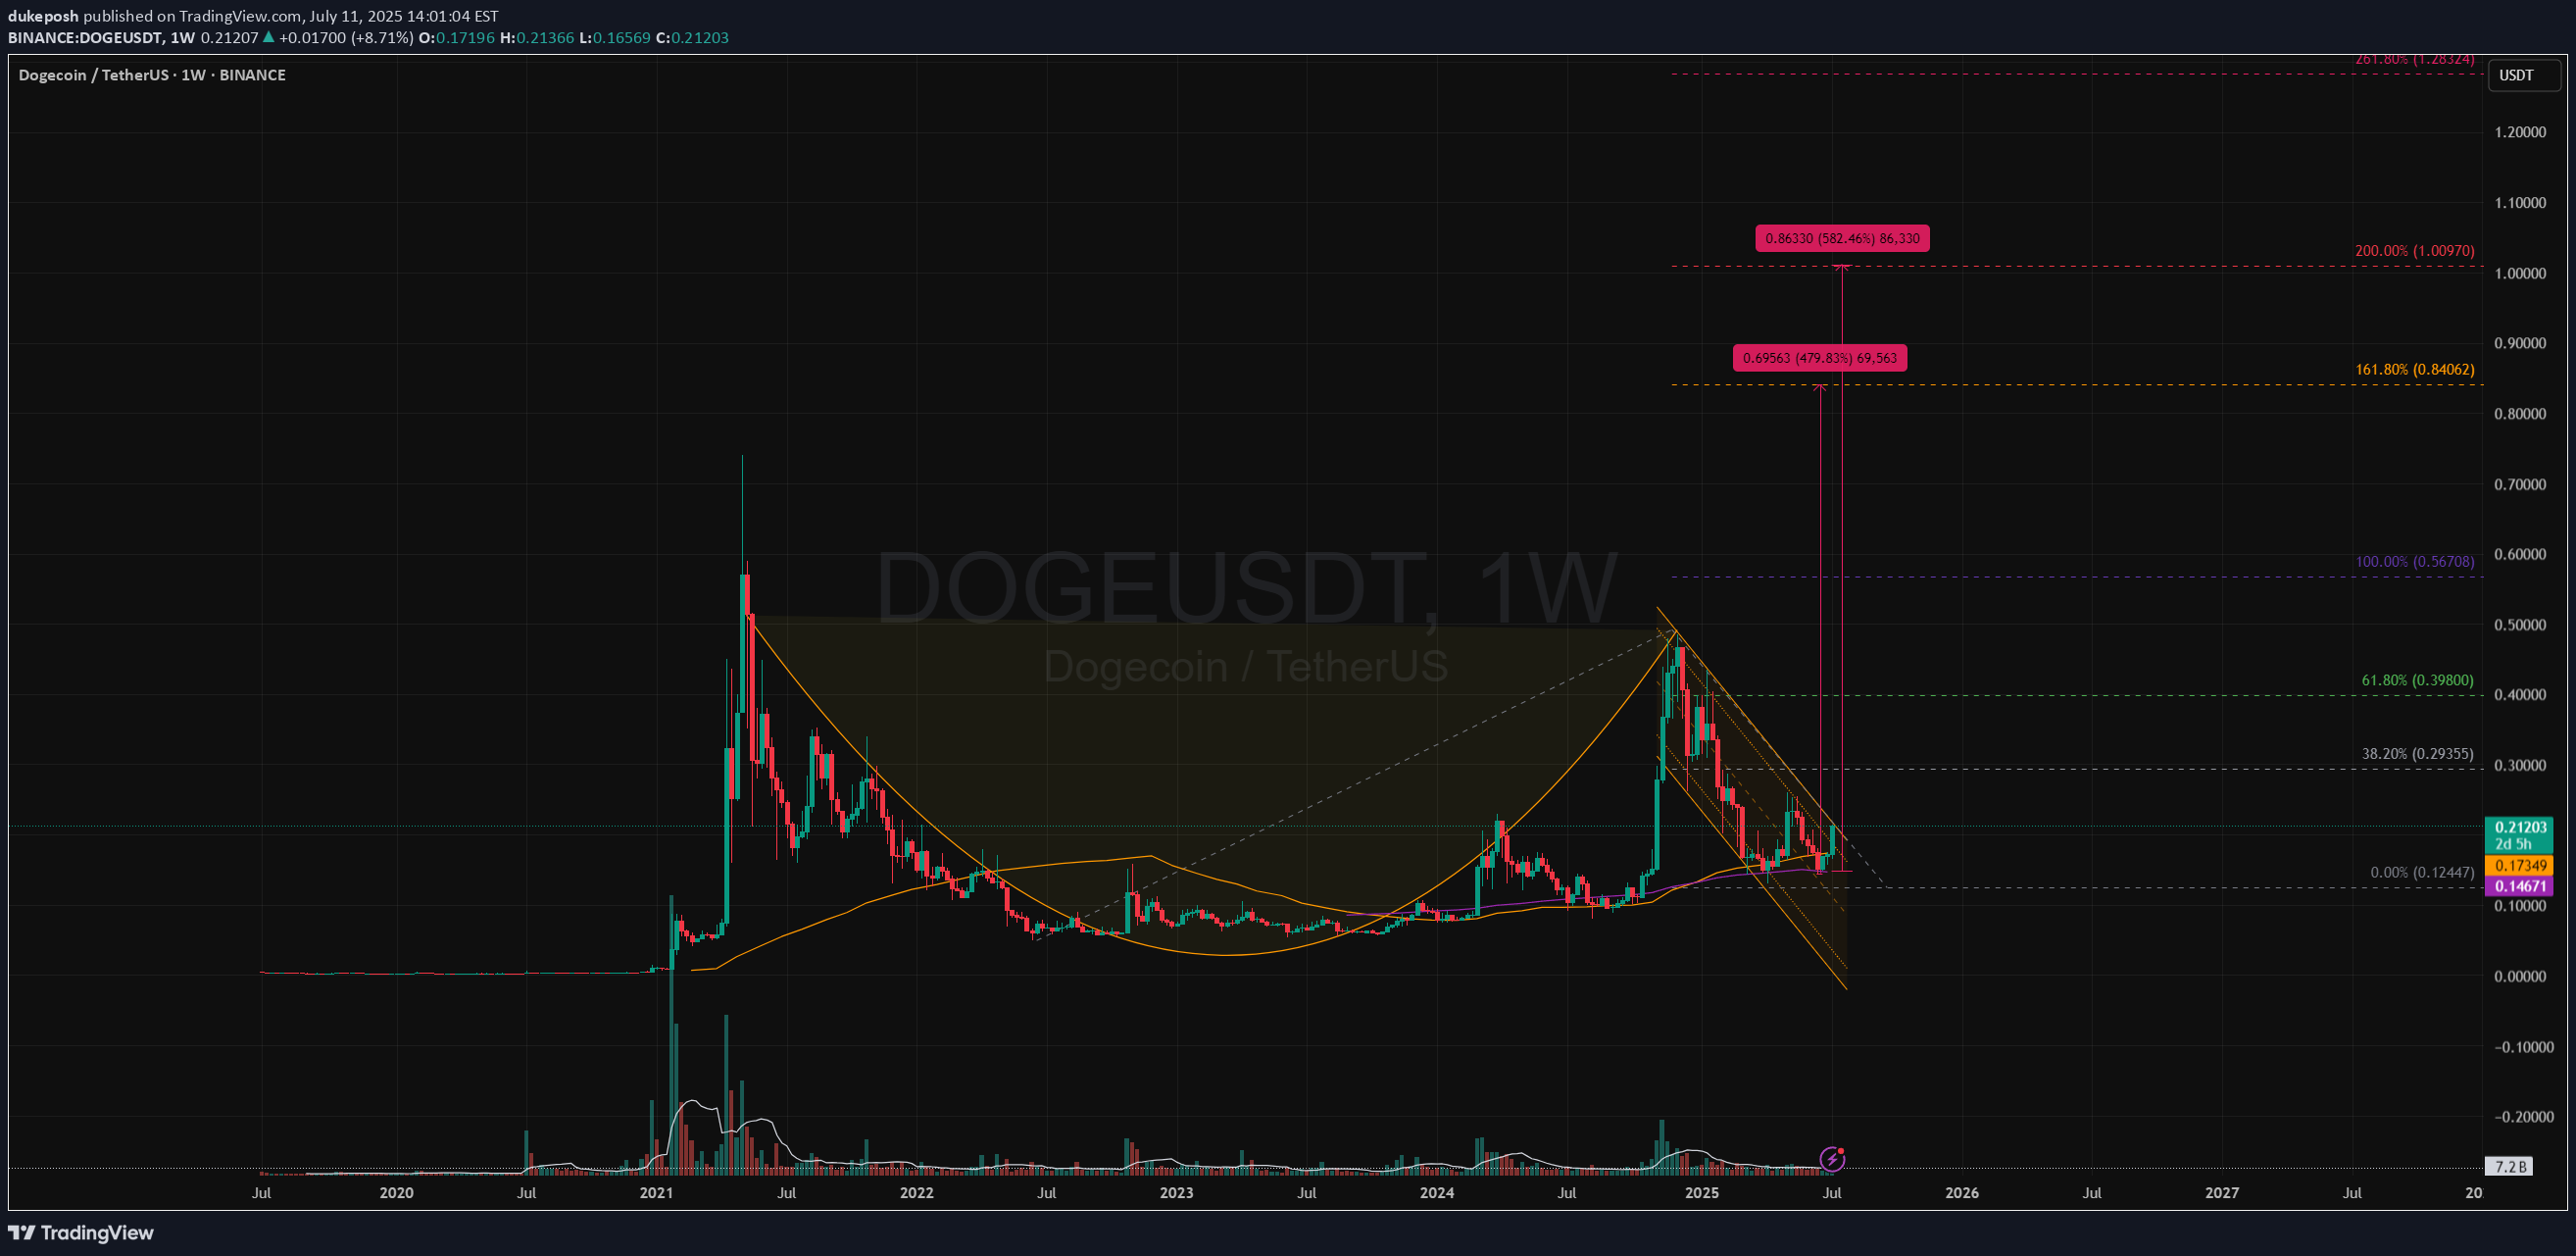
Price Action and Chart Pattern Analysis: DOGE cup bottom happened around $0.05 with the rim around $0.48. That gives a depth of roughly $0.42. If the breakout occurs near the rim, the measured move target would be $0.90 zone. This aligns with several analyst projections suggesting DOGE could reach $0.90 to $1.00 if the breakout confirms. Another way to project this cup & handle is the fibonacci-based target. These levels suggest that if DOGE breaks above the handle and sustains momentum, $0.85–$1.00 is a realistic zone for profit-taking at 161.8% and 200% extension as 1-2-3 wave pattern. Reliability of the Cup and Handle Pattern for DOGE The cup and handle is a classic bullish continuation pattern, but when applied to Dogecoin, its reliability depends on several dynamic factors: Strengths of the Pattern in DOGE’s Context Historical Accuracy: DOGE has previously respected technical patterns like rounded bottoms or (THE CUP) and breakout channels (THE HANDLE), especially during alt coin rallies. Current Setup: a well-formed cup and handle on DOGE’s weekly chart, with price rebounding from $0.14 and testing resistance at $0.2 zone which also the key resistance SMA50W and the downtrend channel (the handle) WATCH OUT: still a possible throw-under pattern or a final bear trap liquidity below previous low! Key Action: If breakout confirmed with volume > Follow BUY | if not, wait for retraced SMA20 or breakout support. Always trade with affordable risk and respect your stop...DOGE temporarily facing the selling pressure at 100% fibonacci target, key support at MA200 and fibonacci 61.8% extension
dukeposh
ADAUSD | Wave Analysis CUP&HANDLE Formation +200% Target

A potential ABC correction - cup with bull flag / flat handle ABC formation which currently retraced 61.8% of the A/1 wave with a possible a.4-a.5 stop hunt ending diagonal for a second false breakdown. Entry Position: Once price successfully recovered from the false breakdown support zone which could be a few attempts since wave 4 often a complex triangle. Indicator support: RSI bullish divergence in TFD confirmation of the a.5 wave. Target Position: TP1 @ 161.8% and TP2 @ 200% Fibonacci extension +200%! Invalidation: Below the lowest price position. Always trade with affordable risk and respect your stop, Good LuckThe price hit the 1st target fibonacci 161.8% @ $1.015 (+150+%), the previous liquidity zone wave a.5 stop hunt gone below the key support $0.4+ as far as $0.33 before rebounded.
dukeposh
DOGEUSD | ABC Wave Cup Pattern - Target Projection +120%

A potential ABC - Cup pattern formation scenario TFW - current multiple falsebreak below 161.8% extension - a sideway / sideway down movement implication > RSI convergence signal supporting wave 3 status > Projecting wave 4 at rounding cup support level, possible 20 week moving average and 100% fibonacci support zone. > Targeting wave 5 at 361.8% fibonacci extension of A wave at the key liquidity resistance level + 120% profit. Always trade with affordable risk and respect your stoploss Goodluck
dukeposh
BTCUSDT | ABC wave target projection TFW +75-80K USD

This TFW wave analysis in this scenario of a 5 wave expanding diagonal structure: w.1 - completed Dec 2017 w.2 - declined @ 78.6% of w.1 w.3 - an impulse 5 wave @ extension 361.8% of w.1. w.4 - also @ 78.6% of w.3 ABC structure (alt count 1-2-3-4-5) overlapped w.1 zone by 10%+/-. w.5 - currently preferable ABC or 123 structure with a complex w.B/2 wave correction @ 38.2% (B wave is often complex pattern) of w.A/1. The impulse move of the current wave c.3 now extended above fibonanci 261.8% of w.a and sustaining at above level 65K USD The current price movement could be entering liquidity zone approaching the major upper trend/channel resistance and the next fibonanci wave C/3 target at 361.8% around 75-80K. Supported Indicator: weekly RSI @ 90 the highest level with convergence value - a possible higher price with a bearish divergence confirm the next move for a trend signal for reversal/decline. Bearish count scenario - daily price movement possible ABCDE triangle - minor 4-wave for a short-term correction resulted in a lower price of minor 4-wave. Always affordable risk and respect your stop.Update bullish scenario in more detail TF4H a running triangle correction in 4-wave new target 85K zone as triangle target
dukeposh
ALGOUSDT | 1-2-3 Wave projection -Inverted Head & Shoulders +90%

A possible 1-2-3 bullish pattern with an inverted h&s breakout Target: 162% Fibonacci extension - wma200 week +90% Entry: breakout retest wma20w SL: week low position (week candle wick) -20% RRR: 4:1
dukeposh
APEUSD | ABC Pattern - Pullback Inv. Head&Shoulders TP +70%

An inverted head & shoulders breakout in weekly timeframe, possible ABC wave pattern Entry pullback trade position retracing at the inv. h&s neckline support - SMA20W TP1 - 161.8% extension +70% @ downtrend triangle resistance TP2 - 261.8% SL - B wave lowest position RRR: 3:1
dukeposh
SHIBUSDT | 1-2-3 Wave projection - Pullback Position +75%

A possible pullback for a long position at the key falling wedge breakout the price also now at the key weekly support EMA50W with bullish pinbar. If successfully takes out the previous high at fibonacci 100% extension, the next target 1-2-3 pattern at 161.8% and 261.8% level +75% and +130%+ weekly MACD: doubled bullish divergence at the pivot point, golden crossed and above baseline supporting the uptrend continuation when retesting the baseline.TP2 reached and extended further to 362% zone
Disclaimer
Any content and materials included in Sahmeto's website and official communication channels are a compilation of personal opinions and analyses and are not binding. They do not constitute any recommendation for buying, selling, entering or exiting the stock market and cryptocurrency market. Also, all news and analyses included in the website and channels are merely republished information from official and unofficial domestic and foreign sources, and it is obvious that users of the said content are responsible for following up and ensuring the authenticity and accuracy of the materials. Therefore, while disclaiming responsibility, it is declared that the responsibility for any decision-making, action, and potential profit and loss in the capital market and cryptocurrency market lies with the trader.