
dodogtg
@t_dodogtg

What symbols does the trader recommend buying?
Purchase History
پیام های تریدر
Filter
dodogtg
Bullist to ATH

Still bullish monday will be Gap down look for buy in deep. for long the way to ATH
dodogtg
Waiting bullish confirmation reversal to Buy

🟢 XAUUSD H1 – 22 May 2025 Analysis Recap Trend: Bullish (Higher Highs & Higher Lows) Price now: ~3,341.22 (above PDH = potential liquidity grab) Fibonacci Zone (PDL to PDH): Key buy zone: 3,305 – 3,295 EMA: Bullish crossover ✅ Market Structure: BOS & CHoCH confirmed since May 20 🎯 Trade Idea – Buy on Pullback SetupDetails 🔽 Entry Zone3,305 – 3,295 (Fibo 50–76.4%) 🎯 Ideal Entry3,301 (Fibo 61.8% + FVG + EMA support) ❌ Stop Loss3,284 (below PDL for safety buffer) 🥅 TP13,324 (Previous Day High) 🥅 TP23,340 (Weak High level) 🚀 Final TP (opt)3,360 if breakout continues ⚠️ If No Pullback? Let price break above 3,341 first Wait for reaction or rejection If SBR appears → scalp sell possible Avoid FOMO buys near top — wait for a clean pullback & bullish candle confirmation.
dodogtg
Sell Gold

🔍 Gold Price Analysis – 1H Timeframe (SELL Setup) 🧭 Trend & Market Structure The market is still bearish overall. Price is trading below the 200 MA (red line), showing strong selling pressure. We can see a clear pattern of lower highs (LH) and lower lows (LL) forming. Price recently pulled back into a minor resistance zone and got rejected – a solid sign of a sell zone setup. 📌 Key Areas (Supply & Demand Zones) ZoneLevelsNotes Supply Zone (Sell Area)3,236.64 – 3,252.30Daily Engulfing zone – clean rejection seen Demand Zone (Target Area)3,188.31 – 3,187.63Base on H1 timeframe – minor support Strong Support Zone3,145 – 3,160H1 Engulfing zone – strong buyer interest 🔻 Sell Setup Plan ParameterValue Sell Entry3,236 – 3,245 (on bearish rejection) Stop LossJust above 3,252.30 (above supply) Take Profit 1Around 3,188 (Base H1 area) Take Profit 23,145 – 3,160 (strong demand zone) 💡 Extra Confirmations There's a nice bearish engulfing candle right in the D1 zone → strong seller signal. Price couldn't break above the 200 MA → confirms bearish pressure. EMA 9 and 21 are starting to cross down → supports the short idea. 📉 Quick Summary Bias: Bearish Entry Zone: Clear rejection from a strong supply zone Targets: H1 base and strong demand zone Recommendation: Watch for a retest around 3,236–3,245 for a clean short setup with tight SL above 3,252
dodogtg
Gold in Strong Resistant D1
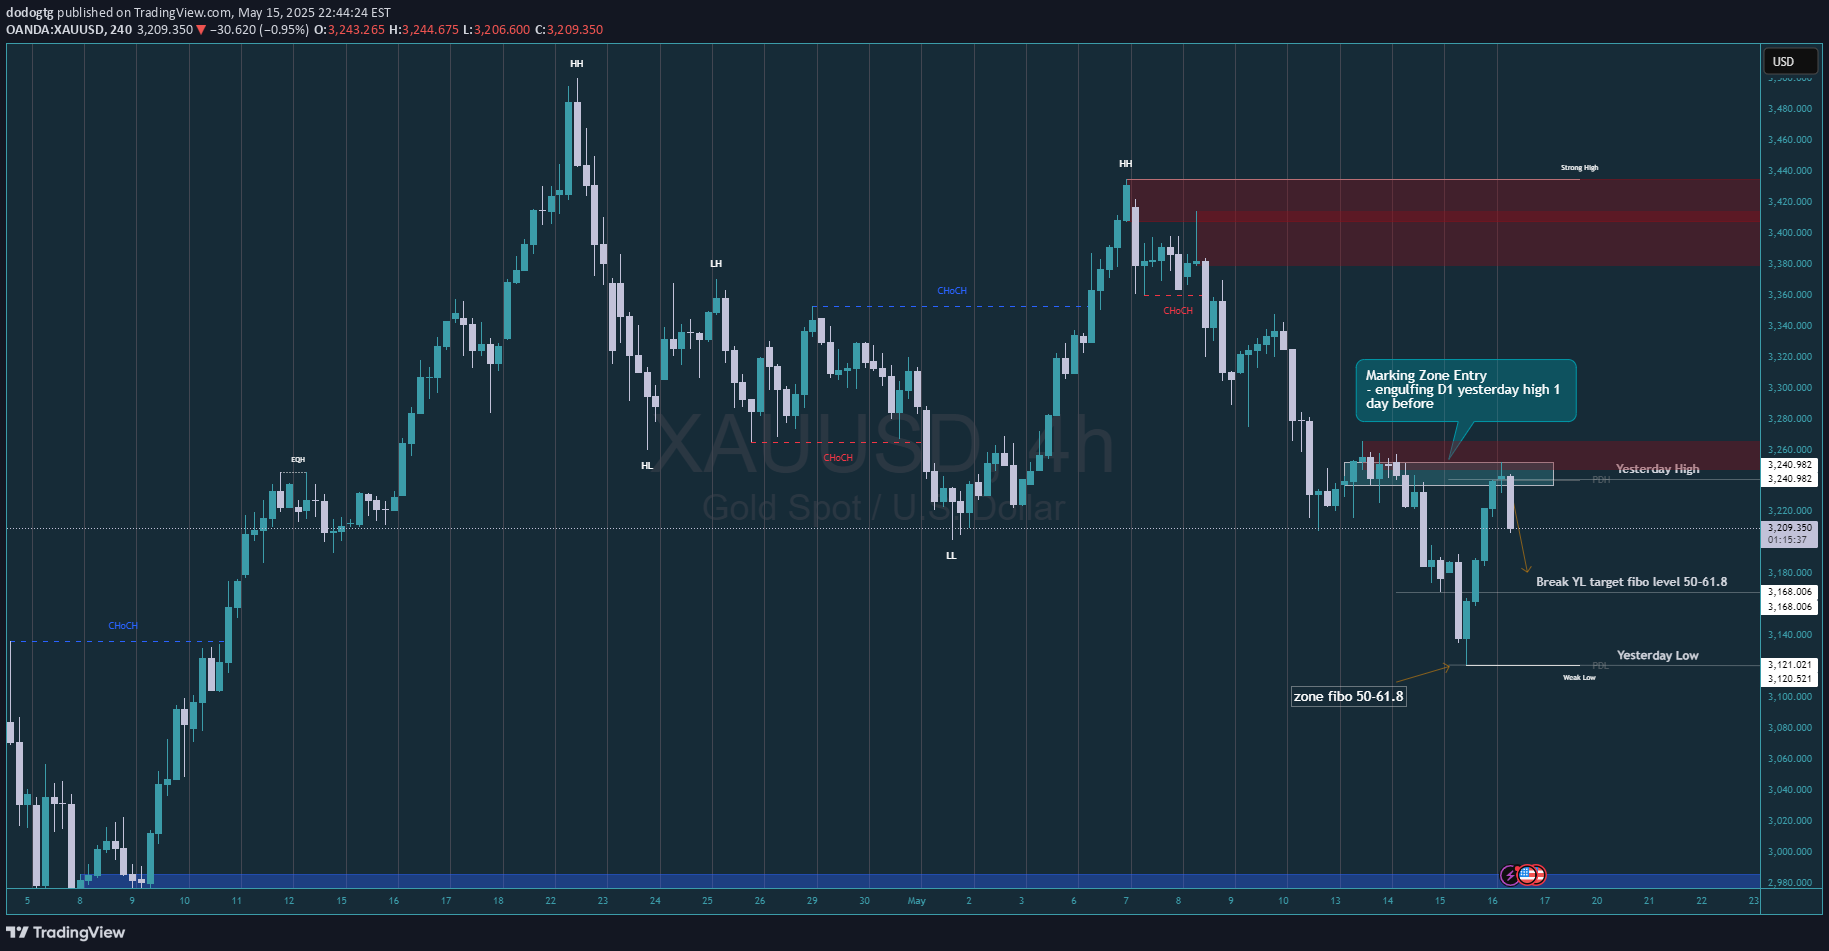
🧠 Chart Summary: Pair: XAUUSD (Gold Spot) Time Frame: H4 Market is clearly in a downtrend – you can spot those Lower Highs (LH) and Lower Lows (LL). Price hit a supply zone (marked in red) and instantly got rejected – clean bounce. It also touched the “Yesterday High” and then dropped – nice sign of strong resistance. Now price is heading down toward Fibonacci retracement levels (50% and 61.8%) and “Yesterday Low.” 🔻 SELL Trade Breakdown FactorNotes TrendBearish – structure shows LH and LL Entry ZonePrice rejected hard from that supply zone (red area) Candle ConfirmationBearish engulfing setup around that resistance zone Stop LossJust above the red zone / “Yesterday High” (around 3,250–3,260) TP 1Around 3,168 (Fibo 50%) TP 2Around 3,121 (Fibo 61.8% + Yesterday Low) MomentumSolid bearish pressure – broke minor support, looks ready to drop 📈 SELL Plan Summary: Sell Entry: Current level or wait for a retest around 3,240–3,250 Stop Loss: Above 3,260 (above that red zone) Take Profits: TP1: 3,168 (50% fibo) TP2: 3,121 (61.8% fibo + previous day’s low)
dodogtg
Looking for down side

waiting for next move, looking for short entry in wave C
dodogtg
Finish Wave 4 correction phase

Overview: Currently, the price of GOLD (XAU/USD) is at the end of the Wave 4 correction phase in the Elliott Wave wave structure. By using Fibonacci Retracement to identify important levels, we will wait for the continuation of the price movement which can take us to Wave 5. In this analysis, we will explore key levels for potential entry, as well as targets for the next price movement. Trading Advice: Entry Point: Wait for price to show a reversal after reaching a significant Fibonacci retracement level (50.0% or 61.8%). Watch for confirmation of reversal candlestick patterns such as Pin Bar or Engulfing Pattern around these levels. Stop Loss: Place Stop Loss below the 78.6% Fibonacci retracement level to avoid bigger losses if the price moves lower. Take Profit: The first target for Wave 5 is around 2538, based on the last support.
dodogtg
GOLD Continue drop

After reaching an all time high on October 30, gold experienced a significant decline. as predicted, gold fell again. The nearest target is 2546. At this price, gold has the opportunity for an upward correction.
dodogtg
Gold Next Move

After the price succeeded in breaking down the 2648 area, in the major H4 time frame, gold is currently moving down trend. Wait for the price to make a correction to look for a sell position. Use Fibonacci to find the ideal zone. Good luck...
dodogtg
WAIT FOR RETRACE

Price moving slowly, for retracement. waiting for confirmation for selling at supplay zone marking with engulfing candle
dodogtg
PULL BACK

XAUUSD after news CPI price move upward for pullback before to continue down trend
Disclaimer
Any content and materials included in Sahmeto's website and official communication channels are a compilation of personal opinions and analyses and are not binding. They do not constitute any recommendation for buying, selling, entering or exiting the stock market and cryptocurrency market. Also, all news and analyses included in the website and channels are merely republished information from official and unofficial domestic and foreign sources, and it is obvious that users of the said content are responsible for following up and ensuring the authenticity and accuracy of the materials. Therefore, while disclaiming responsibility, it is declared that the responsibility for any decision-making, action, and potential profit and loss in the capital market and cryptocurrency market lies with the trader.