
decentshaw
@t_decentshaw

What symbols does the trader recommend buying?
Purchase History
پیام های تریدر
Filter
decentshaw
Gold Regained Bullish Momentum
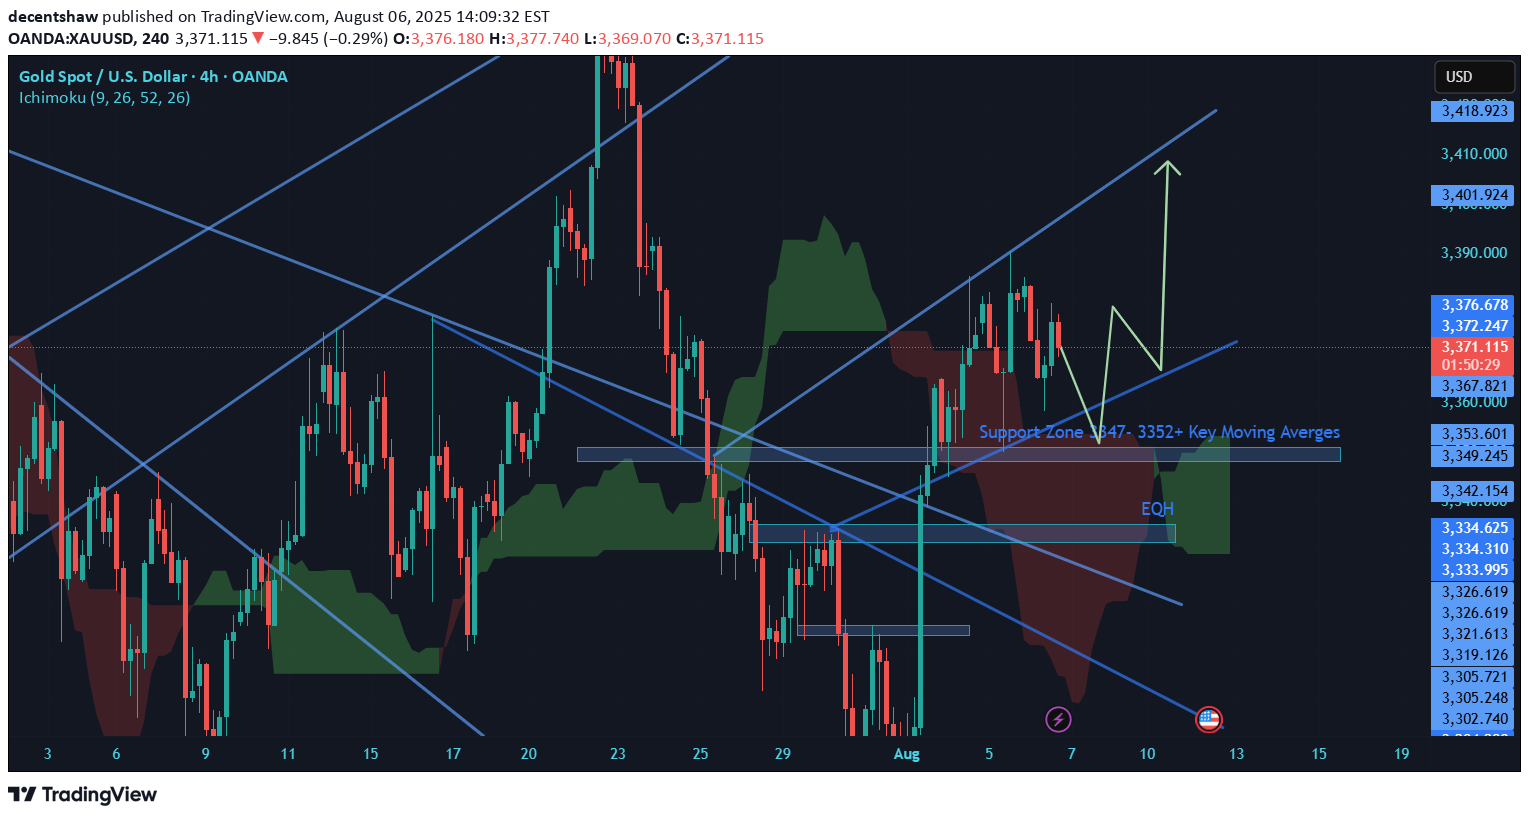
Gold Technical Update: Gold is currently exhibiting a bullish market structure, forming a bullish flag pattern on both the 4H and Daily timeframes, alongside an ascending triangle formation. Once this pattern completes, a breakout above the 3390 resistance is likely, potentially pushing the price toward the 3400–3430 zone. Price remains above the Ichimoku Cloud, which indicates continued bullish momentum and provides a strong support zone around 3345–3352, reinforced by moving averages and structural support levels. Today, the price has made a higher low at 3358, compared to the previous day’s low, suggesting strength in the current uptrend. A break above the psychological level of 3400 is anticipated, which could trigger bullish continuation toward 3430. In light of the current technical setup, I maintain a bullish outlook, expecting the trend to continue. However, this view will be reassessed if price breaks below the daily lows of Tuesday and Wednesday, and closes below the 50-day moving average. Good luck and trade safe!
decentshaw
Gold on NFP : Bearish Outlook
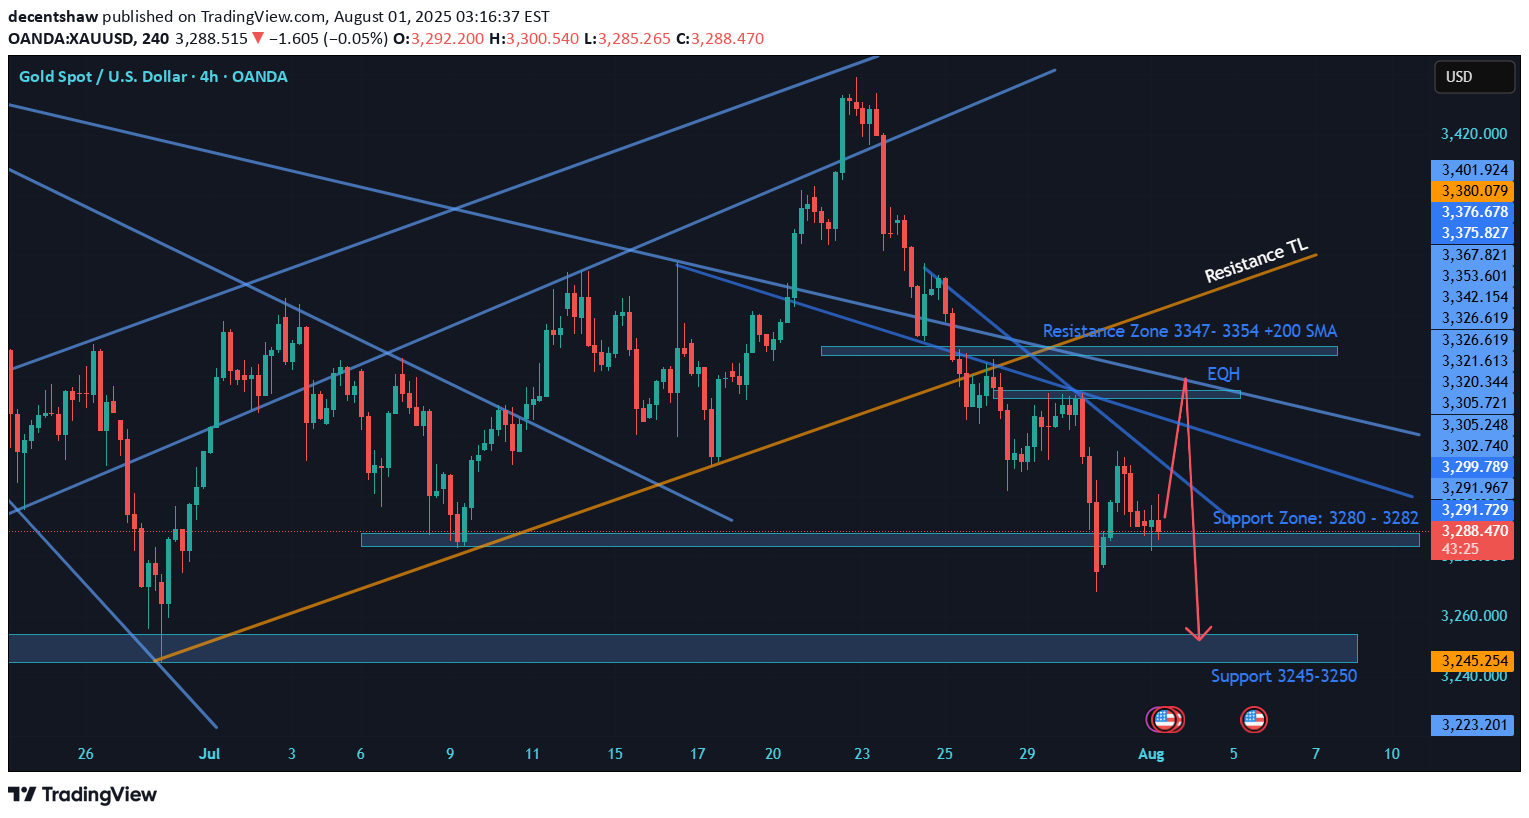
Gold is moving on fundamentals. Technical also validates the fundamental changes in market. This week’s Fundamental developments: •FED kept interest rates un changed: Bearish for Gold •Trade/tariff war seems to settle Down: Bearish for Gold. •US GDP Results Positive: Bearish for Gold •Inflation: Results High inflation in US: Bearish for Gold. Now today on Friday we have US Nonfarm payroll announcement. If the NFP also comes positive. It will add more fuel in dollar buying and DXY bullish chart will add more bullish candles. Technicals: Price structure is bearish with Head and shoulders structure at top. We are having bearish death cross on Daily chart. Last day daily candle present rejection of 3300 level. Lower chart show multiple rejections near 3300 level. In such a case I see price testing 3250 & When price breaks it 3200 on horizon. As of current 100 DMA is defending the Bulls at 3270. Chart says the rest. Good Luck !
decentshaw
Gold holds Bearish Structure- SELL
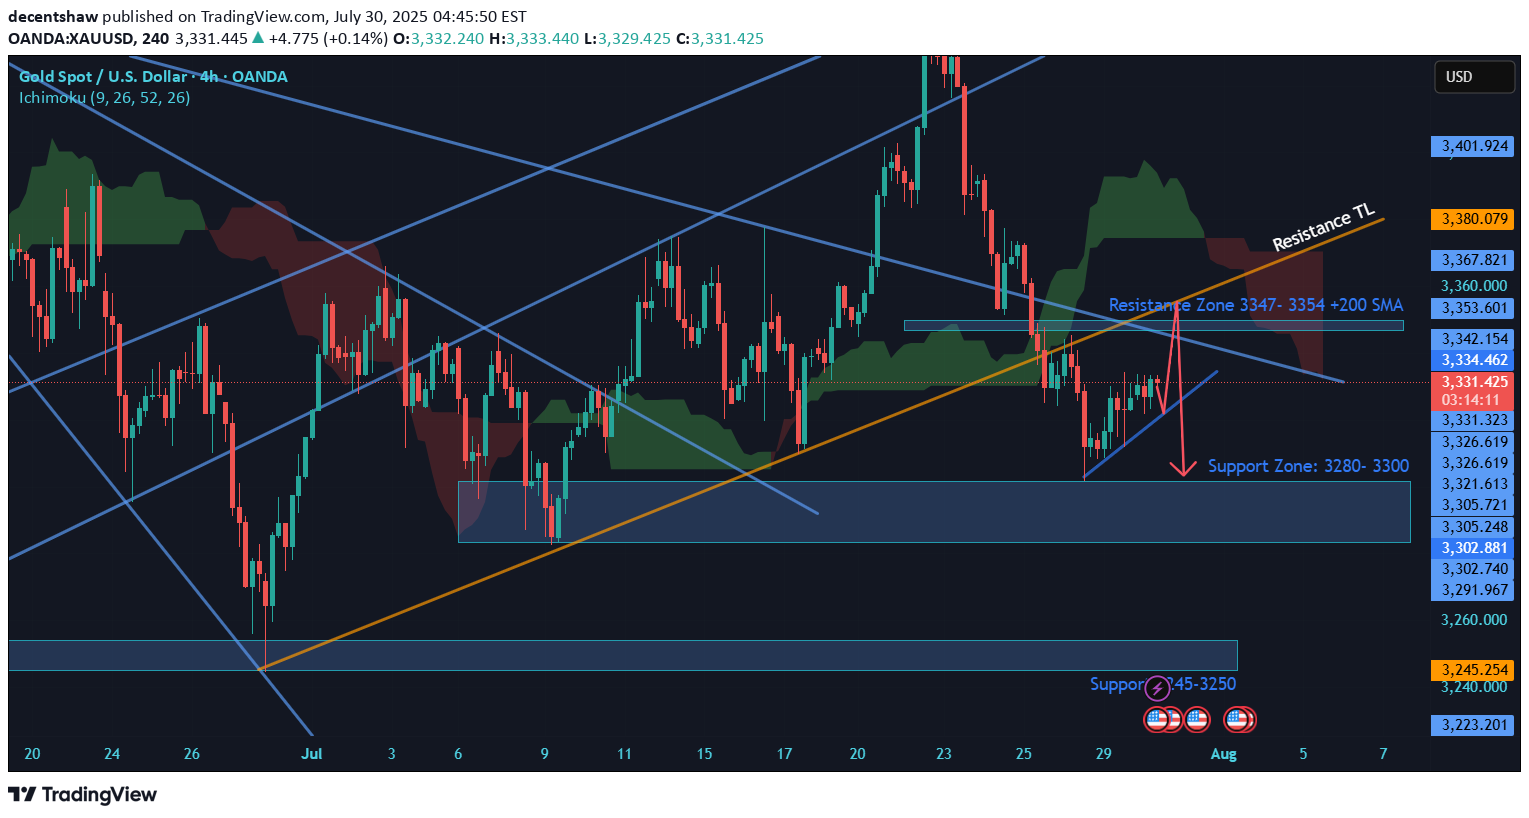
Gold: Price is Exhibiting Head & Shoulders Strcure on 4H & 1 H chart. 4 H chart is Bearish, Daily chart is Neutral to bearish. Price is under the IChimuku Cloud in 4 H. Daily chart is forming a death cross (20 SMA cutting 50 SMA) which might be completed in 1 day or Two. Currently Gold is trying to recover losses and on retracement journey. I am expecting Price to test the 3347-3354 Zone of resistance where 4H 200+100 SMA + TL resistances+ Structure resistance will likely to Push price back to 3320 & 3300 Support Zone. If price breaks the 3300 level. Then this daily candle break may take price to 3280 Support Level. Good Luck
decentshaw
Gold Scary Bearish- 3300 in-sight
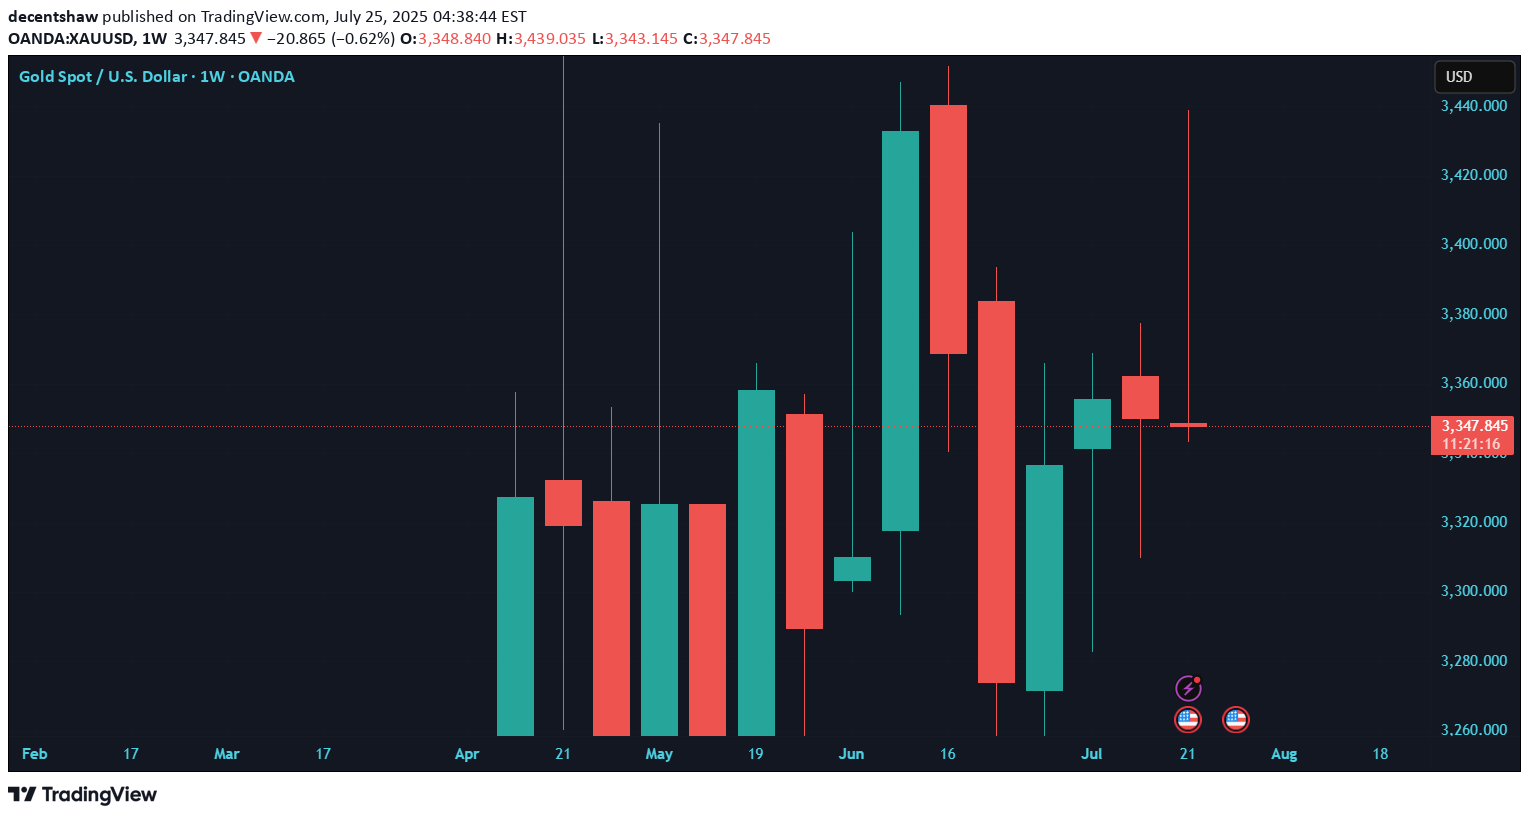
Gold Analysis: Market Structure Exhibit H& S , Rejection from 3375-77 Level Yesterday has completed the bearish H& S structure (1H+4H). Which means Price will stuck in the lower range for now ( previous Weeks) Daily Candles are three black crows which means we are going deeply down. This Weekly candle is SCARY Bearish So far. Last line of defense for Bulls is 3340-3330 Level ( Weekly Low, Trendlines & Daily Averahes support). When it is broken Price will Like to move towards 3300 Level. I Seek to Sell Gold for Last week 62 % Retracement & last Weekly Low.
decentshaw
Gold : A time for a Pullback from Double top

Gold: Price approached near Last ATH on firday. The price showed a rejection from the level. This rejection can be seen in the form of Wick on the daily chart and formation of Head and shoulders in 1H or Lower TF. I think price will pullback from this level and visit the area between 20-50 DMA. Allinging fundamentals with the technicals. Trump policy of imposing tariffs on foreign imports may increase inflation and delay the interest rate cuts. We may see 2750-2720-2700-2680 levels in the next week. Good Luck and share your views on the idea
decentshaw
Gold Price on the Go upside

Gold: Last week, market was dominated by fundamentals backed by Isarel- Iran escalation fears. Market behavior was odd and inconsistent. Thats what happen when uncertain fundamentals comes into play . We saw extreme volatility in start of the week, liquidation and slow movement in last week (relativity) in gold. Gold Weekly chart also show a loss of direction, sell off then recovery. Further about the Gold drop, the daily / weekly chart kept its upward bias. (Price found support from 50 DMA) Later in week (Friday) we saw recovery in BTC, stocks and Gold. It shows that the markets has gained its rhythm and Started to make sense Again . Remember, It is only recommended to trade a market which contains some sort of pattern, rhythm or logical behavior which was lost last week. Looks like market has regained the confidence that lost in the geopolitical Un rest Shock . Now market is eying the FED September rate cuts more eagerly. What will be its effect? It will be the first rate Cut after Years. With this, technically Gold will go up, Dollar slide down , Stocks will go higher and Yen will Go up hopefully. Gold On charts: Daily chart is bullish with Thursday bullish engulfing candle. Firday candle broke upside. On 4 H we can see a Cup with handle. I am expecting Gold to go up and 2450 as first immediate target. It is expected to be followed by 2480 and 2500 a new ATH. Good Luck and Do comment of the analysis and Odds. Support and resistance Levels S1: 2417 , S2: 2400, S3 : 2380 ( Multiple Bottom- Very Strong Support) R1: 2450 , R2: 2478, R3: 2500
decentshaw
Gold: All Set for All time High- Bullish Outlook

Gold Weekly: Daily Candle is Healthy Bullish Engulfing with no Upper wick showing the buyers are in driving seat.4 Hours candles are like 3 white soldiers. Candle formation are totally bullish.The structure that made the breakout is inverted H&S on 4H TF. The price is above the ichimuku bullish cloud in Daily , also bullish in 4H. MACD is also green. Price is above key moving averages in Daily and 4 H TF. On fundamentals side, last NFP showed mix data, In addition rate cut expectation is nearing by. Important thing to note that there in no major announcement on Monday- Wednesday next week. On Thursday there is release of CPI. So by then I think Gold will test 2400-2430-2450. That will be the weekly Target. On down side any dip towards 2370-2365 ( FIB 50-61.80 % retracement 1D) or 2352 will be a good level to enter fresh Buy with abovementioned Target. Good Luck for next Week. I Would like to hear your comments on the idea
decentshaw
Gold- Further Correction And Retracement

Weekly Chart show a Possible bearish reversal with Shooting star and Inverted Hammer kind of candle structure. Daily Chart show a spinning top followed by bearish candle. Hourly chart show a Double top/double rejection at 2180 a Head and shoulder structure in making. So what is next? This is possible reversal or strong retracement of the bullish trend. So what levels we should watch? Well first level is 2150.50 but more importantly 2144.80 the previous all-time high. If 2144.80 breaks with 1H & 4 H candle close below it. We will be going towards 2132.25 level the 20 DMA then price will take temporary support from 2132.25 level and go towards 2100. Fundamental side, I think the Gold has taken effect of June Rate cut. Now Gold will start going up with real rate cut by FED and World wide. On flip side if price crossed above 2185.50, it will negate the bearish reversal (Less probable). Also on contrary side the middle situation and Russian concert shooting situation can spark things in geopolitical peace and increase demand for safe heaven Gold. I will go with the technical. Good Luck!
decentshaw
Gold- Correction till 20 DMA

Gold: Gold is showing signs of deep correction. Last day Good US results has strengthen Dollar Across Board and this has caused the USD reciprocals selling pressure including Forex and Commodities. Today i see the correction to continue. My selling area is 2175-2184, with SL 2187.50. Target of this sell will be strong support 2150 if it this is broken, Target is 2132.5 ( 20 DMA) and 2100 long term holding target. Good Luck. This is my Analysis/strategy not a investment advice How do i see The analysis. Do comment
decentshaw
Gold - Towards New Highs

Read carefully. Gold is exhibiting Bullish Flag Structure on Daily Chart. Current Price structure is looking Like bearish (Making Lower Highs and Lower Lows) in Lower TF. But to me its consolidating with in range. (Consolidation Range: 2140-2180). Higher TF discloses the clearer picture. Currently 20 & 50 MA is restricting price movement above 2162-2165 (4H TF). And Trend line is giving resistance at 2167-2170 Region. But Once this is cleared by the price movement (Bullish Flag Breakout Near and after FOMC- June Rate Cut coming nearer) I see a clear Target of 2200-2230-2248 with in 2 Weeks horizon. How do u see the Analysis. Do CommentTarget Achieved Successfully
Disclaimer
Any content and materials included in Sahmeto's website and official communication channels are a compilation of personal opinions and analyses and are not binding. They do not constitute any recommendation for buying, selling, entering or exiting the stock market and cryptocurrency market. Also, all news and analyses included in the website and channels are merely republished information from official and unofficial domestic and foreign sources, and it is obvious that users of the said content are responsible for following up and ensuring the authenticity and accuracy of the materials. Therefore, while disclaiming responsibility, it is declared that the responsibility for any decision-making, action, and potential profit and loss in the capital market and cryptocurrency market lies with the trader.