
curtmelonopoly
@t_curtmelonopoly

What symbols does the trader recommend buying?
Purchase History
پیام های تریدر
Filter
Signal Type
curtmelonopoly
curtmelonopoly
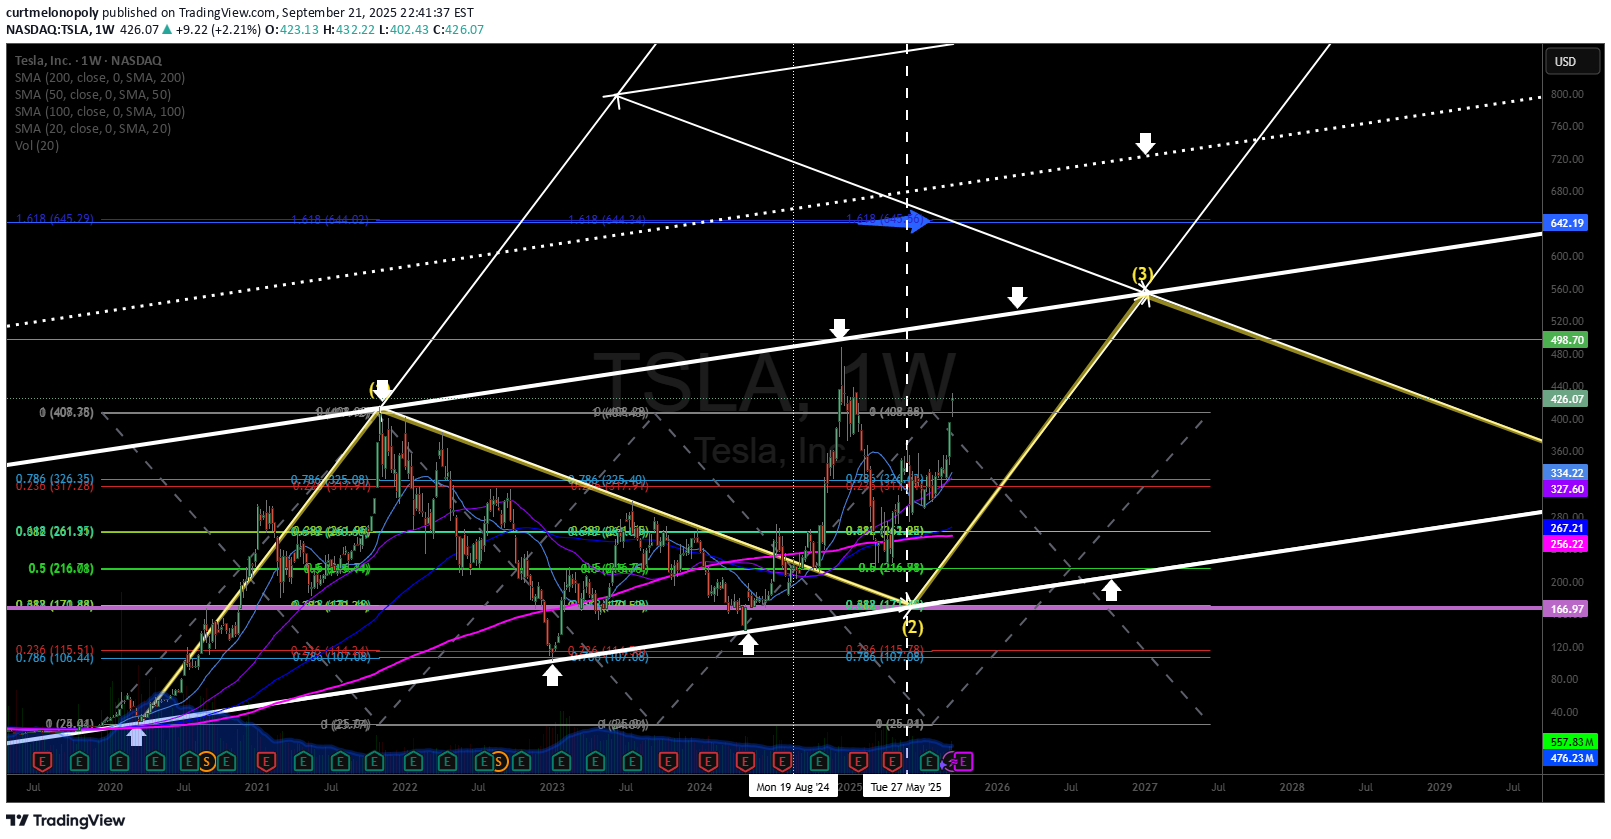
TSLA Algorithmic Weekly Model - targets 1400-1600 long term algorithmically, for now the algorithmic trendlines are support and resistance and if price breaks over upper trendline look to the white dotted algorithmic trendline as near term resistance (likely gets hit).
curtmelonopoly

curtmelonopoly
curtmelonopoly
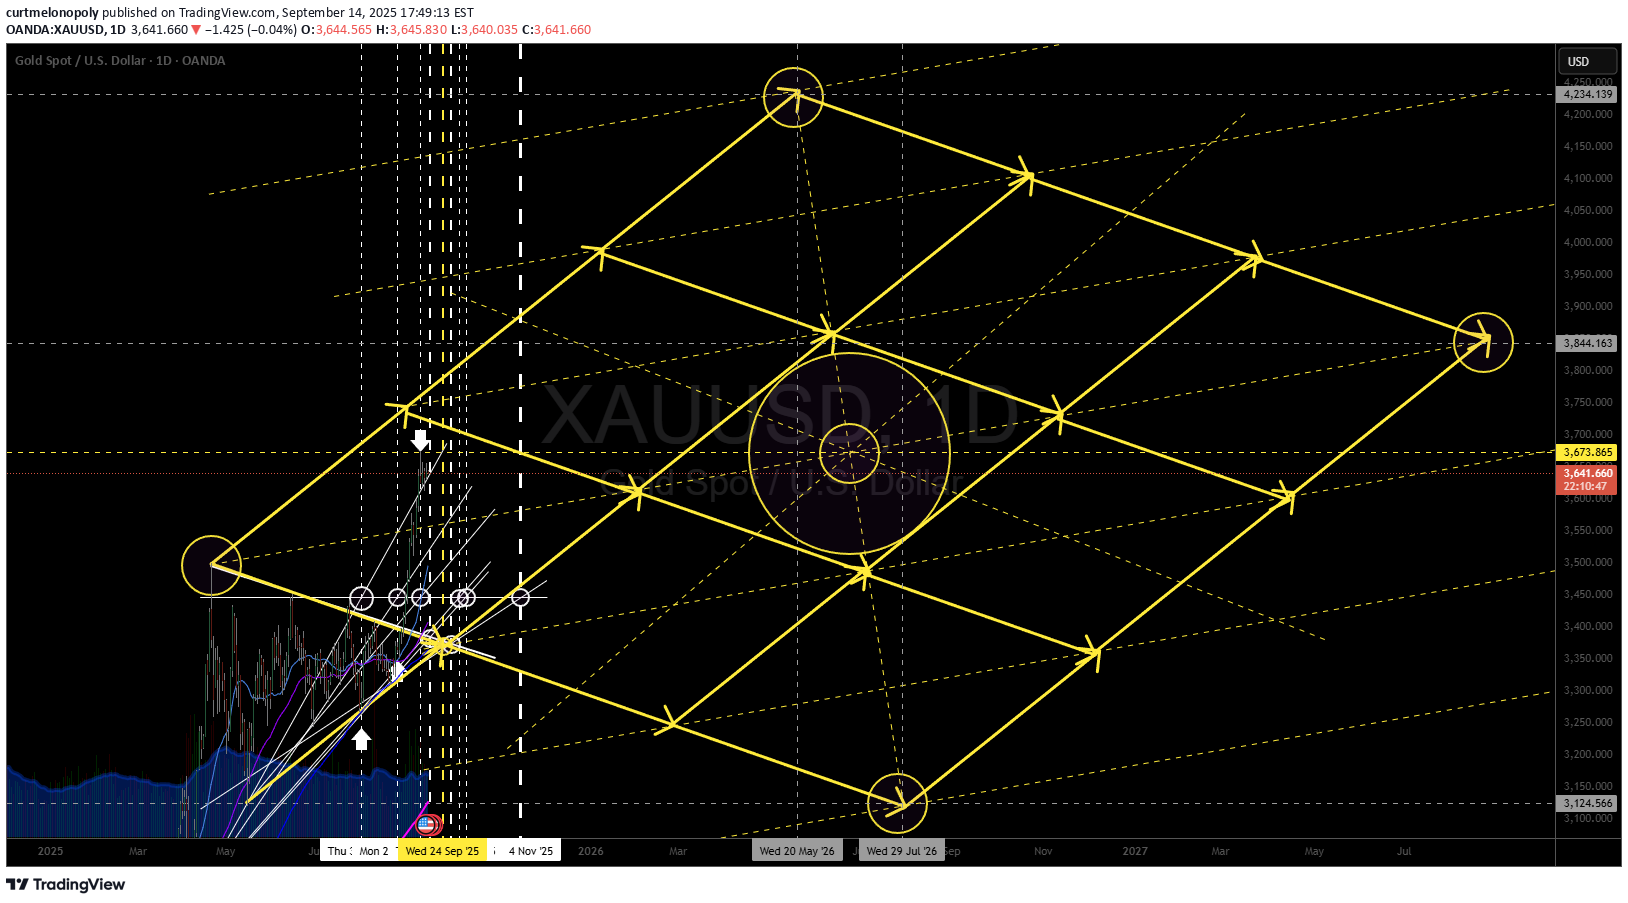
XAUUSD in the previous Gold chart I published I didn't include the algorithmic structure going forward out of this pennant. Yellow is the structure. Wed Sept 24 ish is likely a low, if bears get it at all in the 3370 area. Assuming bulls continue on parade we should see 4234.19 area prior to May 20 2026 (likely comes in quiet early). Then pull back in to mid structure at minimum 3673 iSH AND POSSIBLY EVEN 3124 late July 2026.
curtmelonopoly
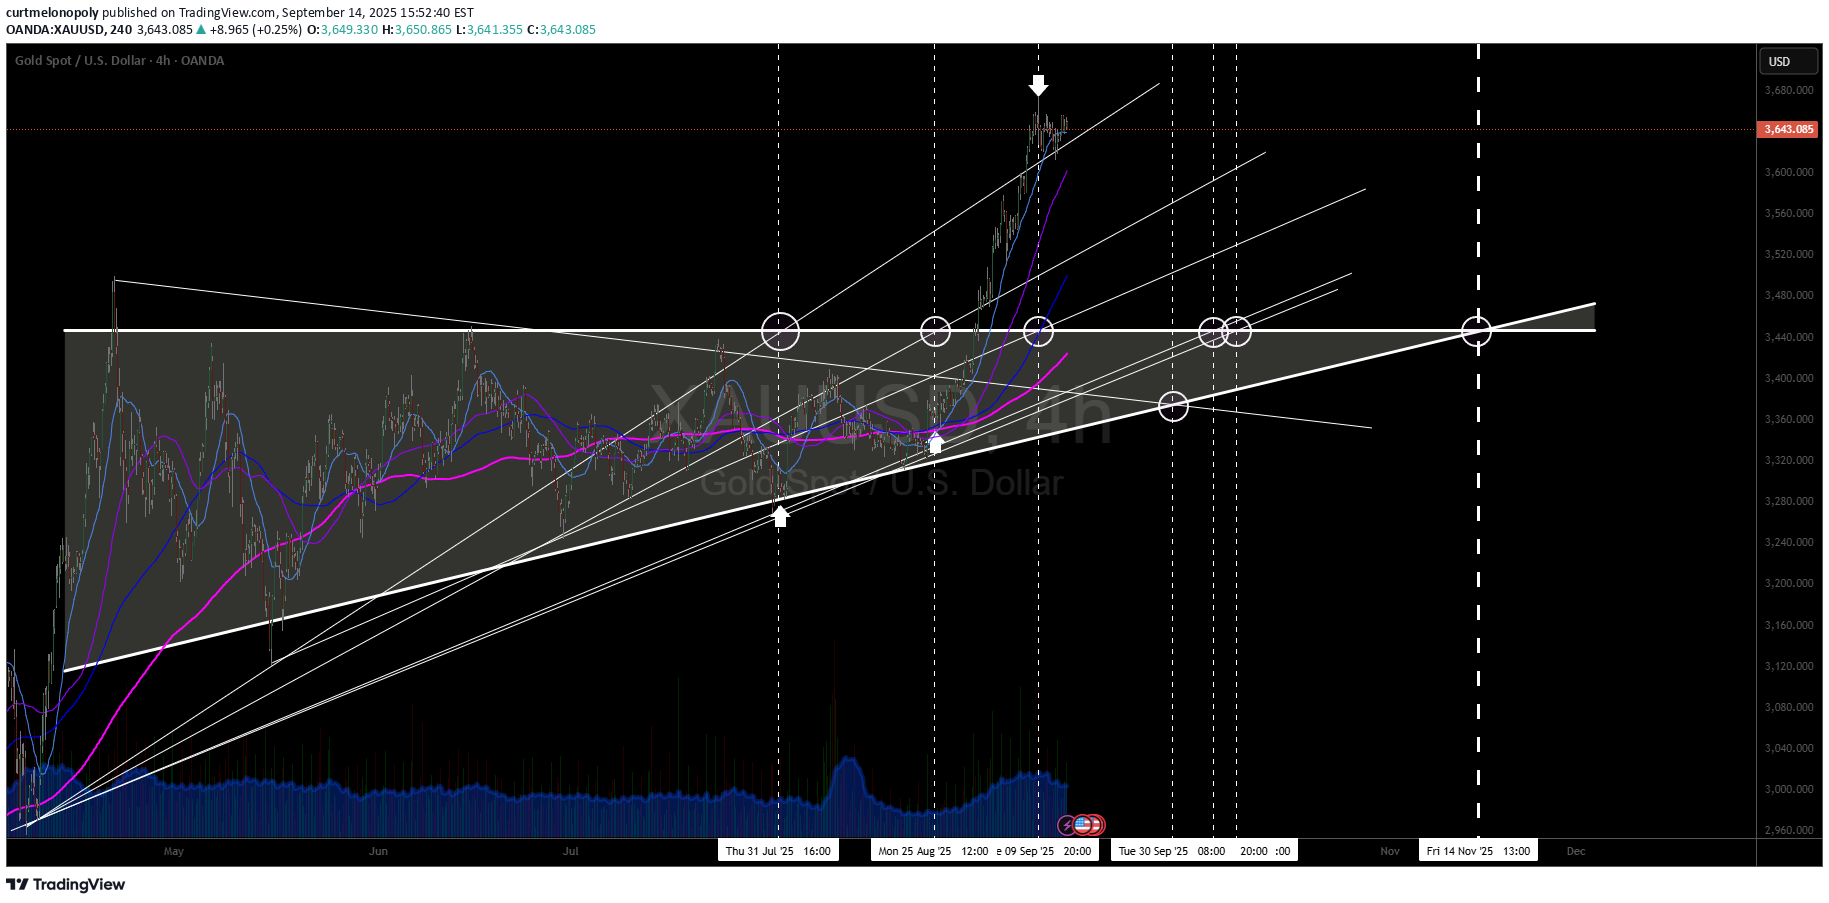
GOLD XAUUSD possible reversal dates based on where two or mor trendlines cross price. 1) Right now is timing, price has stalled for now. 2) Sept 30 3) Oct 6 4) Oct 9 5) Nov 14 (this is the primary on watch timing)
curtmelonopoly
curtmelonopoly
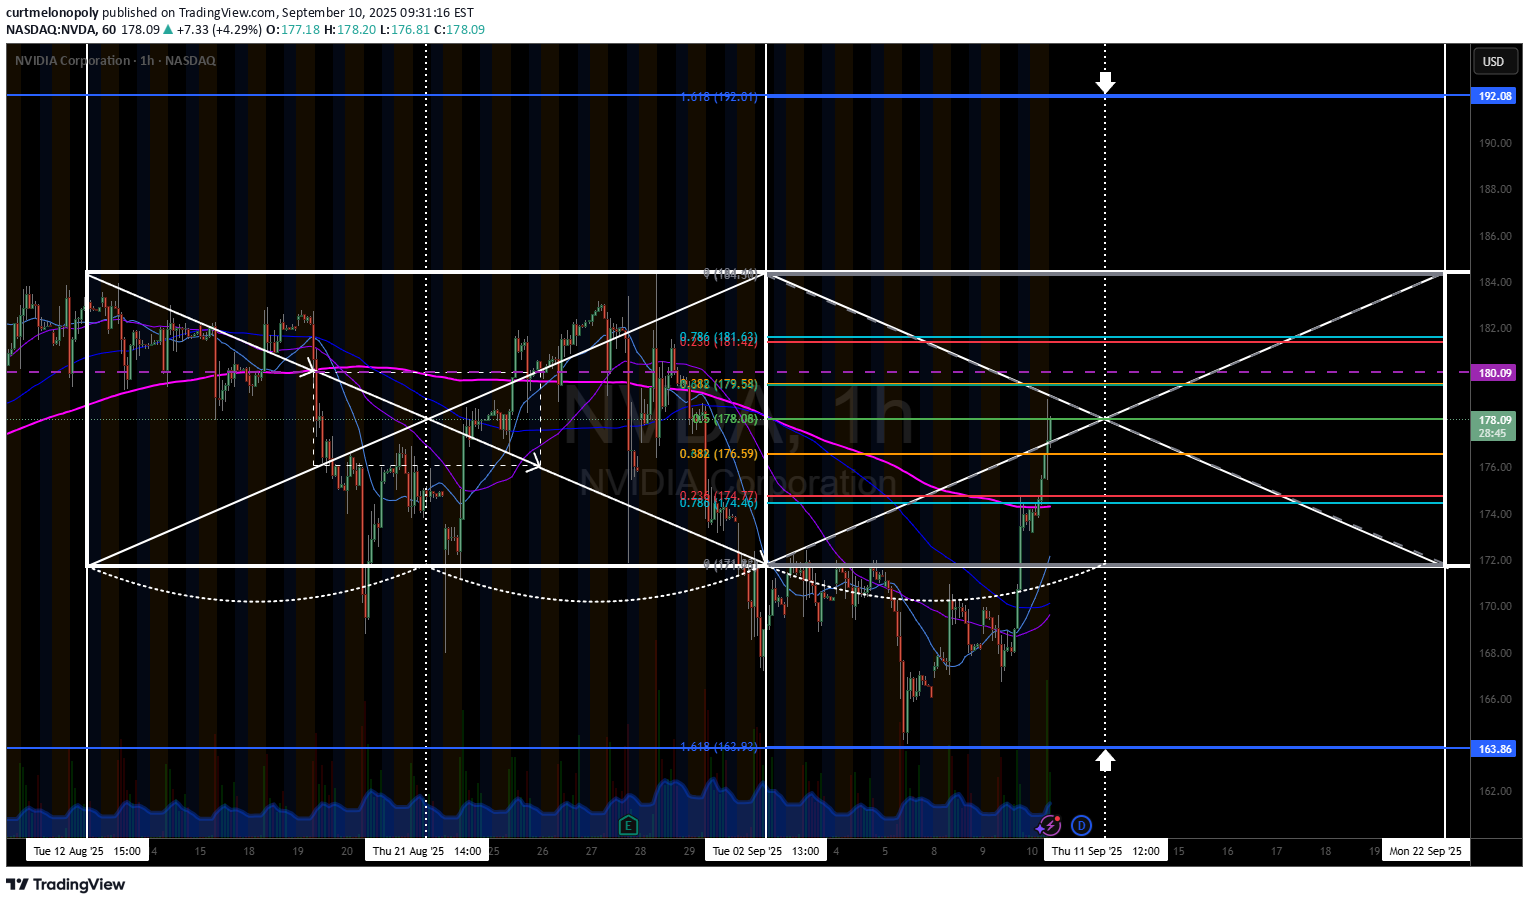
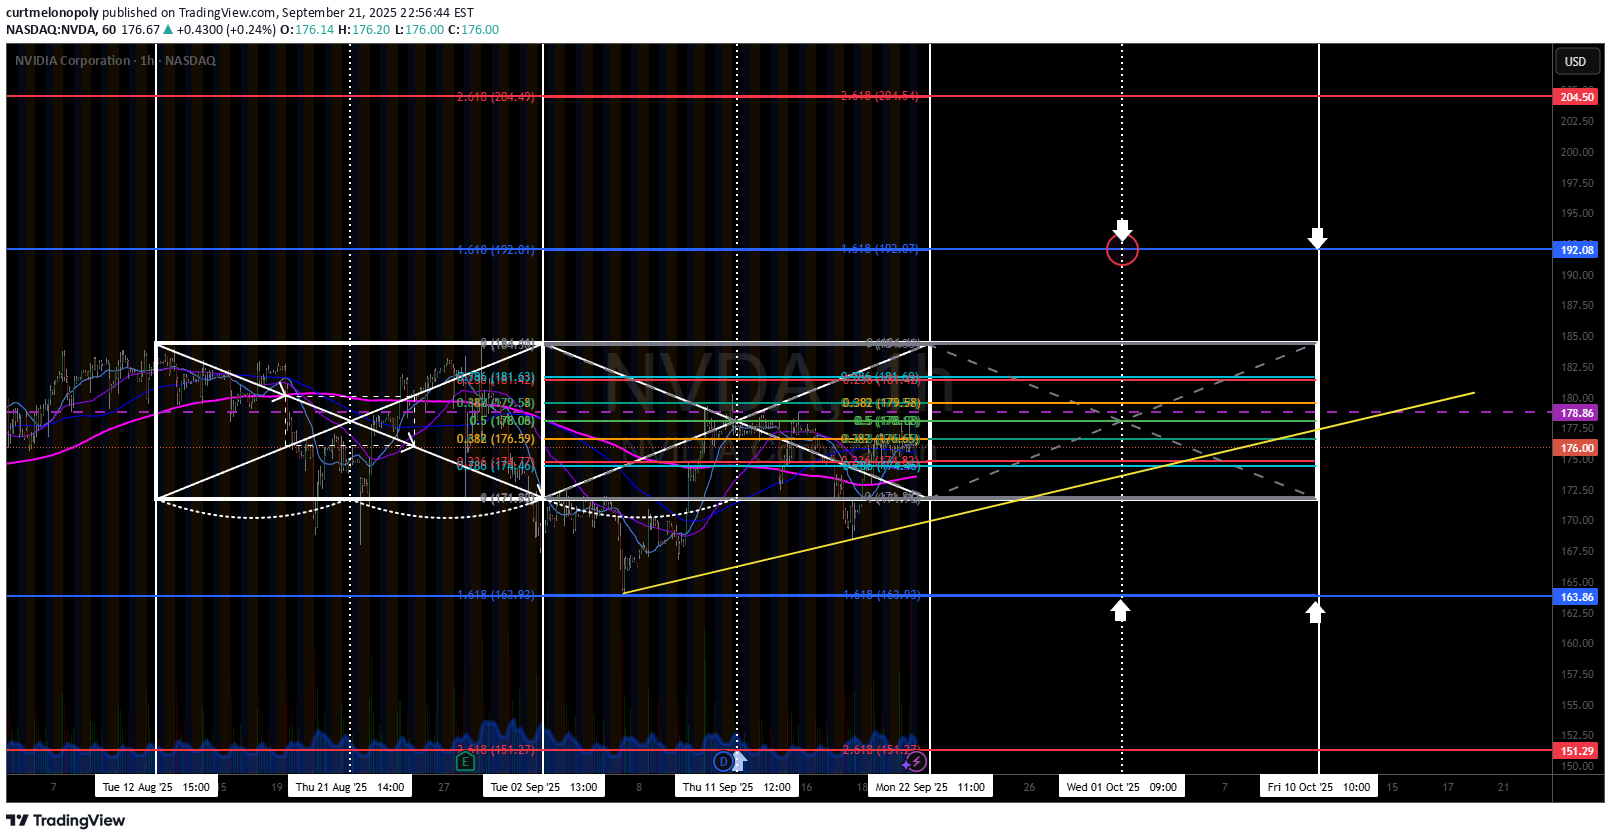
NVDA Thursday 12 noon timing Pinged the low 1st outside risk (blue) perfect. Could be a huge rally in to noon tomorrow.
curtmelonopoly
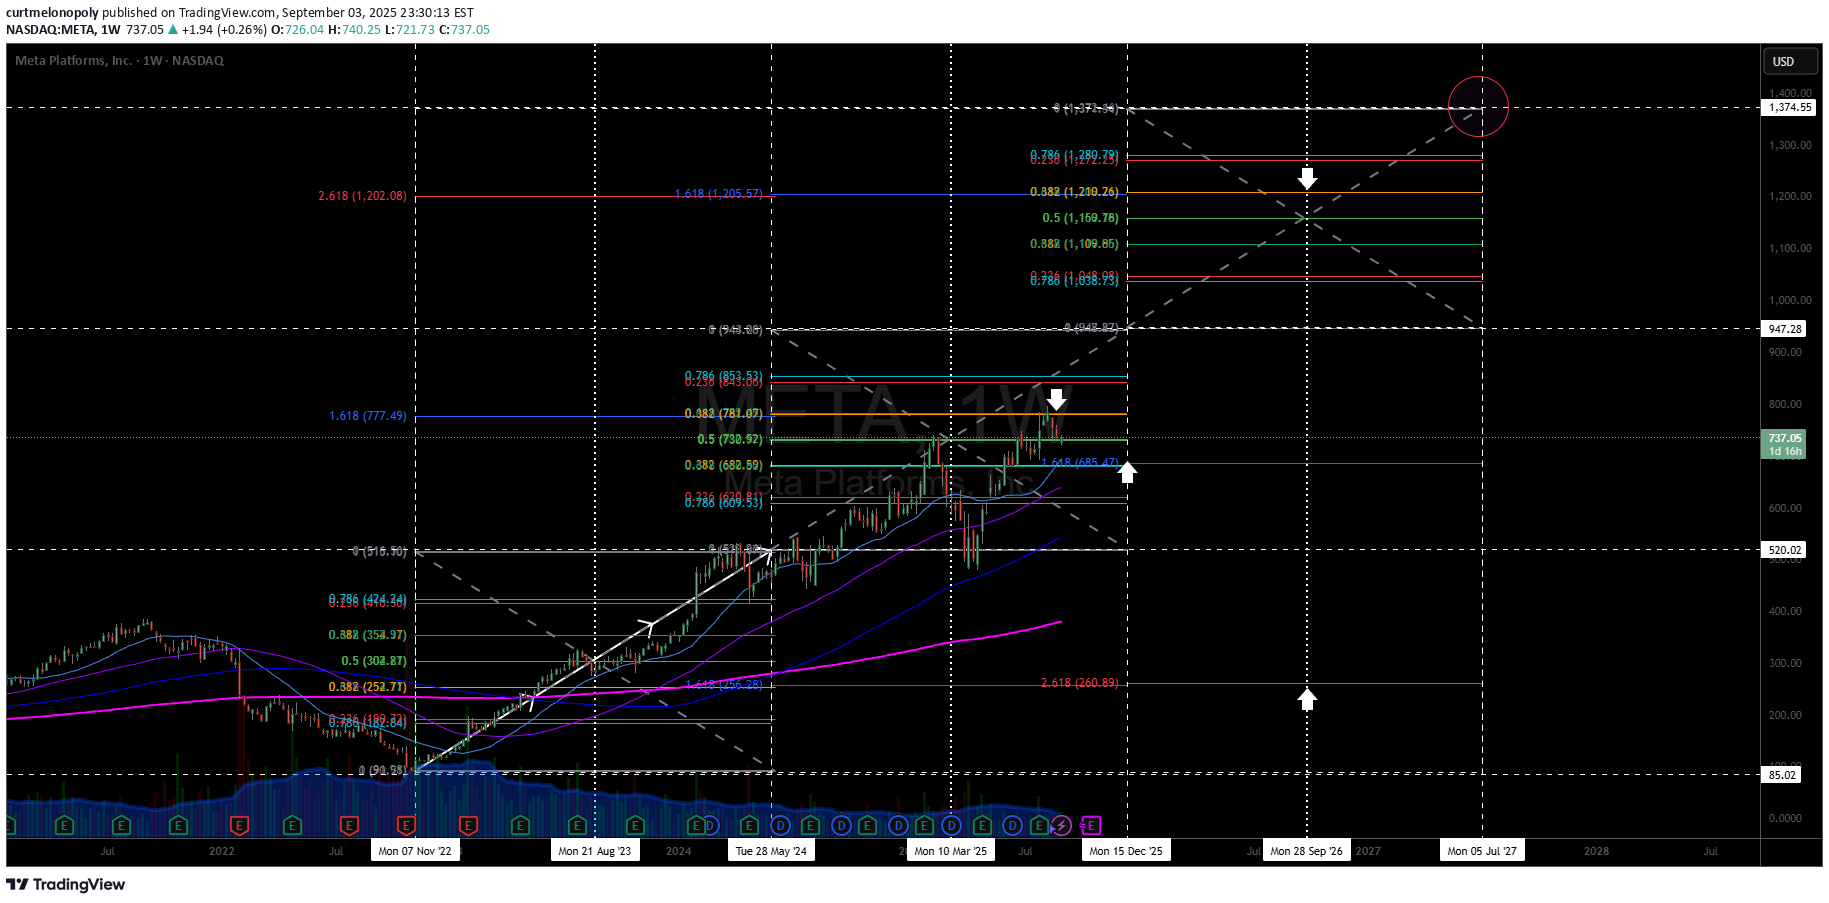
META has a crystal clear algorithmic structure for traders. The key resistance in this timing was just hit (represented as blue on our models) and the support for a bounce is just below (white arrow). Either way, July 2027 is our mark for a structural high, $1374.55 which likely hits early in to Sept 2026. Dec 15 2025 week could see (which may be the exact opposite) a significant pull back to double bottom the 3rd extension of 200 ma from bottom which would be 520s, this would be a near all in opportunity for longs. If a pull back doesn't occur there watch Sept 28 2026 week for a pullback and go.
curtmelonopoly

TSLA has a really clean algorithmic weekly structure, we've done well with trading it. There are two future targets, one being in compression for March 2028 752.40 and one if compression does not occur for Dec 2029 650.80. I would expect the compression target to hit early (my bias), June 2027 ish. Either way, the algorithmic TL's have held up well (white) and are now establishing a classical TA trendline scenario. The fibs are decent signals but the trendlines are key for trade. EPIC Agentic AI started its first long tranche at 333.87 (green arrow).
Disclaimer
Any content and materials included in Sahmeto's website and official communication channels are a compilation of personal opinions and analyses and are not binding. They do not constitute any recommendation for buying, selling, entering or exiting the stock market and cryptocurrency market. Also, all news and analyses included in the website and channels are merely republished information from official and unofficial domestic and foreign sources, and it is obvious that users of the said content are responsible for following up and ensuring the authenticity and accuracy of the materials. Therefore, while disclaiming responsibility, it is declared that the responsibility for any decision-making, action, and potential profit and loss in the capital market and cryptocurrency market lies with the trader.