
chart_hunter78
@t_chart_hunter78

What symbols does the trader recommend buying?
Purchase History
پیام های تریدر
Filter
chart_hunter78
BNBUSDT

📍We can consider yellow and gray level for purchase. If the price does not reach them, we can wait for a new optimal level to enter. 🟢yellow level: 625.2_638.8 🟢gray level: 601.2_610.0 🎯Target:694.8 🎯Target:712.0 🛑Until a four-hour candle closes below 580, this scenario remains valid. 🛑Don't forget Kendley's confirmation 📌The way to contact me:👇🏻👇🏻👇🏻 http://t.me/Charthunter_real
chart_hunter78
MKR/usdt 1H

From the blue level, price growth is expected up to the specified target. blue level: 2551_2606 Target: 2816 Entry is not allowed without confirmation
chart_hunter78
APT/USDT 4H

You can expect price growth from the green level Green level: 8.28_8.50 The RSI oscillator is close to oversold and compression is seen in the downtrend Target: 10.41 Entry is not allowed without confirmation
chart_hunter78
ARB/USDT 4H

When the price reaches the gray level, we can expect demand from the price. As a result, when the price reaches the gray level, we can look for a buy position. Our preference is the orange level, which you can use if you wish Target: 1.35 Gray level: 0.9639_1.0285 Orange level: 0.9668_0.9926 Entry without confirmation is not allowed
chart_hunter78
LOST 4H

The price is approaching its clearing levels Considering the compression in the price, we can expect price growth from the blue level. blue level: 0.00828_0.00818 Target1: 0.00941 Target2: 0.00969 If you didn't get confirmation and we didn't see the demand in the price, you are not allowed to enter
chart_hunter78
OCEAN 4H

We expect price growth from the gray level. When the price reaches the gray level, you can look for a buying position in a lower time frame (preferably 15 minutes). Gray level: 0.8067_0.8230 Target1: 0.9278 Target2: 0.9798 Target3: 1.0153 Entry is not allowed until you get confirmation.
chart_hunter78
SSV/usdt
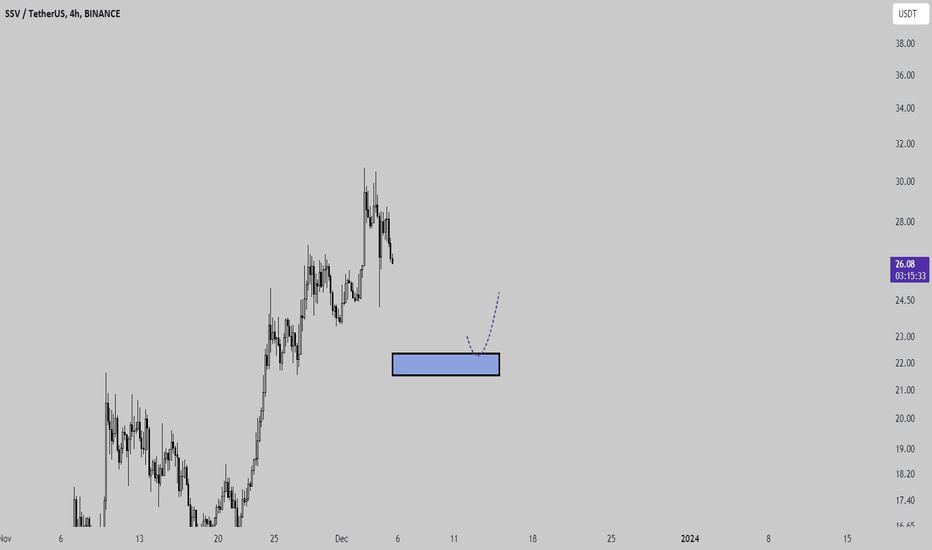
This chart is in good condition. As a result, it is worth buying. Optimal levels: 22.35-21.55
chart_hunter78
TIA/usdt

It has good conditions for growth. If you intend to buy,you can think about buying from the following two levels. Level 1: 7.42_6.7966 Level 2: 4.21_484 If the price reacts well from the first level, we can hold it up to the yellow level between 13.5288-16.4080.
chart_hunter78
BNB 4H

Two levels where you can expect a fall and a good growth of the price at these levels Supply Level:255_271.9 Demand Level:200.8_183.4
chart_hunter78
Gmee 4H

We see the Gmee chart in the 4-hour time frame. It is in good condition, you can think about buying in these three levels, but don't forget risk management and capital management First level: 0.016404_0.014987 Second level: 0.011451_0.009796 Third level: 0.007418_0.006084
Disclaimer
Any content and materials included in Sahmeto's website and official communication channels are a compilation of personal opinions and analyses and are not binding. They do not constitute any recommendation for buying, selling, entering or exiting the stock market and cryptocurrency market. Also, all news and analyses included in the website and channels are merely republished information from official and unofficial domestic and foreign sources, and it is obvious that users of the said content are responsible for following up and ensuring the authenticity and accuracy of the materials. Therefore, while disclaiming responsibility, it is declared that the responsibility for any decision-making, action, and potential profit and loss in the capital market and cryptocurrency market lies with the trader.