
cecedidit
@t_cecedidit

What symbols does the trader recommend buying?
Purchase History
پیام های تریدر
Filter
cecedidit
Gold Trade Idea 9/14/25
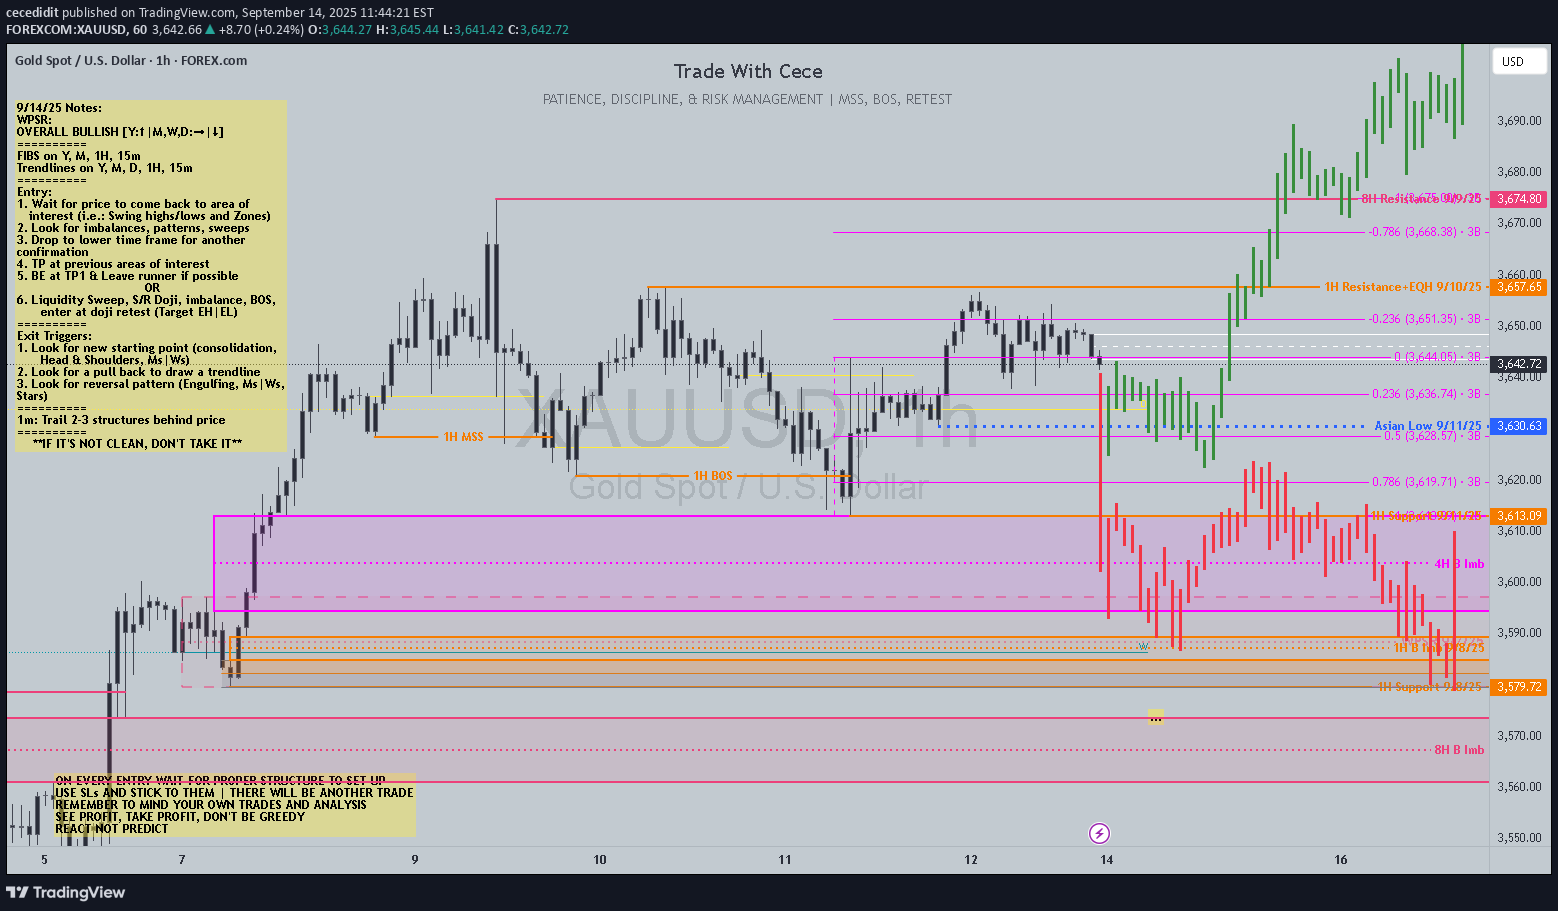
Price can go either way from where it currently is. Looking for price to return to 9/11/25 Asian Lows and return bullish OR Looking for price to break and retest current 1H Lows and continue bearishHighs drawn out have been reached. Trade idea completed Only trade I had time to take this week: 1m entry
cecedidit
XU D Buy Idea 5/18/24

I previously posted an idea "XU W Sell Reversal OR Sell to Buy Idea 5/4/24". Price did not sell and immediately continued bullish. Looking for price to still head to the -27% FIB area around 2555.32 for final TP from the previous trade idea. Currently in a buy with TP actually set for the -27%, while looking for another pullback on the daily to get another entry. **This is for educational purposes only and this is not financial advice because I am not a financial advisor.**Possible double bottom forming at the top of the daily consolidation zone. So it is very possible that price will continue bullish into the week of 6/2/24. As always, we have to wait and see what price wants to do and react to it.Idea complete SL hit
cecedidit
XU W Sell Reversal OR Sell to Buy Idea 5/4/24

Sell Reversal Looing for Gold to come back and break Aprils Low at around 2228.59 & the 50% FIB area of the current W bullish swing at around 2202.35. If these areas are broken, I would look for a H&S (Head and Shoulders) to form for a bearish continuation/reversal of the current trend. TP1 around 1931.77 current swing low | TP2: around 1810.50 swing low | TP3 around 1616.71 final low of this current bullish swing OR Sell to Buy Because price on the weekly has completed an impulse and recently reversed for the correction to start, price could actually just pull back to the 38.2% weekly FIB area around 2256.44 and then just continue bullish to at least the -27% FIB area around 2555.32 for a final TP of this idea. **This is for educational purposes only and this is not financial advice because I am not a financial advisor.**Price did not sell to the 38.2% area of the FIB and has decided to continue bullish. Still looking for price to head to the -27% FIB area around 2555.32 for final TP. Currently in a buy with TP actually set for the -27%, while looking for another pullback on the daily to get another entry.1:36.3RR completedPrice consolidated and then continued bullish. None of my bars played out the way I thought it would, BUT price did go bullish in its own way.
cecedidit
Gold 4H Sell Continuation Idea 9/30/23

At market close, price has closed below 50% of the 3/13/23 D B FVG, but price is in the top 50% of the 3/17/23 4H B FVG. PLUS price closed with a bearish engulfing on the 8H. Since price is in a downtrend I am looking for price to continue down another 300 pips to the 2023 yearly open. Depending on the type of trader you are I see 3 possible entries from where price currently is: 1. 4H S Fractal If you trade fractals you should already be in this trade. You may see some pull back, but until I see some bullish pressure, I'm looking for price to continue a good 300 pips to the 2023 yearly open 2. 4H B FVG If you are a counter trend trader, you can get a good 140+ pips out of a possible pullback to the 4H S FVG that has been created in the drop before market close Friday 9/29/23. If not stay out and wait for more sell confirmations to get back in the sell 3. 4H S FVG If price does pull back, I'm not looking for more than a good 150 pips into the gap that was created at Friday market close. So from there you can catch the sell continuation down to the 2023 yearly open minimum. The next low is WAY below that. As we know, price does what it wants to do, so be careful and wait on your confirmations. Happy Trading!!Price has passed the 2023 open price and is continuing bearish. Looking for price to hit at least the next daily zone around 1805 ================== Moved my SL to BE to soon so previous trades got stopped out, but these 2 are still running with .01 lots on them!!2023 Yearly open hit and price reversed #20230930Gold4HComplete
cecedidit
Gold 4H S Idea 9/23/23

Looking for Gold to continue bearish when market opens. Price is currently wicking and refusing to go higher at market close on Friday. There is a 4H liquidity zone where price is refusing to break. I'm expecting a 4H sell fractal to print after market opens. Lets see what happensTPs hit
cecedidit
Gold D Sell Idea 7/29/23

Gold D has formed a M. Friday was the retest of the neckline for that M. There has also been a bearish break and retest of a W trendline on the daily. The 4H has hit 50% of the FVG (fair value gap) that was created and started to drop. The W trendline has not been closed above on the 4H time frame. The 1H has created an evening star at the 4H FVG, also having a bearish break and retest on the W trendline. Looking for price to continue bearish possible to the D Zone created 7/6/23 around 1911.00. At the least price should fall to Fridays low around 1945.53, a good 137+ pips from where price closed on Friday.Got stopped out. Lets see if I can find another entryTarget hit
cecedidit
Gold D Short Term Sell Idea 5/21/23

The daily (D) has played out to the downside as I thought it would do if it was to break bearish at 50% of the D fair value gap (FVG) zone that it has been playing around in. Price has not hit the previous month low (PML) yet, but it should do that this upcoming week if price decides to continue bearish. As I predict that it will. If price does not continue bearish it will definitely continue bullish to take out/just tap previous month high (PMH) again. For the STRATers, the D has formed a 21 pattern and I anticipate that we will get a 2d to continue bearish at least into the 50% area of the W B FVG zone/breaker.Gold took the whole week almost to drop and hit the previous week low, but it finally did it. Still looking for price to go lower, so if you can find a good sell entry, go ahead and take it!!TP hit on this idea
cecedidit
Gold W Buy Idea 5/20/23

Gold is still at all time highs at the moment, so I am still not sure if it will go higher and break the previous month high (PMH)/the monthly high from 3/1/22 again OR break and retest this weekly (W) zone that it is currently playing in and go bearish again. I do know that there is a M liquidity zone + a W B (buy) FVG (fair value gap) right under where price is currently at. For the STRATers, The W has formed a 2-1-2d-Rev. So what I would like to see price do is break down to the W B FVG and bounce back bullish to hit the PMH(s).Price continued down this week. Still looking for gold to drop lower into the W FVG. Gold could continue with a straight drop next week or retest the area that price just left. For those trading patterns, a large M was created and next week could be a retest of the neckline. Lets see what price does next week.Price finally wicked into the W B FVG (fair value gap) zone and bounced back up. I did not catch this entry, but the idea is still open. I have not mastered pending orders yet and was focused on another pair when price hit the entry area I was looking for. Looking to see what the market does at market open, but there are several inverted head and shoulders on lower time frames that make me think price will continue bullish.
cecedidit
Gold 30m Buy Idea 5/13/23

Looking for price to sell down into the 5/15/30m B FVG (fair value gap) and then buy back up to a minimum of Friday's High (2022.60). Will have to see what price does at market open tomorrowSooo apparently my SL was too tight because the limit activated and hit SL within 17 minutes. I was sleeping so I don't know if the spread opened up OR if price just wicked the SL. 2002.57 is where price went and my SL was 2002.60I had a 5m limit that also activated and hit SL, BUT it would've hit the TP on the 5m entry where at the time of this post the TP for my 30m entry has not been hit and price appears to be continuing to drop at this time.Price is still playing within a 4H zone + bouncing around between a 4H FVG and D FVG zone. So there is definitely some consolidation going on with Gold right now #20230513Gold30mComplete
cecedidit
Gold 4H Buy Idea 5/6/23

Gold has created a 4H sell FVG that price could buy back up to OR break thru. So I will enter a buy into the FVG + for those who know The STRAT see that a failed 2d was created followed by a 2u, which is a double confirmation that price should at least go to the 50% of the FVG.The 50% area of the 4H FVG was hit, but I got out of the trade early to secure profits and to not be greedy. I was getting distracted with other responsibilities and didn't want the trade to go negative while I was not paying attention. Overall, can't be mad. Profits secured and TP was actually hit as I thought it would do. Price may continue bullish if it can break the 1H consolidation that it is currently in and go bullish. Will look for another entry.If you continued to follow this idea there was another entry to buy at the bottom of the FVG and buy back up to previous week's high
Disclaimer
Any content and materials included in Sahmeto's website and official communication channels are a compilation of personal opinions and analyses and are not binding. They do not constitute any recommendation for buying, selling, entering or exiting the stock market and cryptocurrency market. Also, all news and analyses included in the website and channels are merely republished information from official and unofficial domestic and foreign sources, and it is obvious that users of the said content are responsible for following up and ensuring the authenticity and accuracy of the materials. Therefore, while disclaiming responsibility, it is declared that the responsibility for any decision-making, action, and potential profit and loss in the capital market and cryptocurrency market lies with the trader.