
c0dew1zard
@t_c0dew1zard

What symbols does the trader recommend buying?
Purchase History
پیام های تریدر
Filter
الگوی مثلث متقارن بیت کوین: هدفهای صعودی و نزولی تا ۱۱۰ هزار دلار!
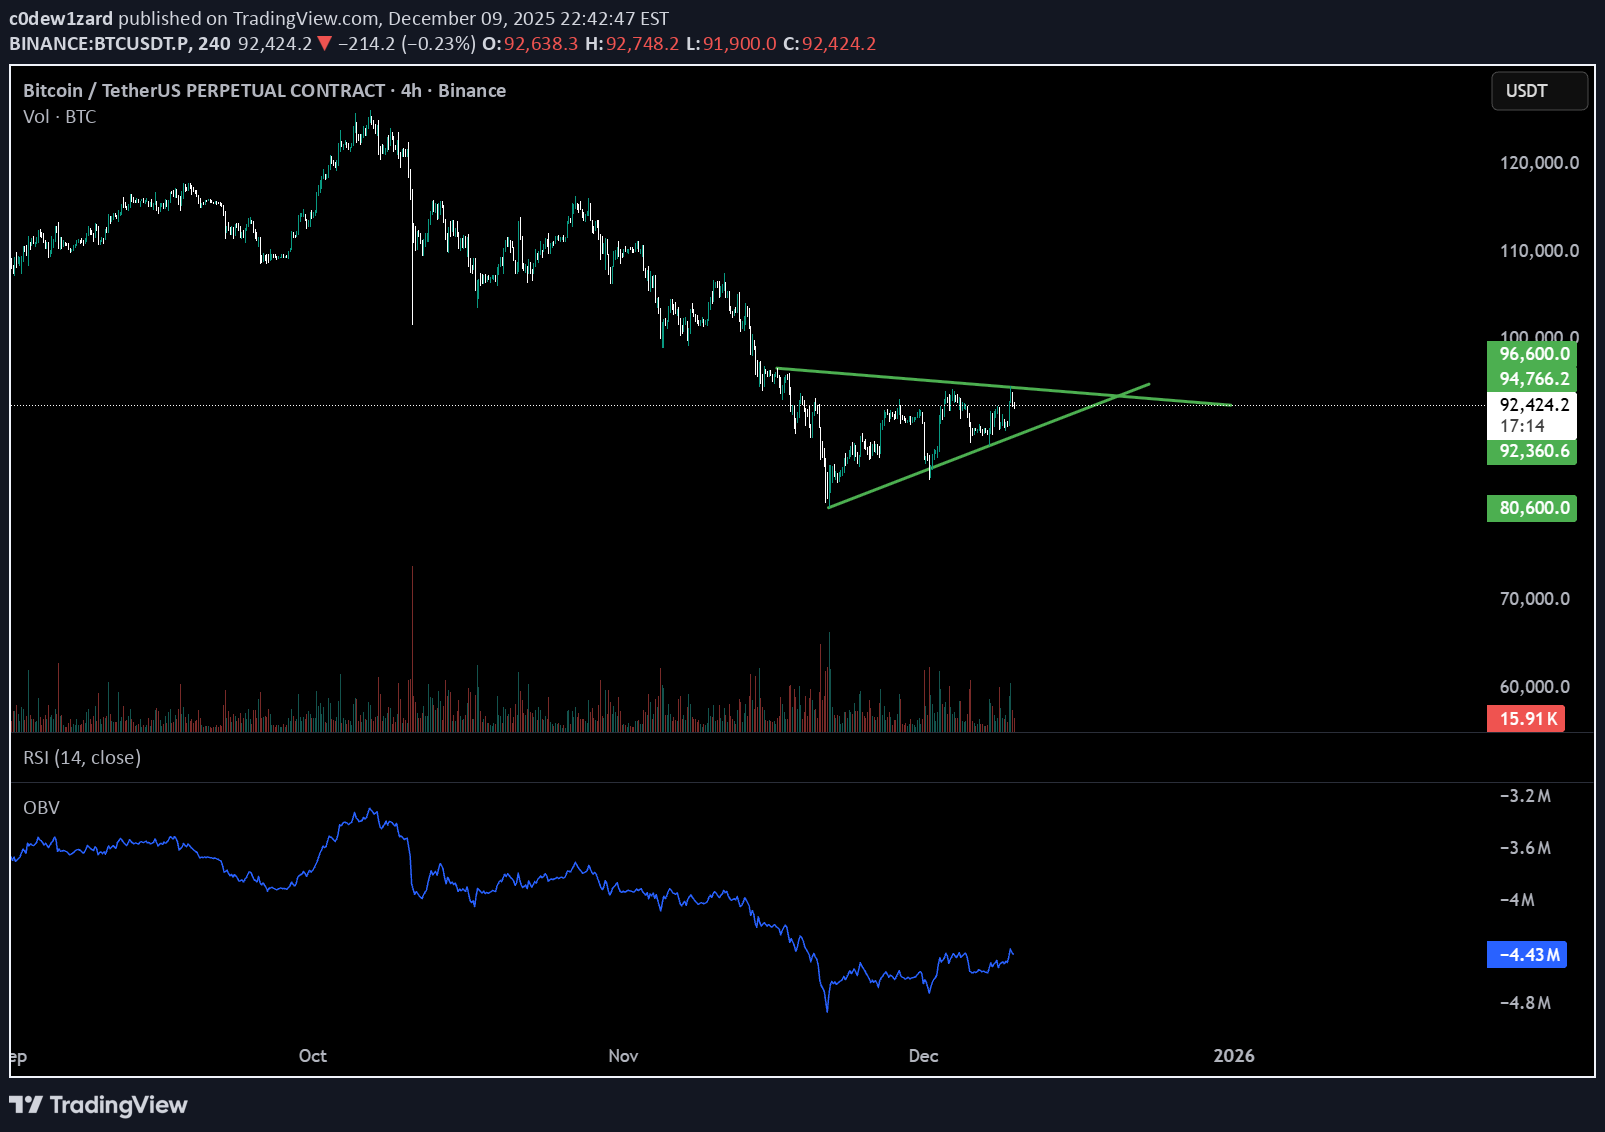
✅ 1. Measure the triangle height A symmetrical triangle target = Height of the widest part of the triangle → projected from breakout point From your chart: Top of triangle: ≈ 96,600 USDT Bottom of triangle: ≈ 80,600 USDT Height = 96,600 – 80,600 ≈ 16,000 So the measured move is ~$16,000. 📈 2. Bullish breakout target Breakout area looks around 92,000–94,000 depending on how you anchor it. Using 93,000 as midpoint breakout zone: Bullish target = 93,000 + 16,000 = 109,000 USDT Bullish target range: ➡️ 108,000 – 110,000 USDT This lines up with the psychological 110K zone, which would likely create resistance. 📉 3. Bearish breakdown target Breakdown would occur near 88,000–90,000 depending on exact slope. Using ~89,000 as average: Bearish target = 89,000 − 16,000 = 73,000 USDT Bearish target range: ➡️ 72,000 – 74,000 USDT This also lines up with the major liquidity zone around 72K–74K. 🎯 Final breakout targets Bullish breakout target: ⭐ 108,000 – 110,000 Bearish breakdown target: ⭐ 72,000 – 74,000
Disclaimer
Any content and materials included in Sahmeto's website and official communication channels are a compilation of personal opinions and analyses and are not binding. They do not constitute any recommendation for buying, selling, entering or exiting the stock market and cryptocurrency market. Also, all news and analyses included in the website and channels are merely republished information from official and unofficial domestic and foreign sources, and it is obvious that users of the said content are responsible for following up and ensuring the authenticity and accuracy of the materials. Therefore, while disclaiming responsibility, it is declared that the responsibility for any decision-making, action, and potential profit and loss in the capital market and cryptocurrency market lies with the trader.