
bruceyam
@t_bruceyam

What symbols does the trader recommend buying?
Purchase History
پیام های تریدر
Filter
bruceyam
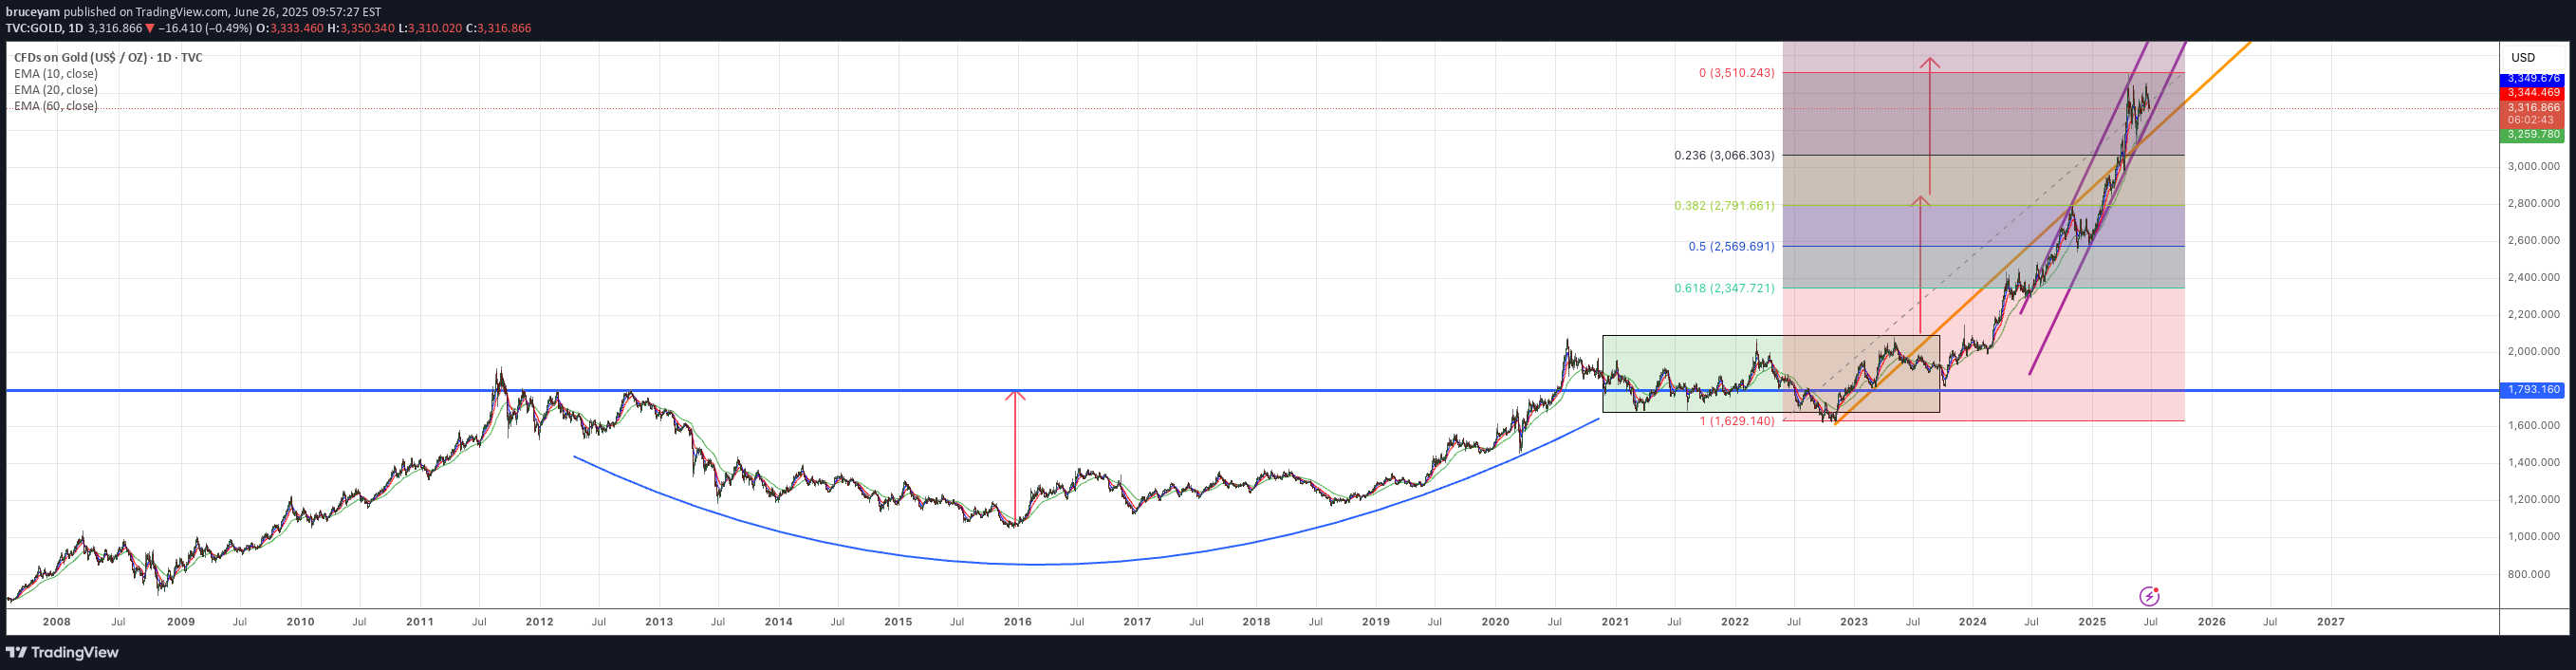
پایان موج پنجم طلا (XAUUSD)؟ قله امروز، زنگ خطر اصلاح قیمت ۳۲۰۰ را به صدا درآورد!

Gold has staged a remarkable rally since 2022, accelerating after breaking out of the cup and handle pattern in March 2024. Following this spectacular surge, prices have now touched the upper boundary of the channel, likely marking the completion of the fifth wave. A correction toward the 38.2% support level at 3200 could be on the horizon. Gold enthusiasts, please fasten your seat belts—volatility may be ahead.Let’s watch how gold closes today and tomorrow. If the price moves lower and forms a bearish weekly candlestick, it will likely confirm the wave count.
bruceyam
Could we be entering another phase of gold consolidation?
Gold's impressive rally from 2023 to 2025 completed the two-fold formation of the cup-and-handle pattern. Notably, while gold would typically rally in response to heightened geopolitical tensions—such as the Israel-Iran conflict and the B2 bombing of nuclear power plants—it has instead shown resilience by retreating and displaying minimal sensitivity to these events. This unexpected behavior suggests that gold may be entering a consolidation phase despite the prevailing uncertainties. As a Tier I asset under Basel III regulations, gold remains a fundamentally strong investment and is expected to resume its upward trajectory, reaching new all-time highs post-consolidation. The $2,800–$3,050 range presents a favorable entry point for market participants.
bruceyam
gold consolidation

Gold has rallied since 22 October, with the latest surge starting on 23 October. While the long-term outlook remains bullish, short-term consolidation will not be a surprise
bruceyam
Cup-and-Handle Success? Gold Nears Its First Major Target!

In early February, JPMorgan and HSBC requested significant physical gold deliveries from COMEX, spurring a notable withdrawal of gold stocks from LBMA and shipments to COMEX vaults—this activity, coupled with market rumors of potential gold tariff adjustments and revaluation, created volatility. However, the U.S. Treasury dismissed any plans for revaluing gold, and profit-taking alongside reduced delivery notices slowed the pace of withdrawals. Technically, gold has achieved its first target following a breakout from a cup-and-handle pattern. With prices nearing $2,700, a correction and consolidation phase is likely before further upward momentum.
bruceyam
SPX at CrossRoad
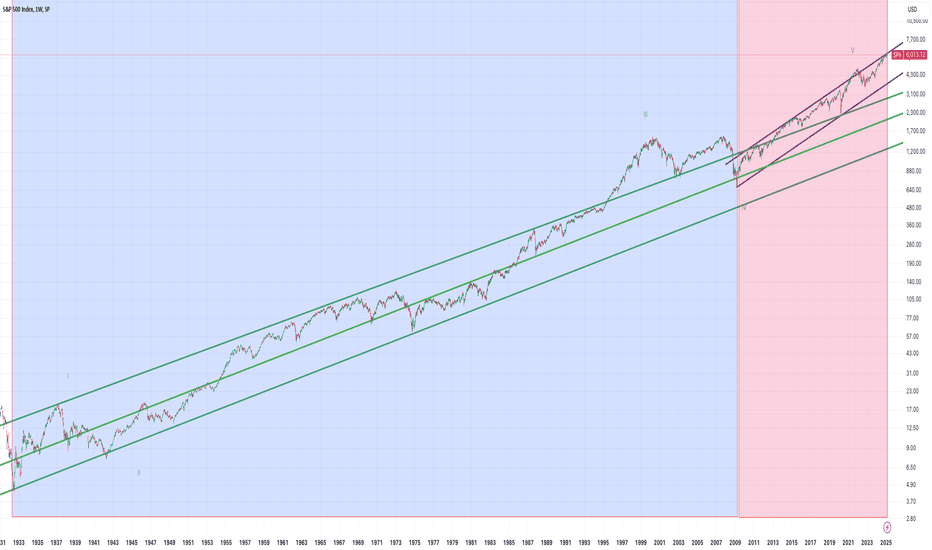
The chart illustrates the logarithmic scale of the S&P 500 index since 1933. From 1933 to 1997, the index consistently followed an upward-sloping channel. Key years such as 1942, 1949, 1974, and 1982 saw the index test the lower boundary of this channel. However, since 2009, following the introduction of quantitative easing (QE), the uptrend has shifted to a steeper slope. With the Federal Reserve hesitant to lower interest rates and the forces of de-globalization gaining momentum, the question arises: Can artificial intelligence (AI) emerge as the savior, propelling the S&P 500 to new highs? Or will the growing debt burden, combined with tighter monetary policies and the effects of de-globalization, finally break the index's back? What are your thoughts? Please share. I believe interest rates will continue to climb as investors demand higher premiums to compensate for heightened risks in the debt market. This could exert considerable pressure on stocks.
bruceyam
Gold’s Friday Close Could Define Its Near-Term Potential

This is a 15-minute chart of gold, and today is Friday. Currently, gold is showing a smaller price range, and the gap between the gold price and the 10-day moving average (960) is narrowing, indicating that the upside momentum is weakening. If gold closes below the 10-day moving average this week, it will mark the first time since January 13, 2025, that it has done so. Otherwise, gold may retain upside potential as we approach the end of the first quarter. This week, Gold's performance highlights its resilience as a safe-haven asset and raises questions about whether its momentum can persist or if a pullback is imminent.
bruceyam
gold cftc report

GOLD - COMMODITY EXCHANGE INC. Code-088691Disaggregated Commitments of Traders - Futures Only, December 03, 2024 ------------------------------------------------------------------------------------------------------------------------------------------------------------- : : Reportable Positions : Nonreportable : : Producer/Merchant/ : : : : Positions : Open : Processor/User : Swap Dealers : Managed Money : Other Reportables : : Interest : Long : Short : Long : Short :Spreading : Long : Short :Spreading : Long : Short :Spreading : Long : Short------------------------------------------------------------------------------------------------------------------------------------------------------------- : :(CONTRACTS OF 100 TROY OUNCES) : : : Positions :All : 462,040: 10,967 73,308 32,964 256,898 19,320 203,580 22,845 28,552 104,031 25,030 14,289: 48,337 21,798Old : 462,040: 10,967 73,308 32,964 256,898 19,320 203,580 22,845 28,552 104,031 25,030 14,289: 48,337 21,798Other: 0: 0 0 0 0 0 0 0 0 0 0 0: 0 0 : : : : : Changes in Commitments from: November 26, 2024 : : -10,620: -3,342 -8,081 119 18,613 -5,903 -16 -1,461 -459 4,226 -3,727 -7,008: 1,763 -2,594 : : : : : Percent of Open Interest Represented by Each Category of Trader :All : 100.0: 2.4 15.9 7.1 55.6 4.2 44.1 4.9 6.2 22.5 5.4 3.1: 10.5 4.7Old : 100.0: 2.4 15.9 7.1 55.6 4.2 44.1 4.9 6.2 22.5 5.4 3.1: 10.5 4.7Other: 100.0: 0.0 0.0 0.0 0.0 0.0 0.0 0.0 0.0 0.0 0.0 0.0: 0.0 0.0 : : : : : Number of Traders in Each Category :All : 301: 8 16 16 31 24 92 28 36 80 30 28:Old : 301: 8 16 16 31 24 92 28 36 80 30 28:Other: 0: 0 0 0 0 0 0 0 0 0 0 0: :------------------------------------------------------------------------------------------------------------------------------------------------------- : Percent of Open Interest Held by the Indicated Number of the Largest Traders : By Gross Position By Net Position : 4 or Less Traders 8 or Less Traders 4 or Less Traders 8 or Less Traders : Long: Short Long Short: Long Short Long Short :----------------------------------------------------------------------------------------------------All : 21.4 43.0 31.6 59.4 21.0 41.1 29.5 55.6Old : 21.4 43.0 31.6 59.4 21.0 41.1 29.5 55.6Other: 0.0 0.0 0.0 0.0 0.0 0.0 0.0 0.0
bruceyam
Gold: Formed a Cup and Handle Pattern

Two distinct patterns have emerged in the gold market. First, a cup and handle pattern has been evolving since 2009, extending up to the present. Upon closer inspection of the handle portion, it becomes evident that it's shaping a broadening formation, specifically a right-angled and descending one. These combined patterns indicate significant upside potential for gold, presenting an exciting outlook for investors and traders.
bruceyam
Should we expect year end rally of Gold?

Should we expect year end rally of Gold? www.linkedin.com/fee...7123203443271307265/ Gold has been forming a cup and handle pattern since 2011, and there are indications that a significant upward rally in gold prices may be on the horizon.
bruceyam
SPX is starting a significant bear run
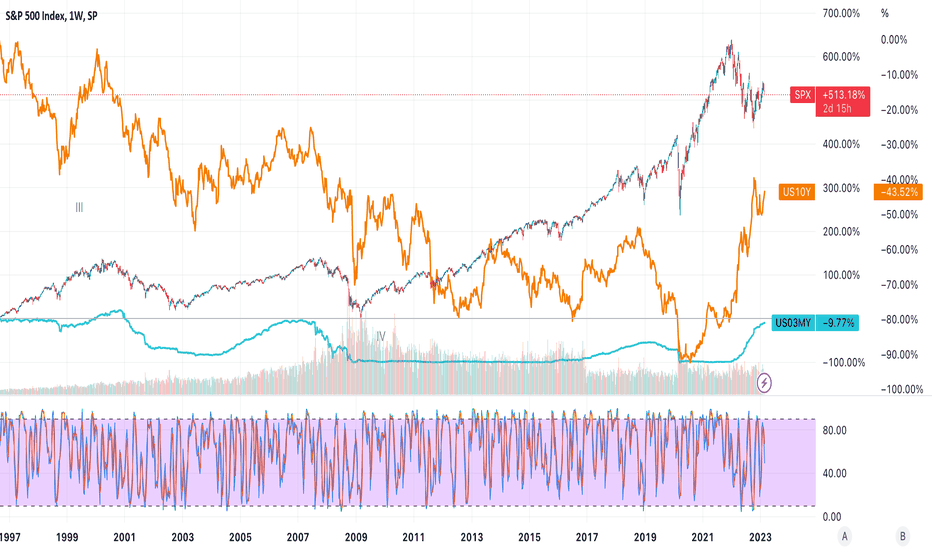
There are three lines in the chart, one is S&P500, one is the US 10-year treasury yield, and one is the 3-month treasury yield. In the past, the SPX usually lead the 3-month yield is falling. This means Fed will cut interest rates aggressively when the market turns into a downtrend. However, it's different this time. The S&P500 had a low in Oct 2022, and the Fed continued to rate hike afterward, which means the Oct low is not low enough to scare the Fed from a rate hike. In the chart, not until something breaks the Fed would not start a rate cut. We will challenge the Oct low and even lower until the Fed changes its mind. Expecting more rate hikes, lower S&P500.
Disclaimer
Any content and materials included in Sahmeto's website and official communication channels are a compilation of personal opinions and analyses and are not binding. They do not constitute any recommendation for buying, selling, entering or exiting the stock market and cryptocurrency market. Also, all news and analyses included in the website and channels are merely republished information from official and unofficial domestic and foreign sources, and it is obvious that users of the said content are responsible for following up and ensuring the authenticity and accuracy of the materials. Therefore, while disclaiming responsibility, it is declared that the responsibility for any decision-making, action, and potential profit and loss in the capital market and cryptocurrency market lies with the trader.