
blbenne0
@t_blbenne0

What symbols does the trader recommend buying?
Purchase History
پیام های تریدر
Filter
blbenne0
پیشبینی شوکهکننده قیمت: شکست کانال در سال ۲۰۲۶ و جهش بزرگ به بالای ۱۳۰ هزار دلار!
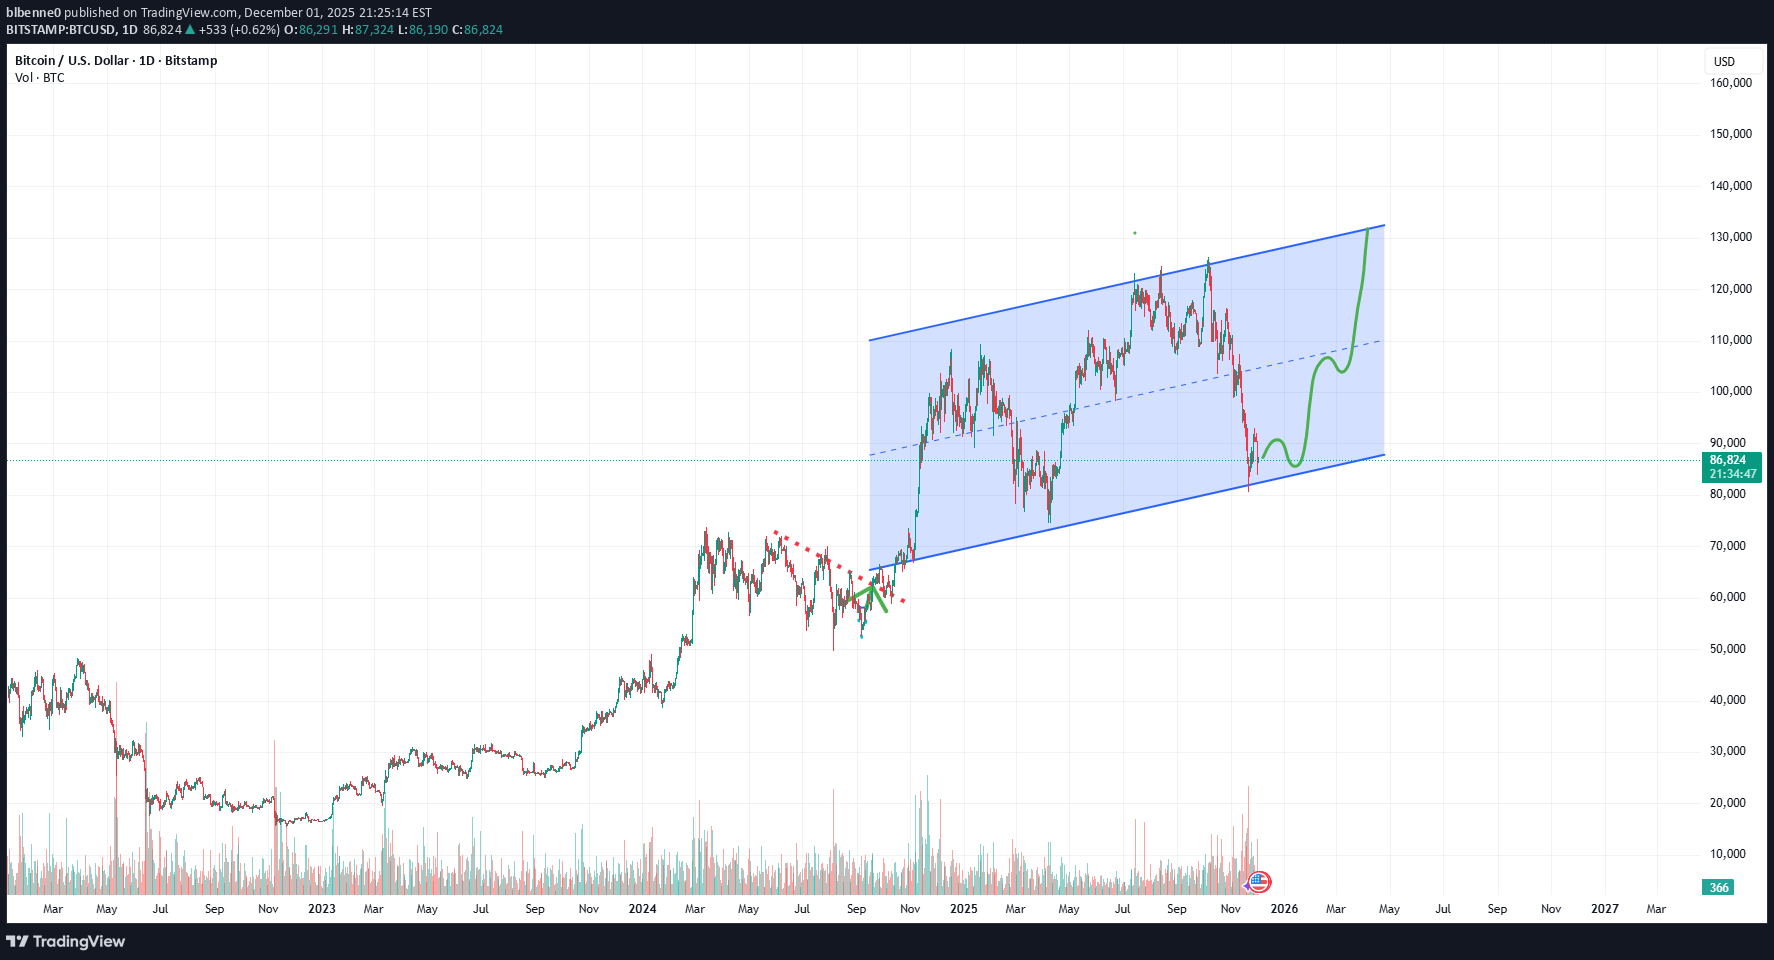
I'm expecting a break past $130,000 and possibly a breakout of the channel sometime in early 2026. Right now, probably chop through December. 2026 will be the year. Trust me, bro. *Not financial advice, do your own research.*Based on this, we could still hit around 83,000 and still be in range.
blbenne0
Bullish Divergence on the daily
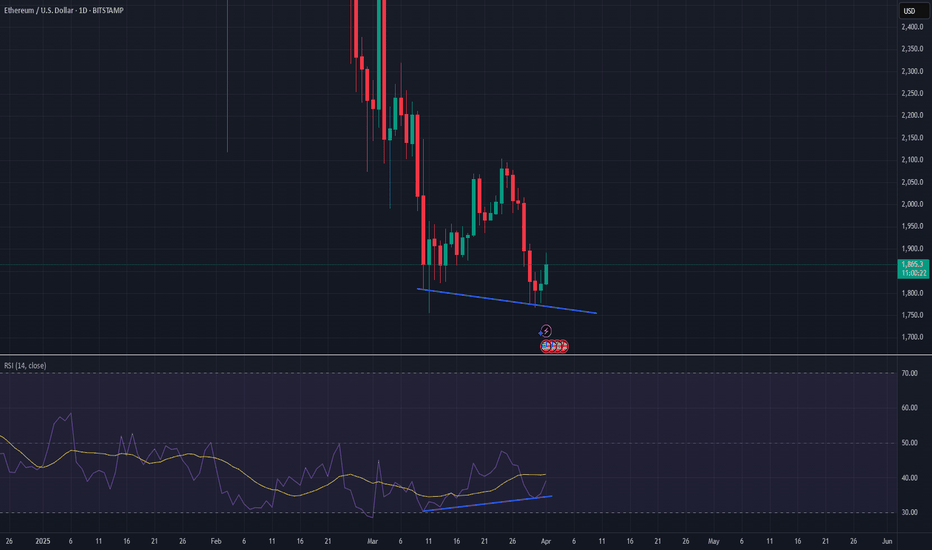
I would also say that there is a bullish divergence happening on the daily, which further indicates likelihood of upward momentum.
blbenne0
Resistance line from 2020
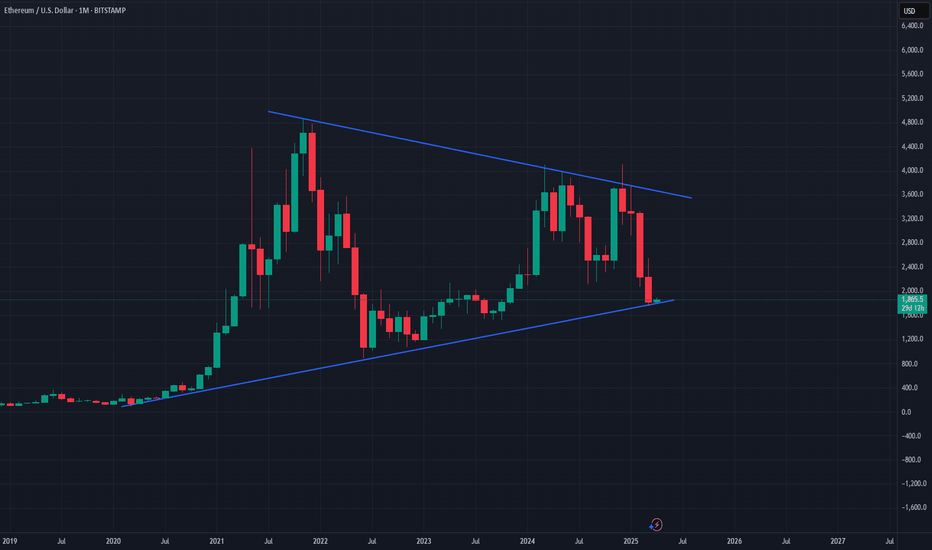
As you can see from this simple monthly chart, we are in a symmetrical wedge and at the resistance line dating back to early 2020. I would say it's far more likely we trend up from here on the macro.
blbenne0
Yes, it's this simple.
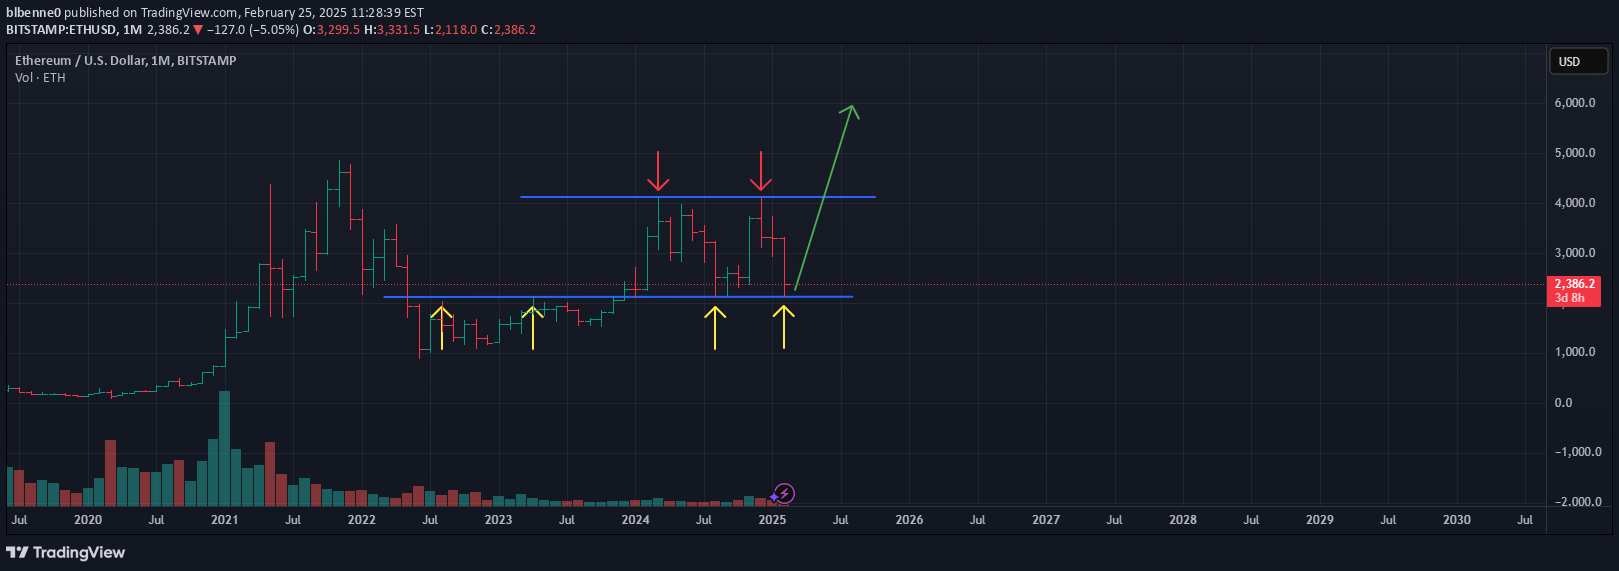
This is the monthly trend for eth, with supports and resistances exactly parallel.
blbenne0
Inverted daily H & S
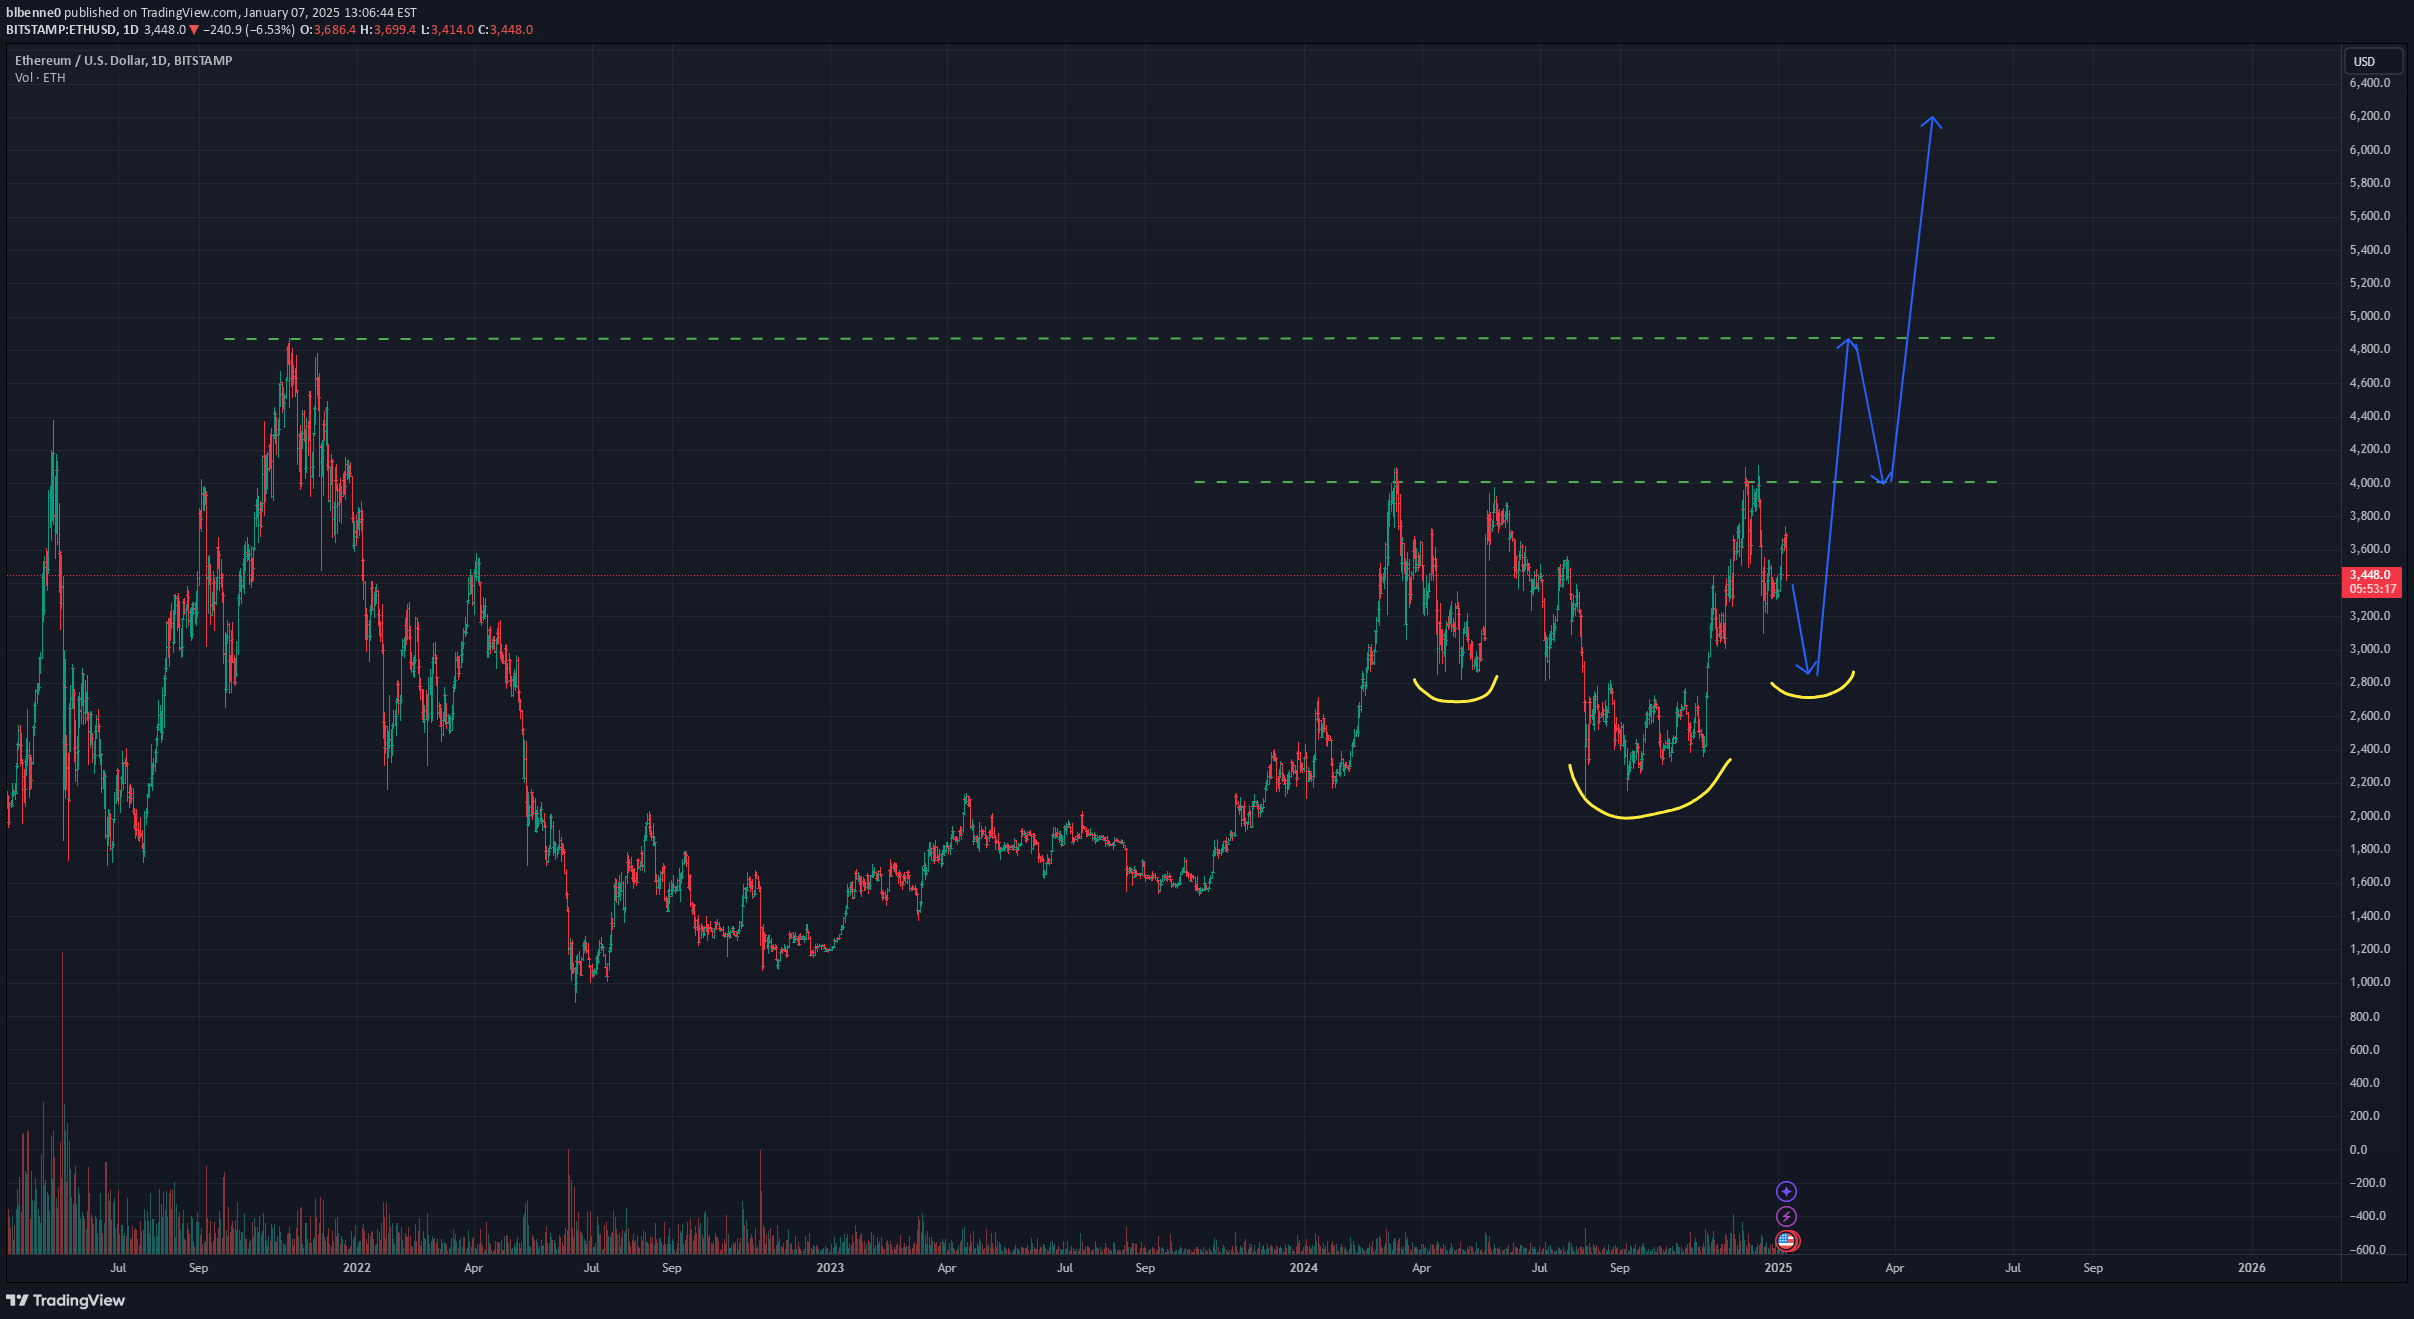
What I'm seeing on the daily is either a cup and handle or an inverted head and shoulders pattern on the daily. The Cup & Handle would obviously create more bullish pressure sooner than later. A break down would likely confirm an inverted head and shoulders, finding support at around $2,850, corresponding with a break above the 4K resistance and back to all time highs. NFA, DYORMeant $4,000 resistance*Target was ridiculously close to my price target of $2850, with a low closed near $2925. Would not be surprised to see another bounce off that area, but looks like a good V-shape recovery and the risk/reward at this level is outstanding. I anticipate the next target to be around $4800, then off to price discovery. NFA, DYOR, LFG!!
blbenne0
Huge Inverse H&S Pattern
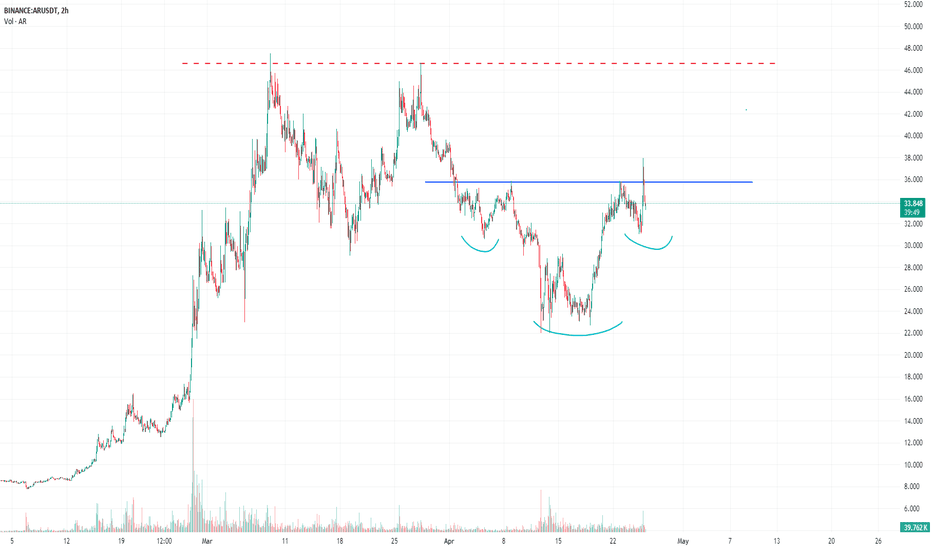
Inverse head and shoulders pattern over the entirety of April. Resistance line has been broken with a sign of strength. Target is previous local highs at $46.5, where I expect possible range-bound action before another eventual breakout. ***Not financial advice, DYOR.***
blbenne0
Nice run, now time for a bit of a cool off before the next run.
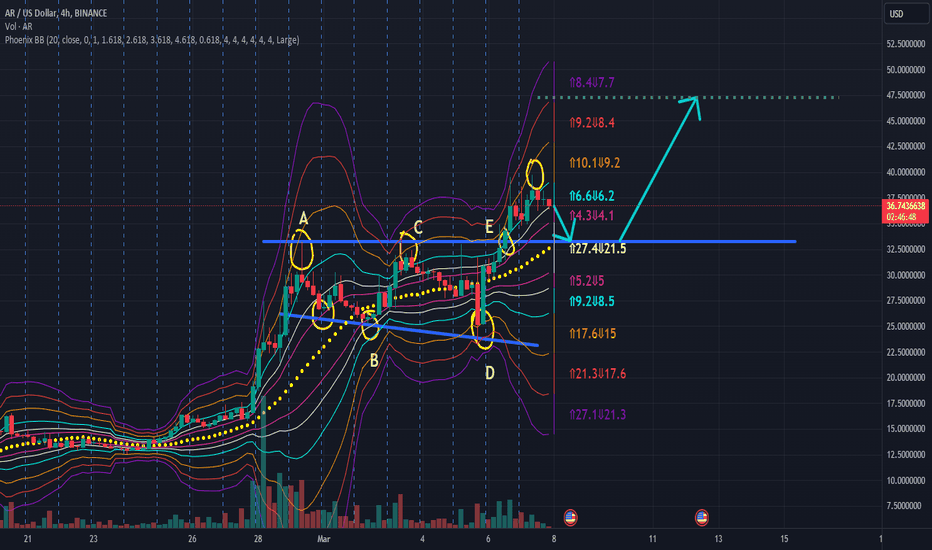
We see a bullish megaphone happening on the 4h chart with a breakout out of the ABCDE correction. Bollinger bands are stretched, so this means a cool-down of price movement is likely until the bands constrict. Usually, the price falls to around the mid-point (the dotted yellow lines) of the b-bands. The yellow line also coincidentally also lines up with the breakout zone and new support. A re-test of the breakout zone usually happens before another leg up. I am predicting a pull back to around the $33 zone, with some sideways action along the support before the next move to around the red upper b-band around $47 for a potential 30% profit from $33. Disclaimer: I am not a financial advisor, this is not financial advice and merely my own idea. Always do your own research.The unlikely scenario happened and the upward pressure still appears hot. Price action still bounced almost exactly on my target. I would expect consolidation for the median yellow line to catch up before the next leg up.
blbenne0
Huge move about to happen
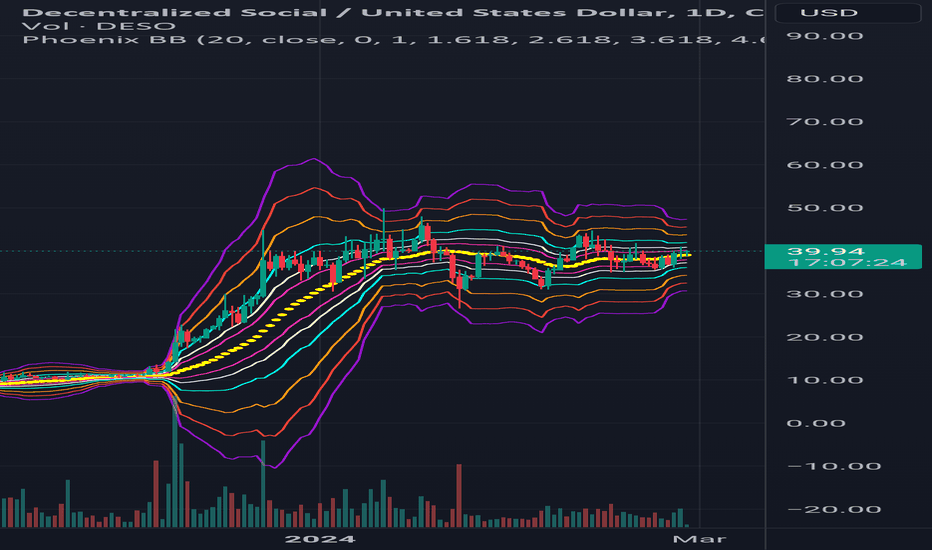
Constricting Bollinger bands usually mean a big move is imminent. On the daily, we see constricted Bollinger bands whenever a big move happens. Given current market conditions, an upside move is likely, otherwise we would continue seeing chop. Not financial advice, dyor.
blbenne0
Price breakout, bull momentum incoming
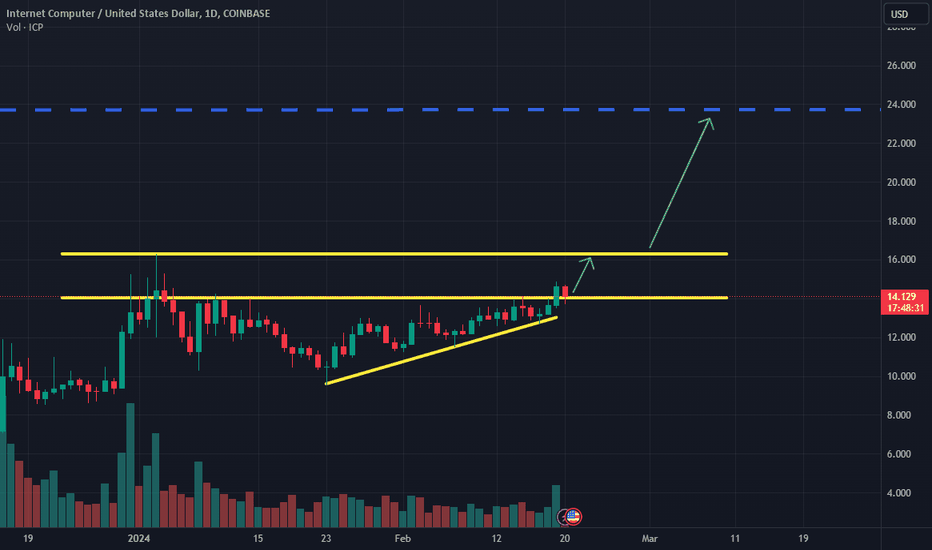
Breakout and retest of ascending triangle happening with a sign of strength at the breakout. Retest happening. Would not be surprised to see price hit the local high a few times before smashing to the resistance @23.60 as target one. Disclaimer: Not financial advice, dyor.
blbenne0
Bullish Megaphone
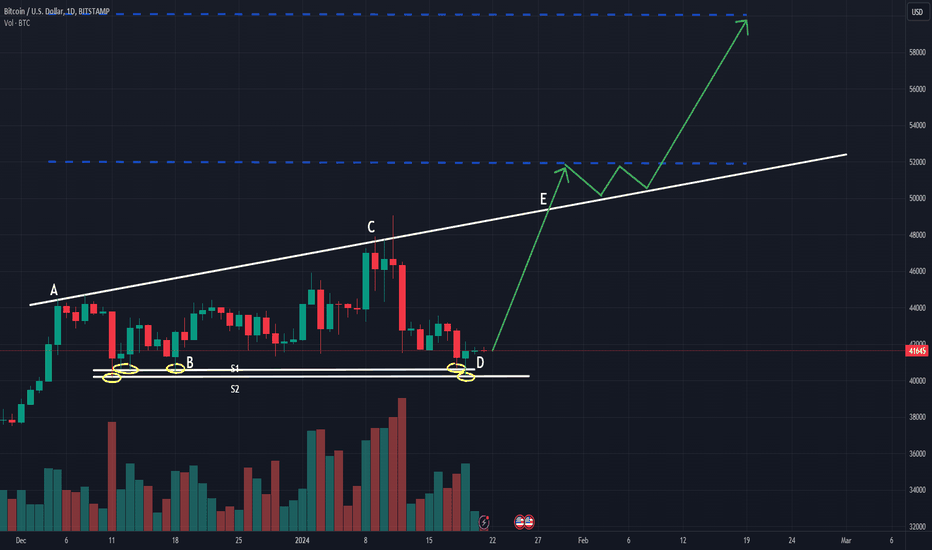
Price action has bounced off S1 four times, while bouncing off S2 two times. We can see S1 and S2 are the supports in this picture. Highs have been increasing, while supports are horizontal. This indicates a bullish megaphone. My prediction is a breakout of the pattern in step E to resistance at 52k and bouncing off the top of the megaphone until we hit 60k. A break below this pattern would lead to support @ 38k, where the only support below 38k is 32k. Not financial advice, trade at your own risk.
Disclaimer
Any content and materials included in Sahmeto's website and official communication channels are a compilation of personal opinions and analyses and are not binding. They do not constitute any recommendation for buying, selling, entering or exiting the stock market and cryptocurrency market. Also, all news and analyses included in the website and channels are merely republished information from official and unofficial domestic and foreign sources, and it is obvious that users of the said content are responsible for following up and ensuring the authenticity and accuracy of the materials. Therefore, while disclaiming responsibility, it is declared that the responsibility for any decision-making, action, and potential profit and loss in the capital market and cryptocurrency market lies with the trader.