
bidarmaj
@t_bidarmaj

What symbols does the trader recommend buying?
Purchase History
پیام های تریدر
Filter
bidarmaj
"Smart Money Price Action Strategy – Liquidity & Order Block Ana

🚀 SmartView – Institutional Trading Strategy 🚀 In this analysis, we apply SmartView, a professional tool designed for Smart Money Concept (SMC) traders, liquidity-based setups, and price action strategies. This approach focuses on identifying institutional footprints, tracking liquidity grabs, and capitalizing on high-probability trade setups. 🔹 Key Market Observations: 1️⃣ Liquidity Sweeps: Price is engineered to hunt liquidity before making the real move. A liquidity grab at key premium/distribution zones signals a potential reversal. 2️⃣ Order Blocks (OB): Institutional traders accumulate positions in key demand/supply zones before large moves. We look for confirmed OBs with CHoCH & BOS. 3️⃣ Change of Character (CHoCH) & Break of Structure (BOS): CHoCH confirms an early shift in momentum. BOS validates trend continuation or reversal. 4️⃣ Premium vs. Discount Zones: Ideal long entries occur at discount levels below equilibrium. Short setups are optimal in premium zones above equilibrium. 5️⃣ SmartView Confirmation: Buy/Sell pressure is visualized using SmartView’s custom candle colors, allowing for an enhanced order flow understanding. 🎯 Trade Setup: ✅ Entry: After a liquidity sweep, look for price to return to an order block in the discount zone with CHoCH confirmation. ✅ Stop Loss: Below the recent swing low to protect against further liquidity grabs. ✅ Target: TP1: First significant resistance (for partial profit-taking). TP2: Previous market structure high (for extended move).
bidarmaj
bidarmaj
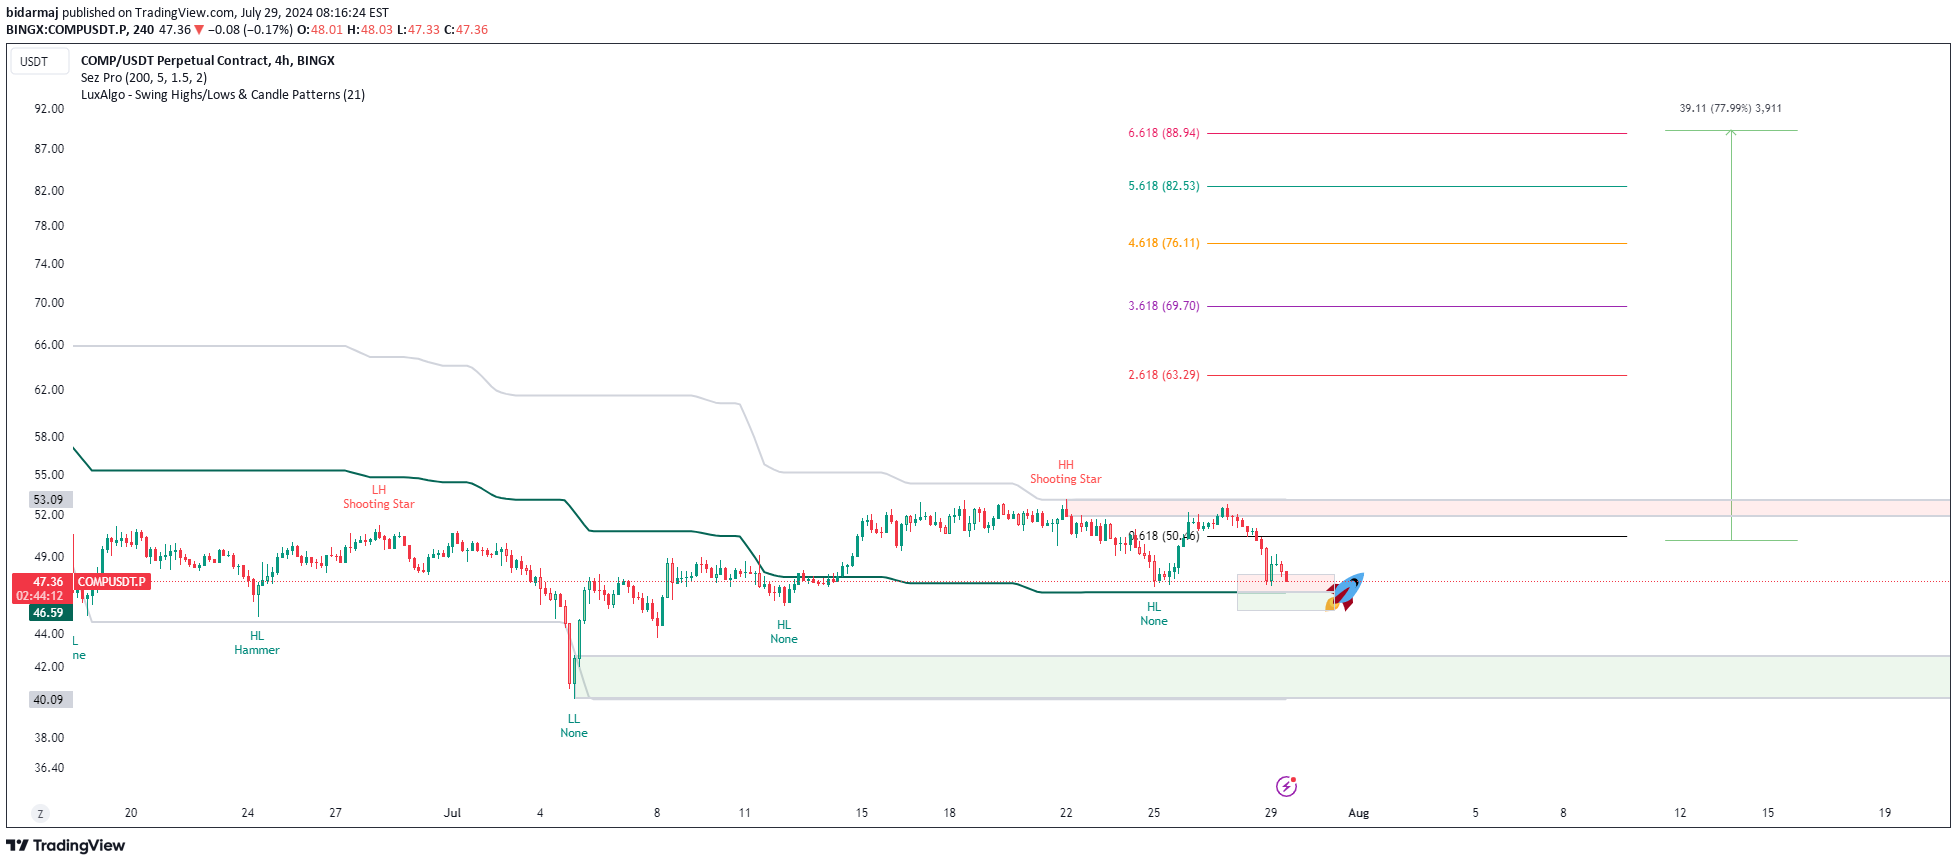
# Introducing the "Sez Pro" Indicator for ICT Traders

The "Sez Pro" indicator is an advanced and professional tool in technical analysis that utilizes trading volume and price bands to identify safe entry and exit zones in financial markets. This indicator is specifically designed for ICT (Inner Circle Trader) traders and those seeking a deeper understanding of market trends. Here, we explain the various components of this indicator: ## User Input Parameters - **Length:** (`manualLength`) The period length used to calculate the highest and lowest prices. The default value is 200, which the user can adjust. - **Smooth Length:** (`smoothLength`) The period length used to smooth the highest and lowest prices using a simple moving average (SMA). The default value is 5. - **Volume Threshold Multiplier:** (`volumeThreshold`) The multiplier used to determine buying and selling pressure. The default value is 1.5, with a minimum adjustable value of 0.1. - **Color:** (`colorSetting`) The color chosen by the user for displaying the price bands. ## Order Block Detection Parameters - **Order Block Color:** (`orderBlockColor`) The color of the order blocks used to identify critical points. - **Order Block Border Color:** (`orderBlockBorderColor`) The border color of the order block, taken from the user settings. - **Order Block Border Width:** (`orderBlockBorderWidth`) The width of the order block border, adjustable between 1 and 5. ## Key Calculations - **Highest and Lowest Prices:** Calculation of the highest price (`highestHigh`) and lowest price (`lowestLow`) over the specified period. - **Smoothing the Bands:** Smoothing the highest and lowest prices using a simple moving average (SMA) and creating smooth bands (`smoothHigh` and `smoothLow`). - **Midline:** Calculating the midline as the average of the smoothed bands. - **Average True Range (ATR):** Calculating ATR to determine the upper and lower bands based on the midline. - **Buying and Selling Pressure Detection:** Identifying candles with buying (`buyingPressure`) and selling (`sellingPressure`) pressure using trading volume and the specified volume multiplier. ## Order Block Detection and Safe Entry Zones - **Order Block Detection:** Identifying and drawing high (`highBox`) and low (`lowBox`) order blocks based on the highest and lowest prices in the specified period. - **Safe Entry Zones:** Identifying safe entry zones based on the crossover of the closing price above the midline and the lower price being above the midline. The "Sez Pro" indicator provides a comprehensive analysis of price behavior and trading volume, helping professional traders, especially ICT traders, to identify critical market points and make more accurate trading decisions. This tool allows traders to understand market trends more precisely and improve their trading efficiency.
Disclaimer
Any content and materials included in Sahmeto's website and official communication channels are a compilation of personal opinions and analyses and are not binding. They do not constitute any recommendation for buying, selling, entering or exiting the stock market and cryptocurrency market. Also, all news and analyses included in the website and channels are merely republished information from official and unofficial domestic and foreign sources, and it is obvious that users of the said content are responsible for following up and ensuring the authenticity and accuracy of the materials. Therefore, while disclaiming responsibility, it is declared that the responsibility for any decision-making, action, and potential profit and loss in the capital market and cryptocurrency market lies with the trader.