
axxxis666
@t_axxxis666

What symbols does the trader recommend buying?
Purchase History
پیام های تریدر
Filter
axxxis666
بیت کوین در آستانه ریزش؟ پایان روز چه سرنوشتی را رقم میزند؟
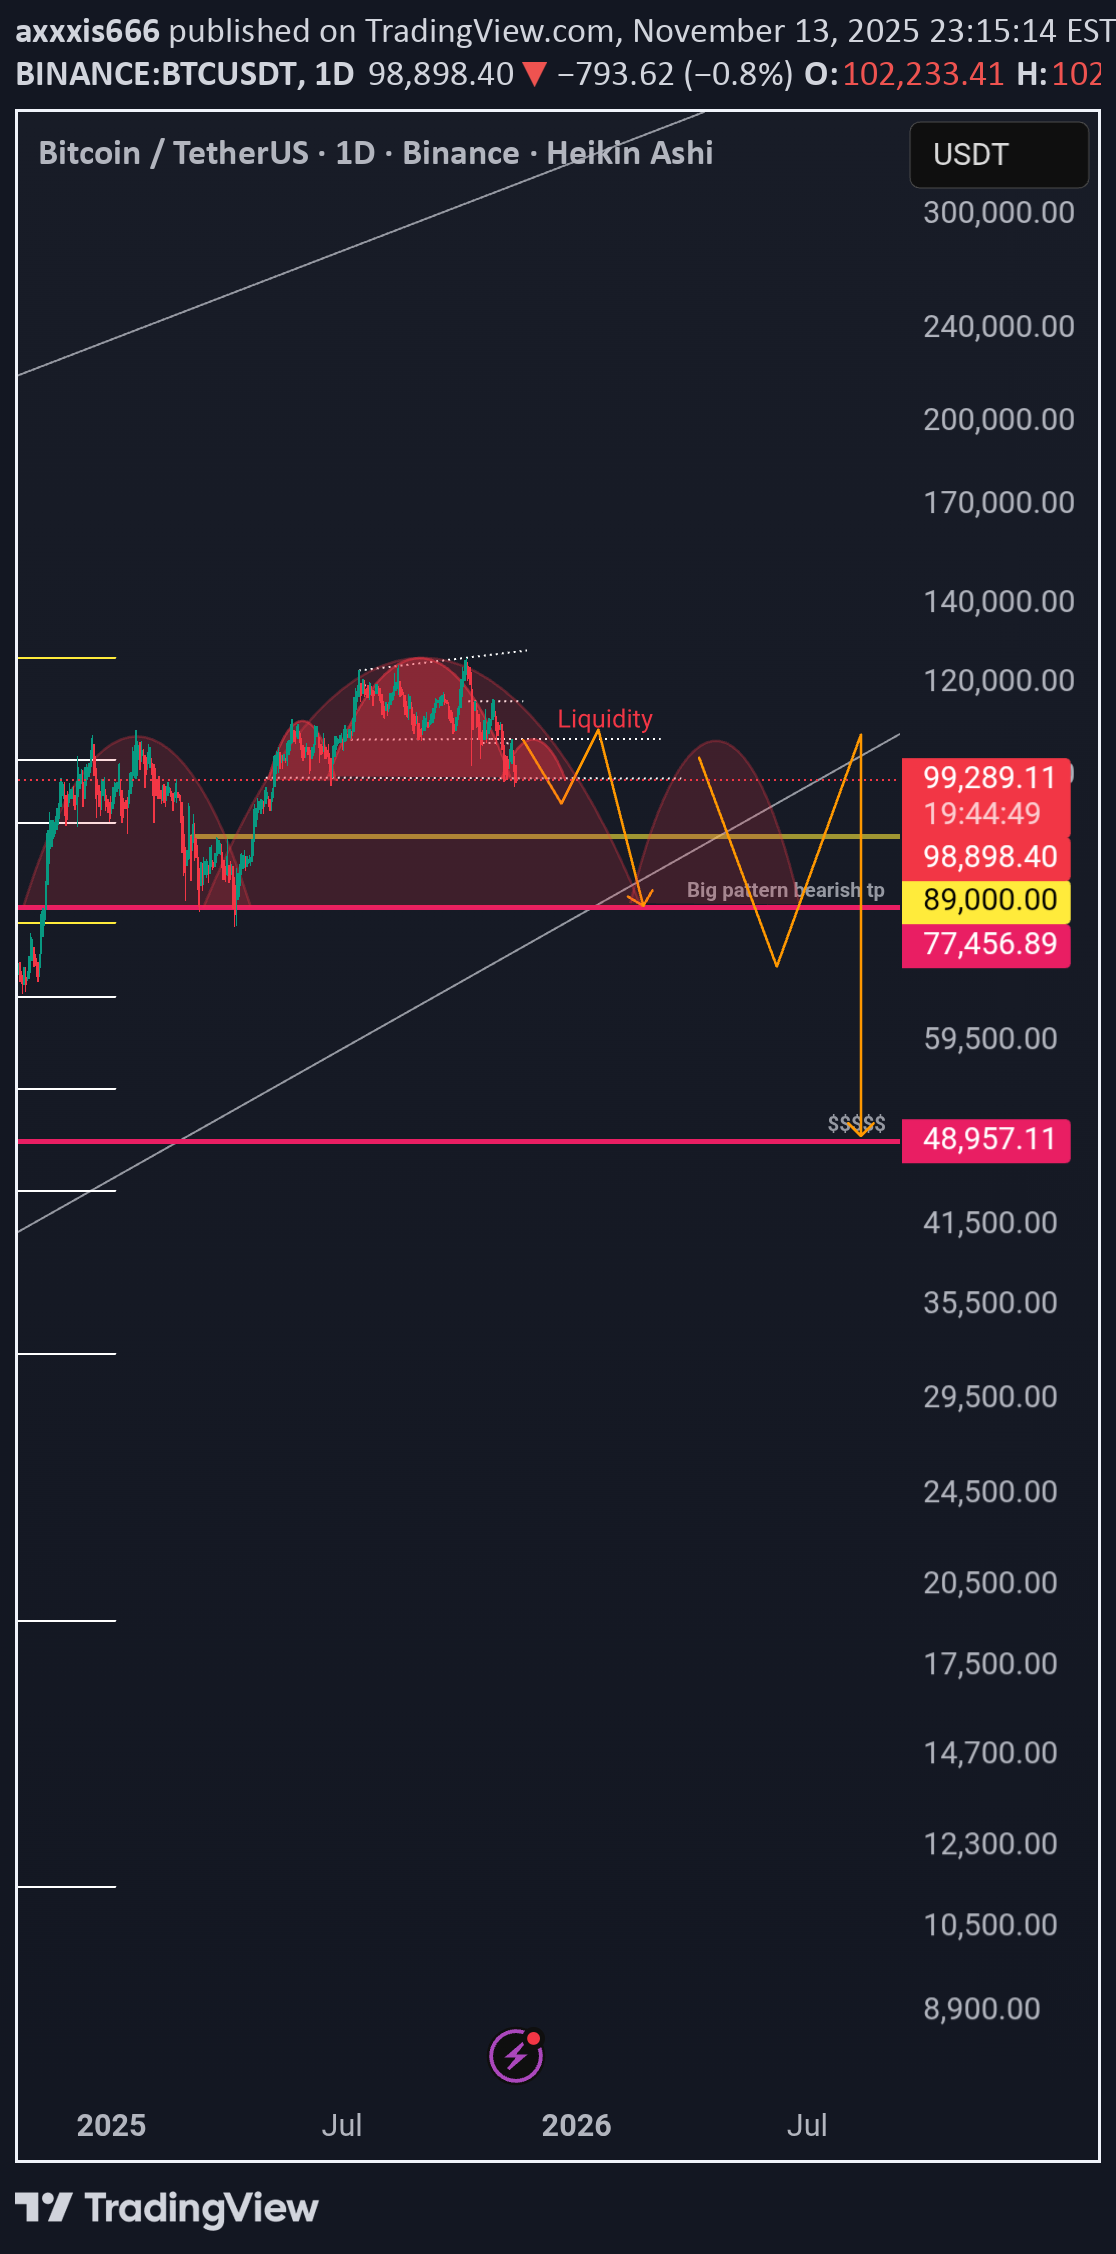
A bearish H&S pattern confirmation will form after this day closes. The probable target is to hit the top of the right shoulder first before dropping to the 77k area. Just my insight—I can't stop seeing this pattern. They are probably targeting a drop in the market to buy at a lower price before the higher-ups change—a year or half a year before new leaders take over.
axxxis666
Trumpusdt Bearish h&s pattern in daily time frame
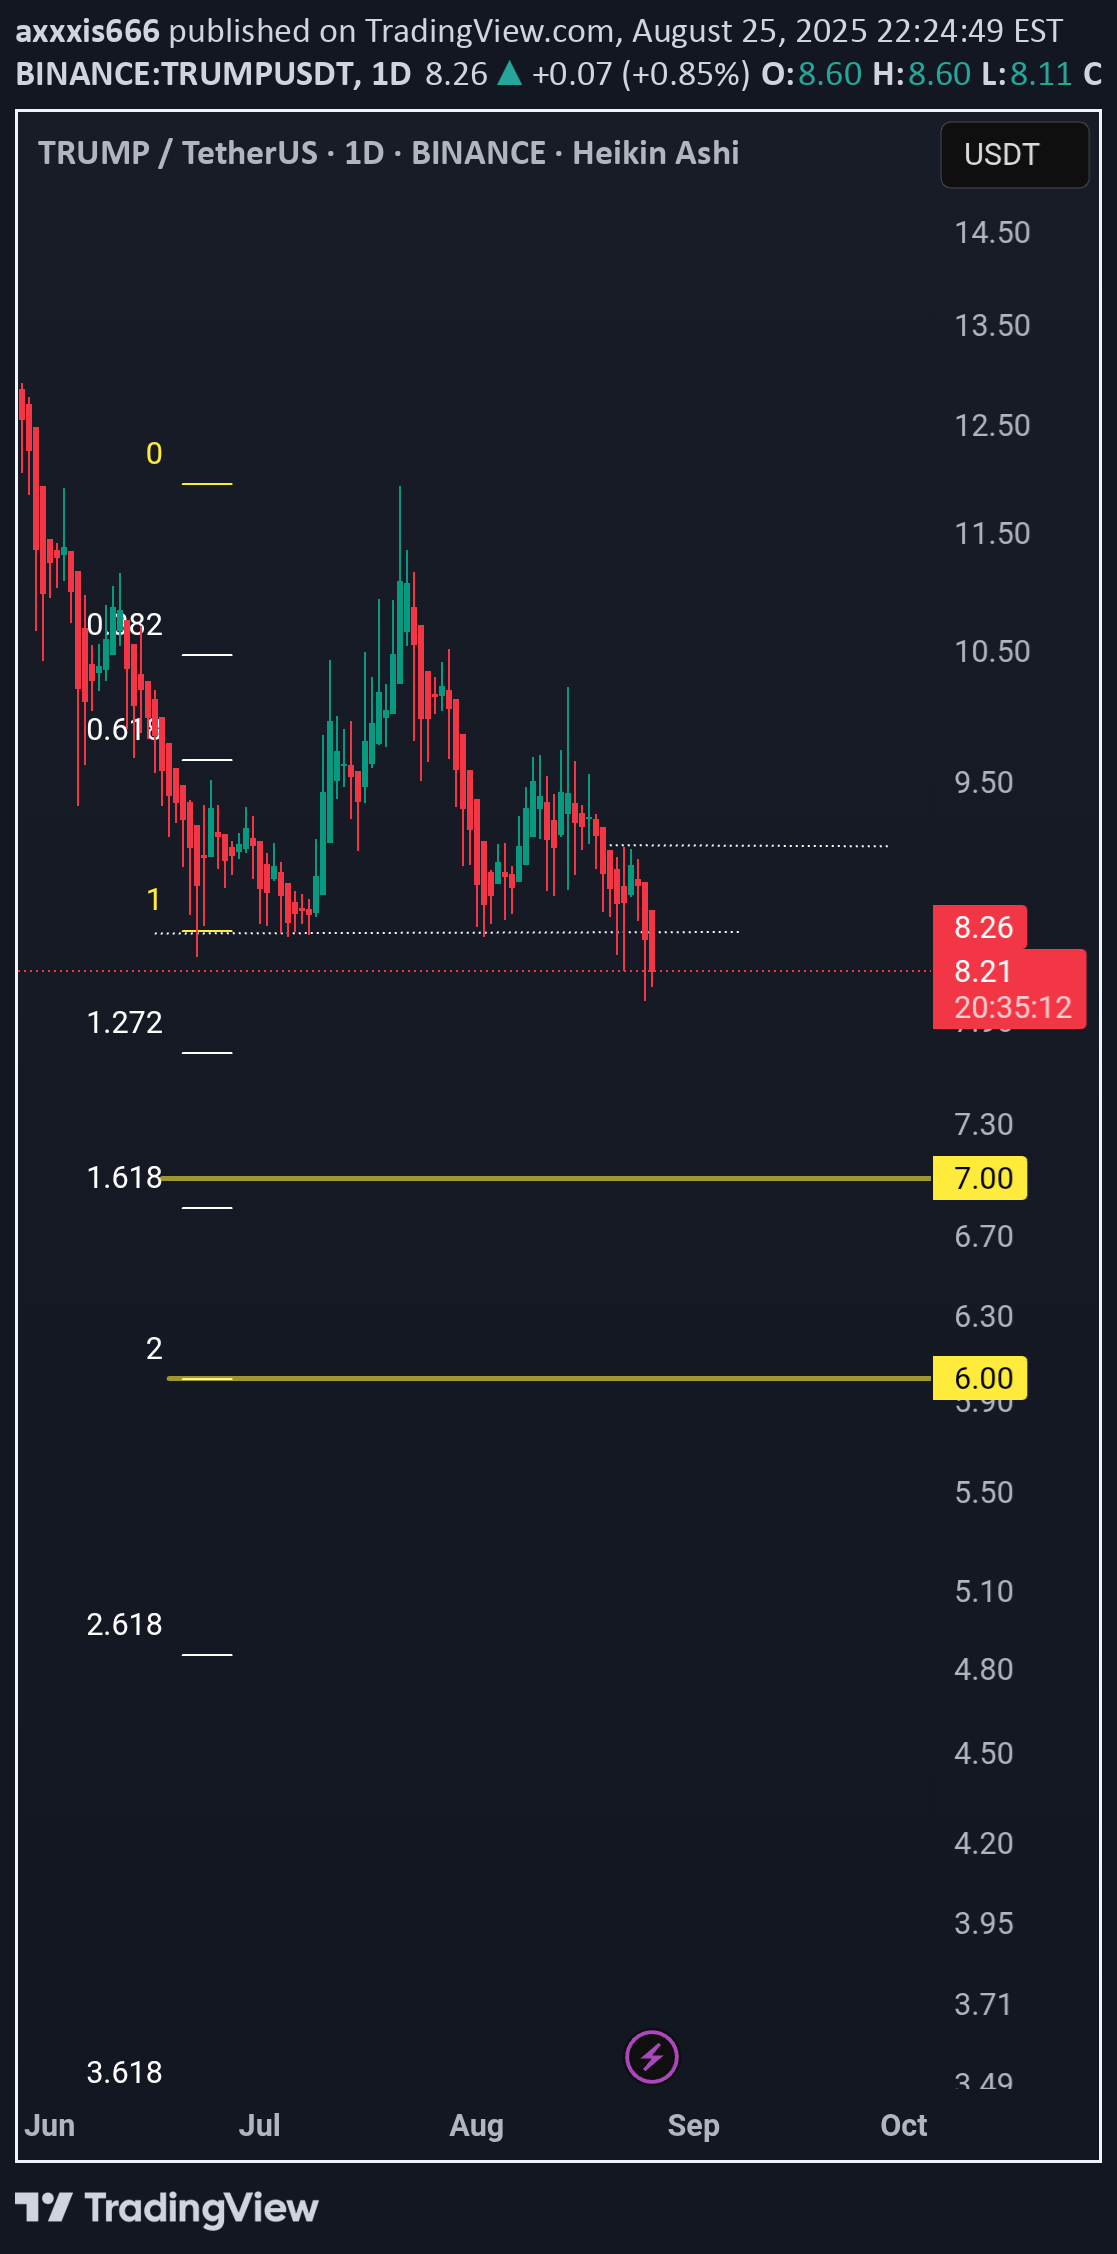
A bearish H&S pattern has formed in the daily time frame. Targets are 7 and 6. Invalidation if it closes above 9.1 in daily time frame.Stop reached.
axxxis666
Btc 4hr time frame forward test
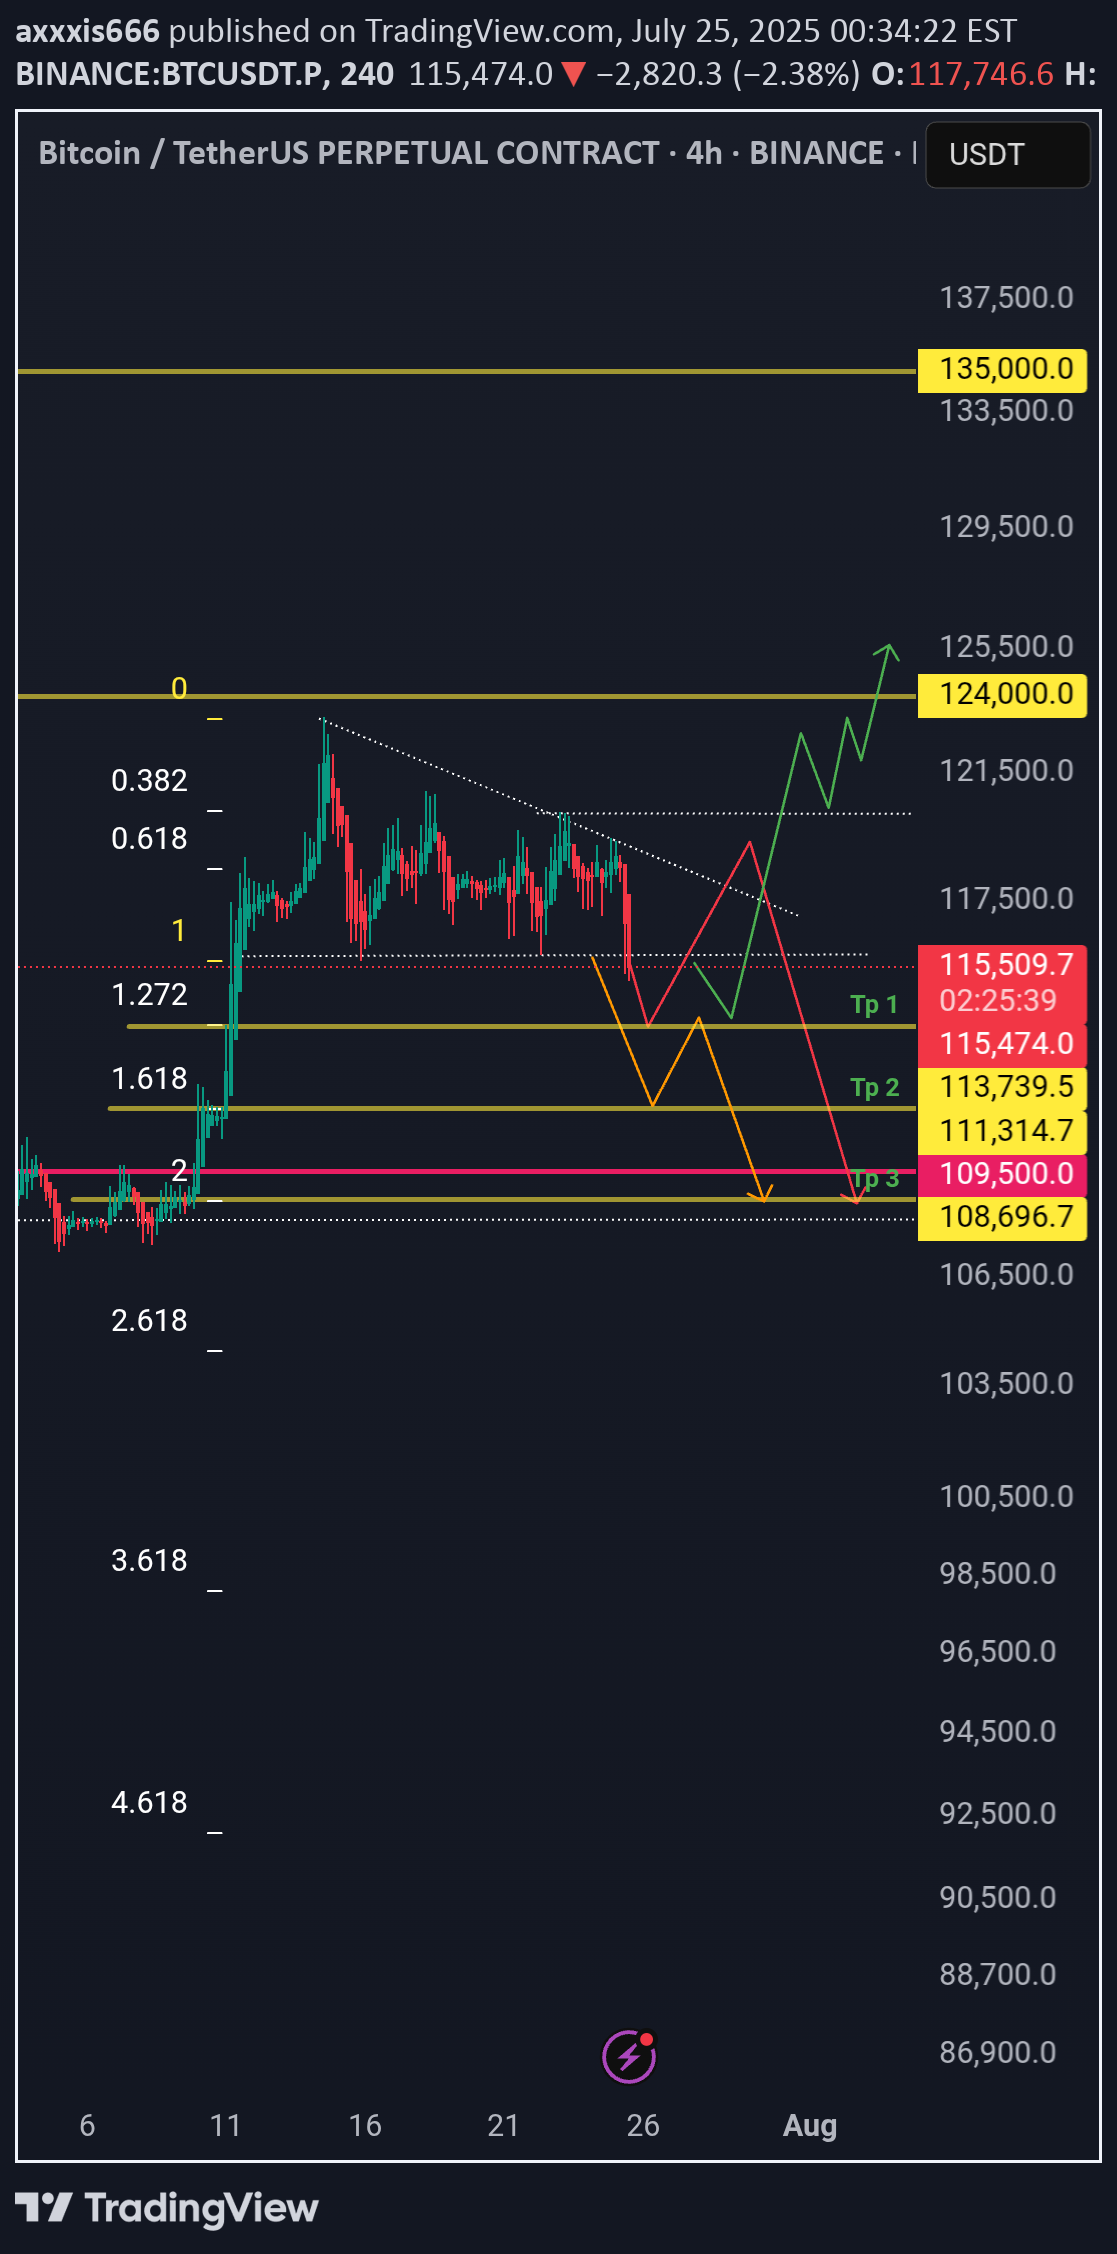
3 possible scenarios, Scenario 1 (Red): If it bounces at 1.272 and fails to break the previous high, a more bearish move is possible. Scenario 2 (Green): This scenario involves a bounce at 1.272 and consolidation above the previous high. Scenario 3 (Orange): This is a continuation of the bearish breakdown. General Notes: All bounce points (indicated by the "yellow line") show a gap-up move (SMC entry area). TP3 is a good entry area, considering all confluences.
axxxis666
xrpusdt 1hr time frame bullish iH&S pattern
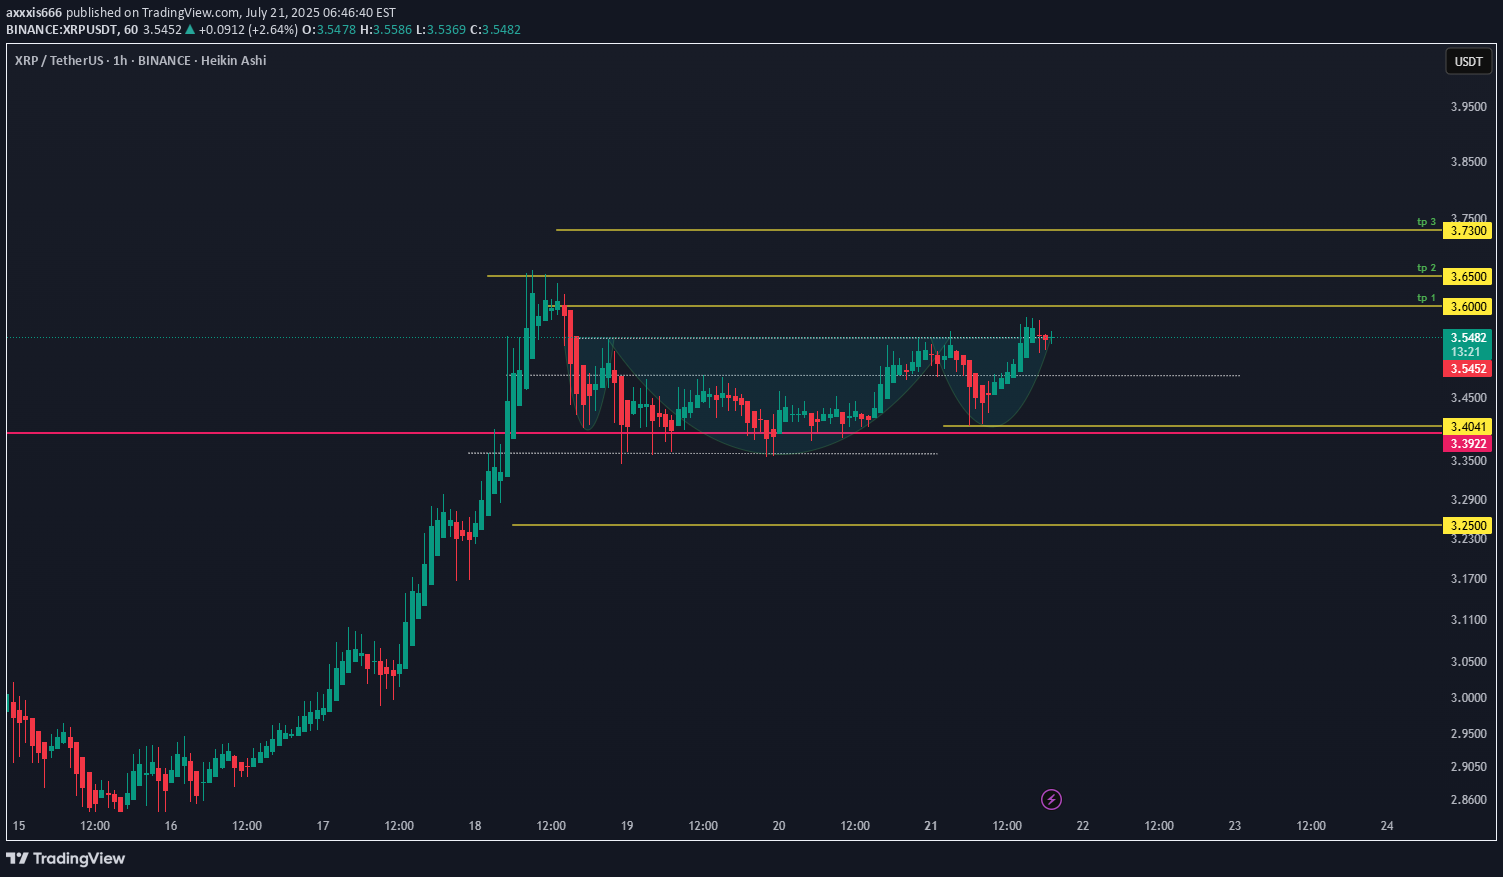
activated bullish patter on top of prev. ATh level. targets are 3.60, 3.65 and 3.73 invalidation: a close below 3.40Tp 1 reached. Move stop to breakeven,or to 3.499/prev swingTp 2 reached then drop to tp 1 area. Trade now closed.
axxxis666
Trump 4hr time frame bullish cup and handle
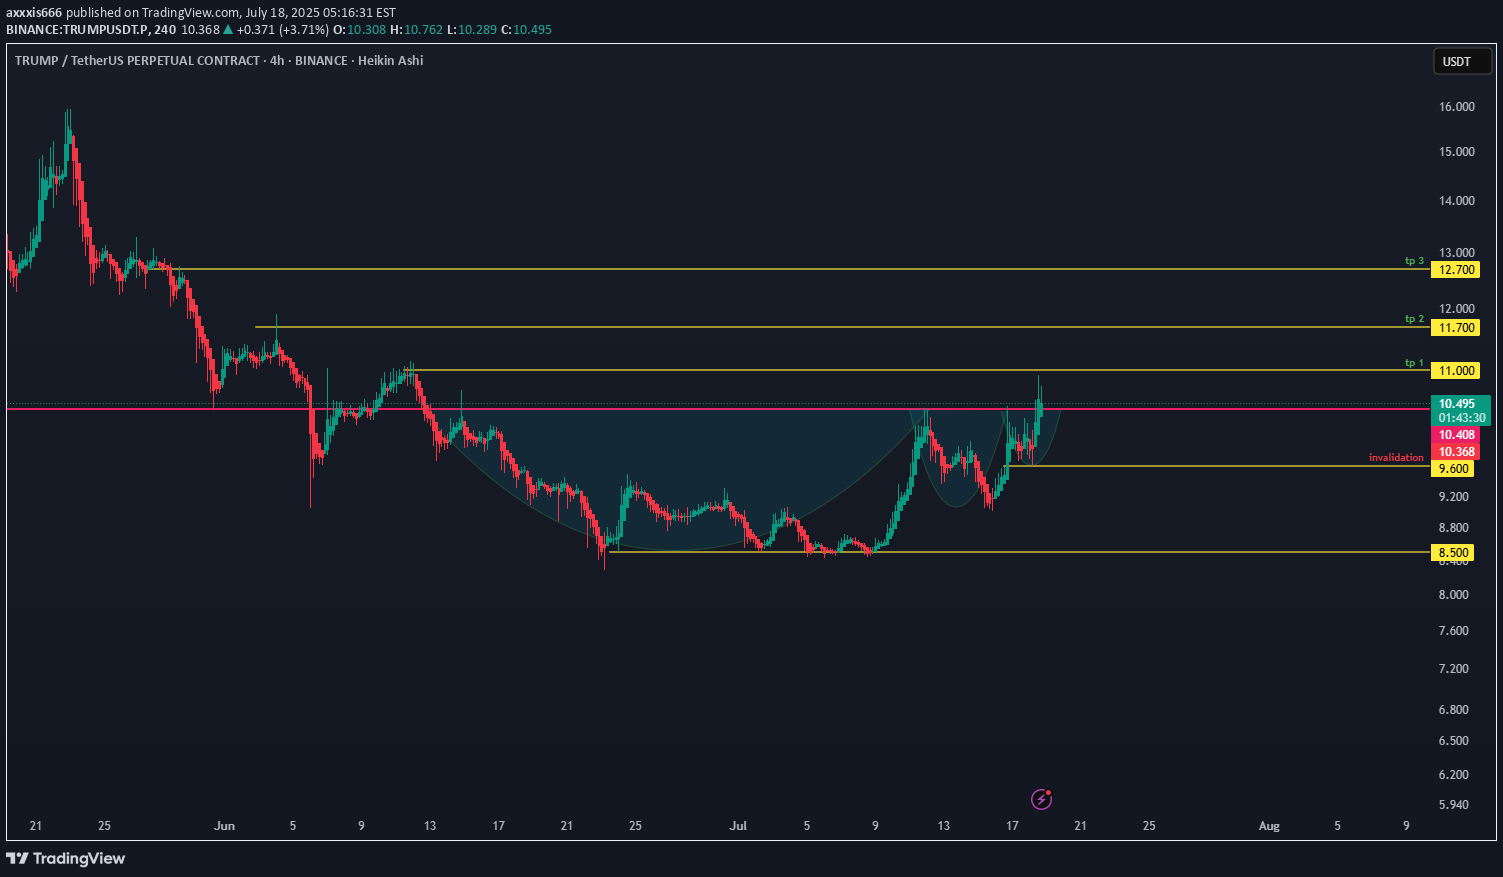
activated cup and handle pattern with targets: 11, 11.7 and 12.7 invalidation: a close below 9.6
axxxis666
Dogeusdt bullish iH&S/cup&handle pattern in daily tf
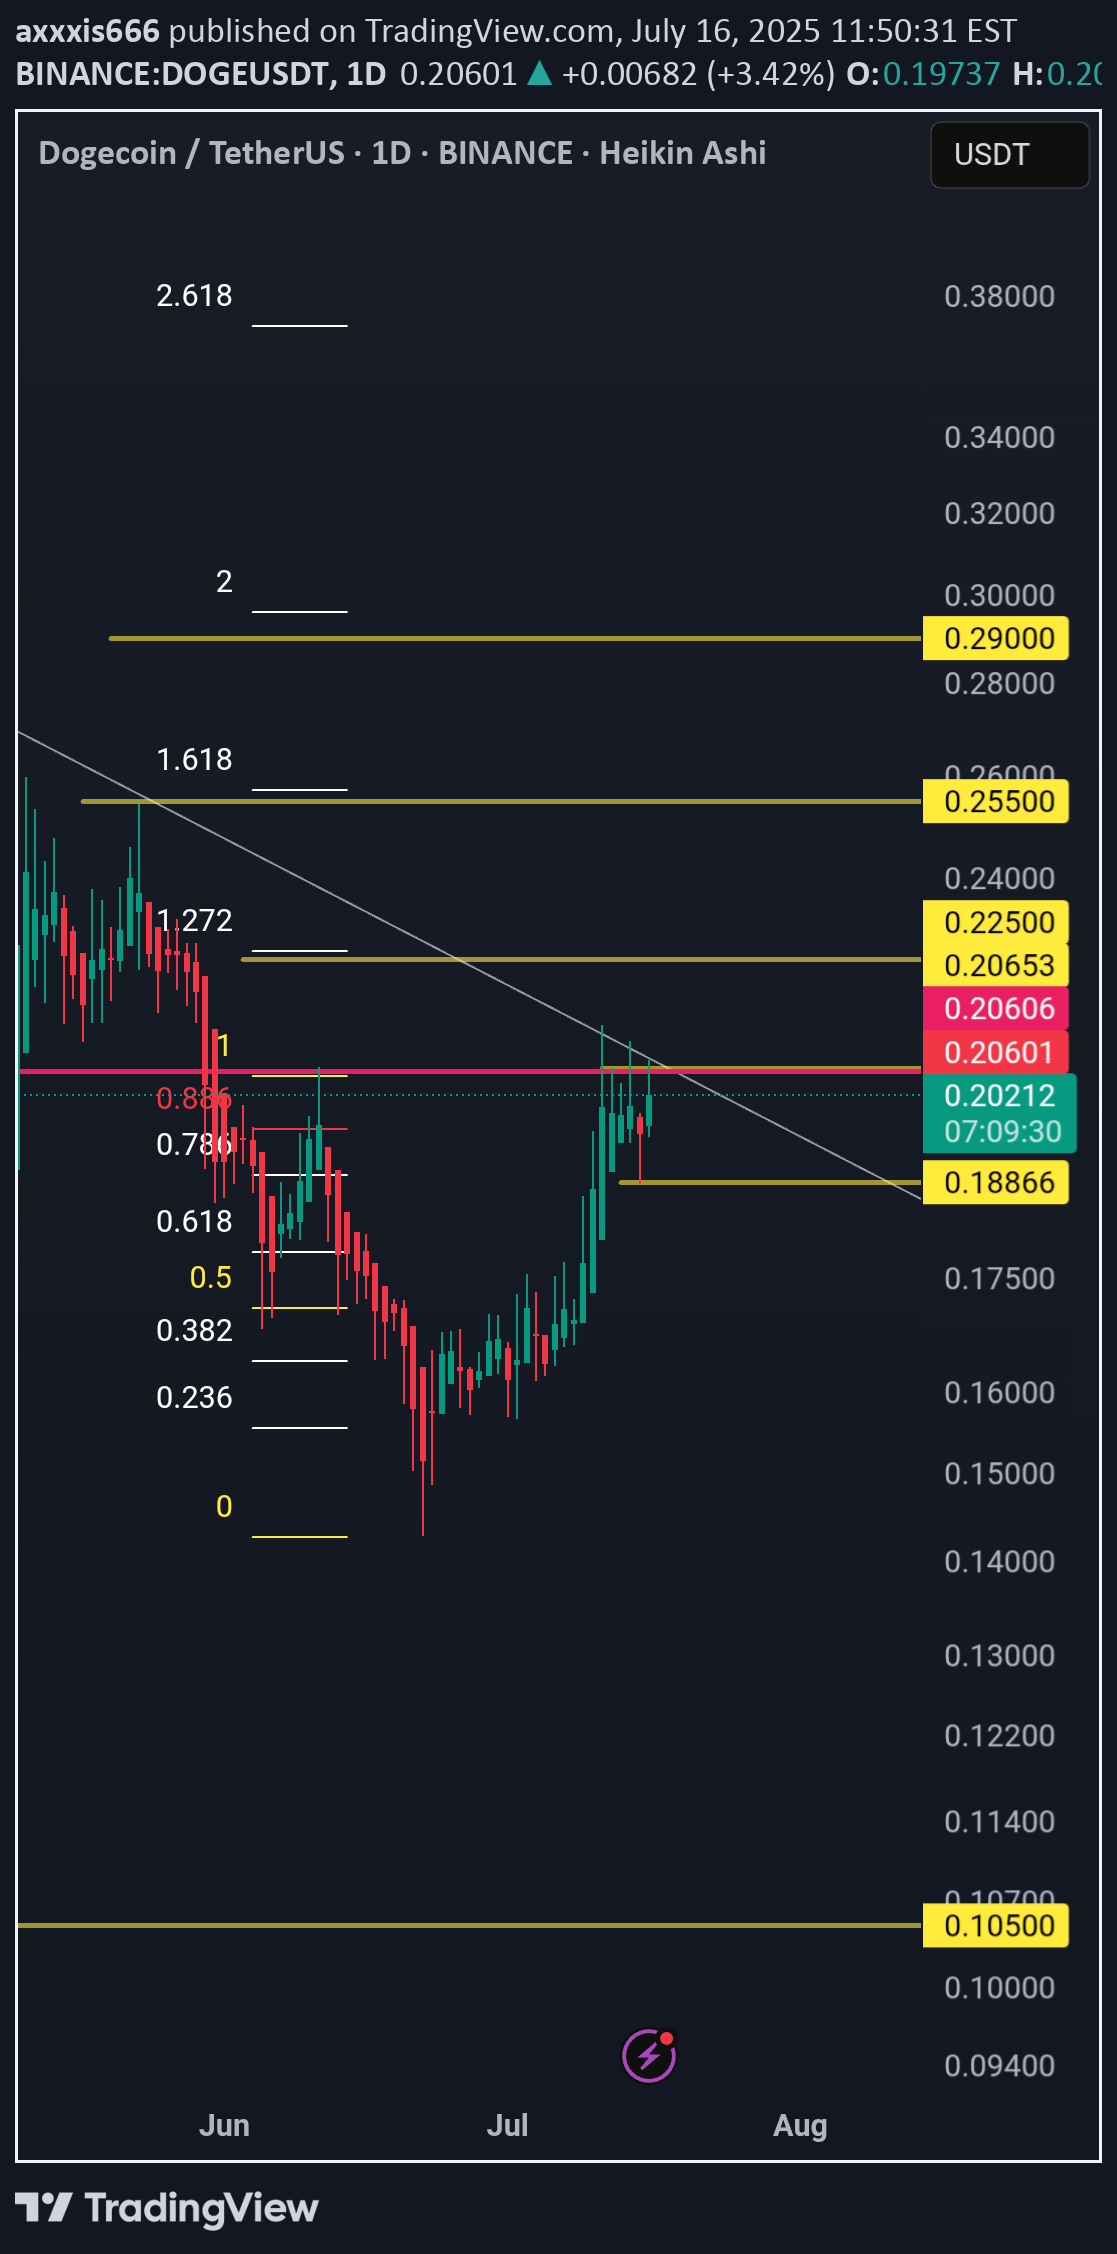
Forming a bullish pattern and a close above 0.206 in daily time frame may activate the pattern. Targets are 0.225, 0.255 and 0.29 Invalidation below 0.1886ActivatedTp 1 reachedTp 2 reachedPlease take some partial profit now and move stop to 0.24862Stop at 0.2481
axxxis666
Solusdt bullish daily time frame
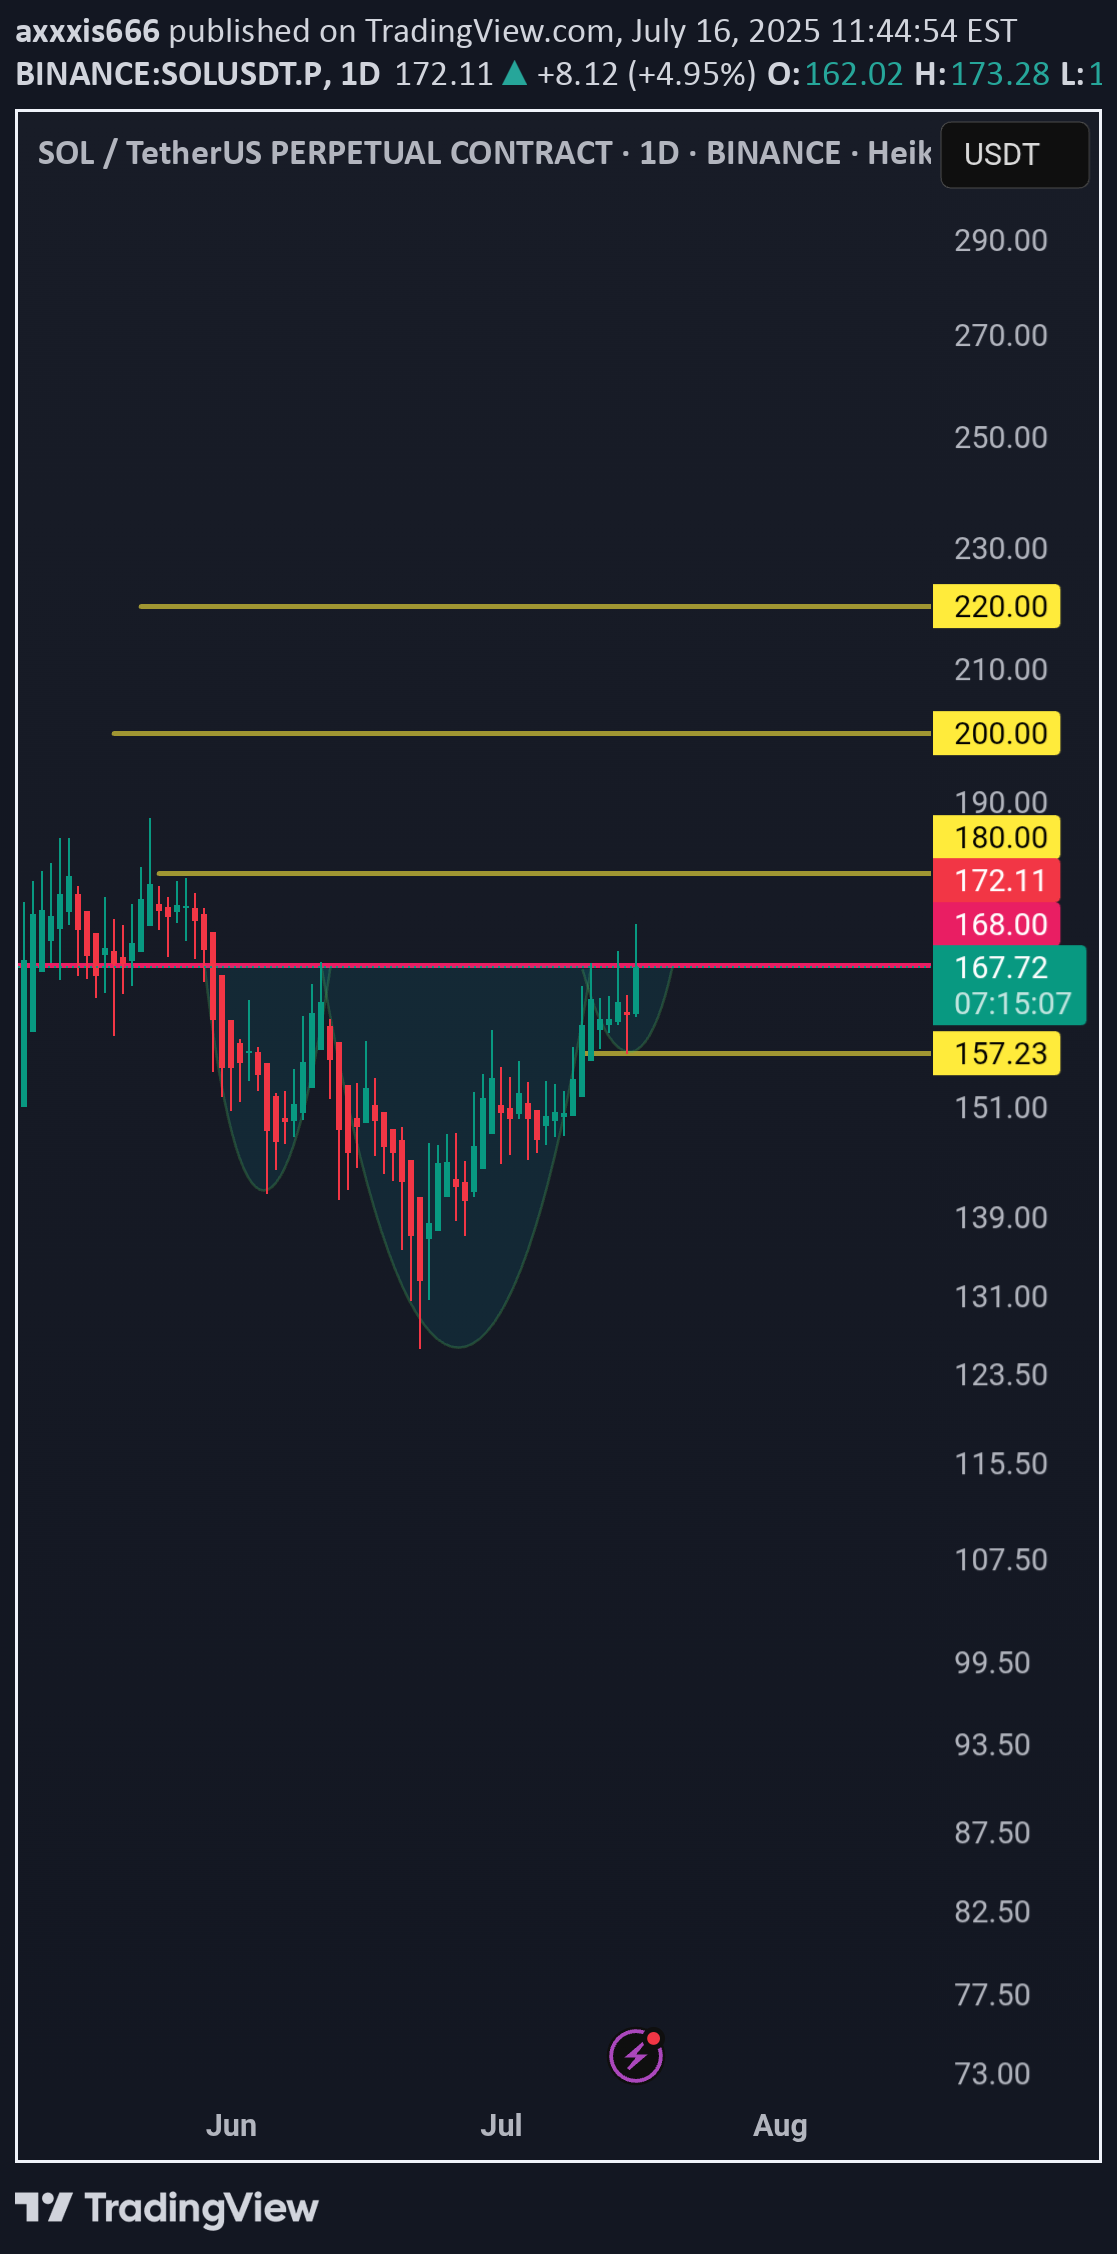
A bullish iH&S/cup&handle pattern is forming. A close above 168 may activate the pattern. Targets are 180, 200 and 220 Invalidation if closes below 157ActivatedTp 1 reachedPlease take partial profit nowTp 2 officially reached.Reached the tp 1 area
axxxis666
If take a look at weekly time frame
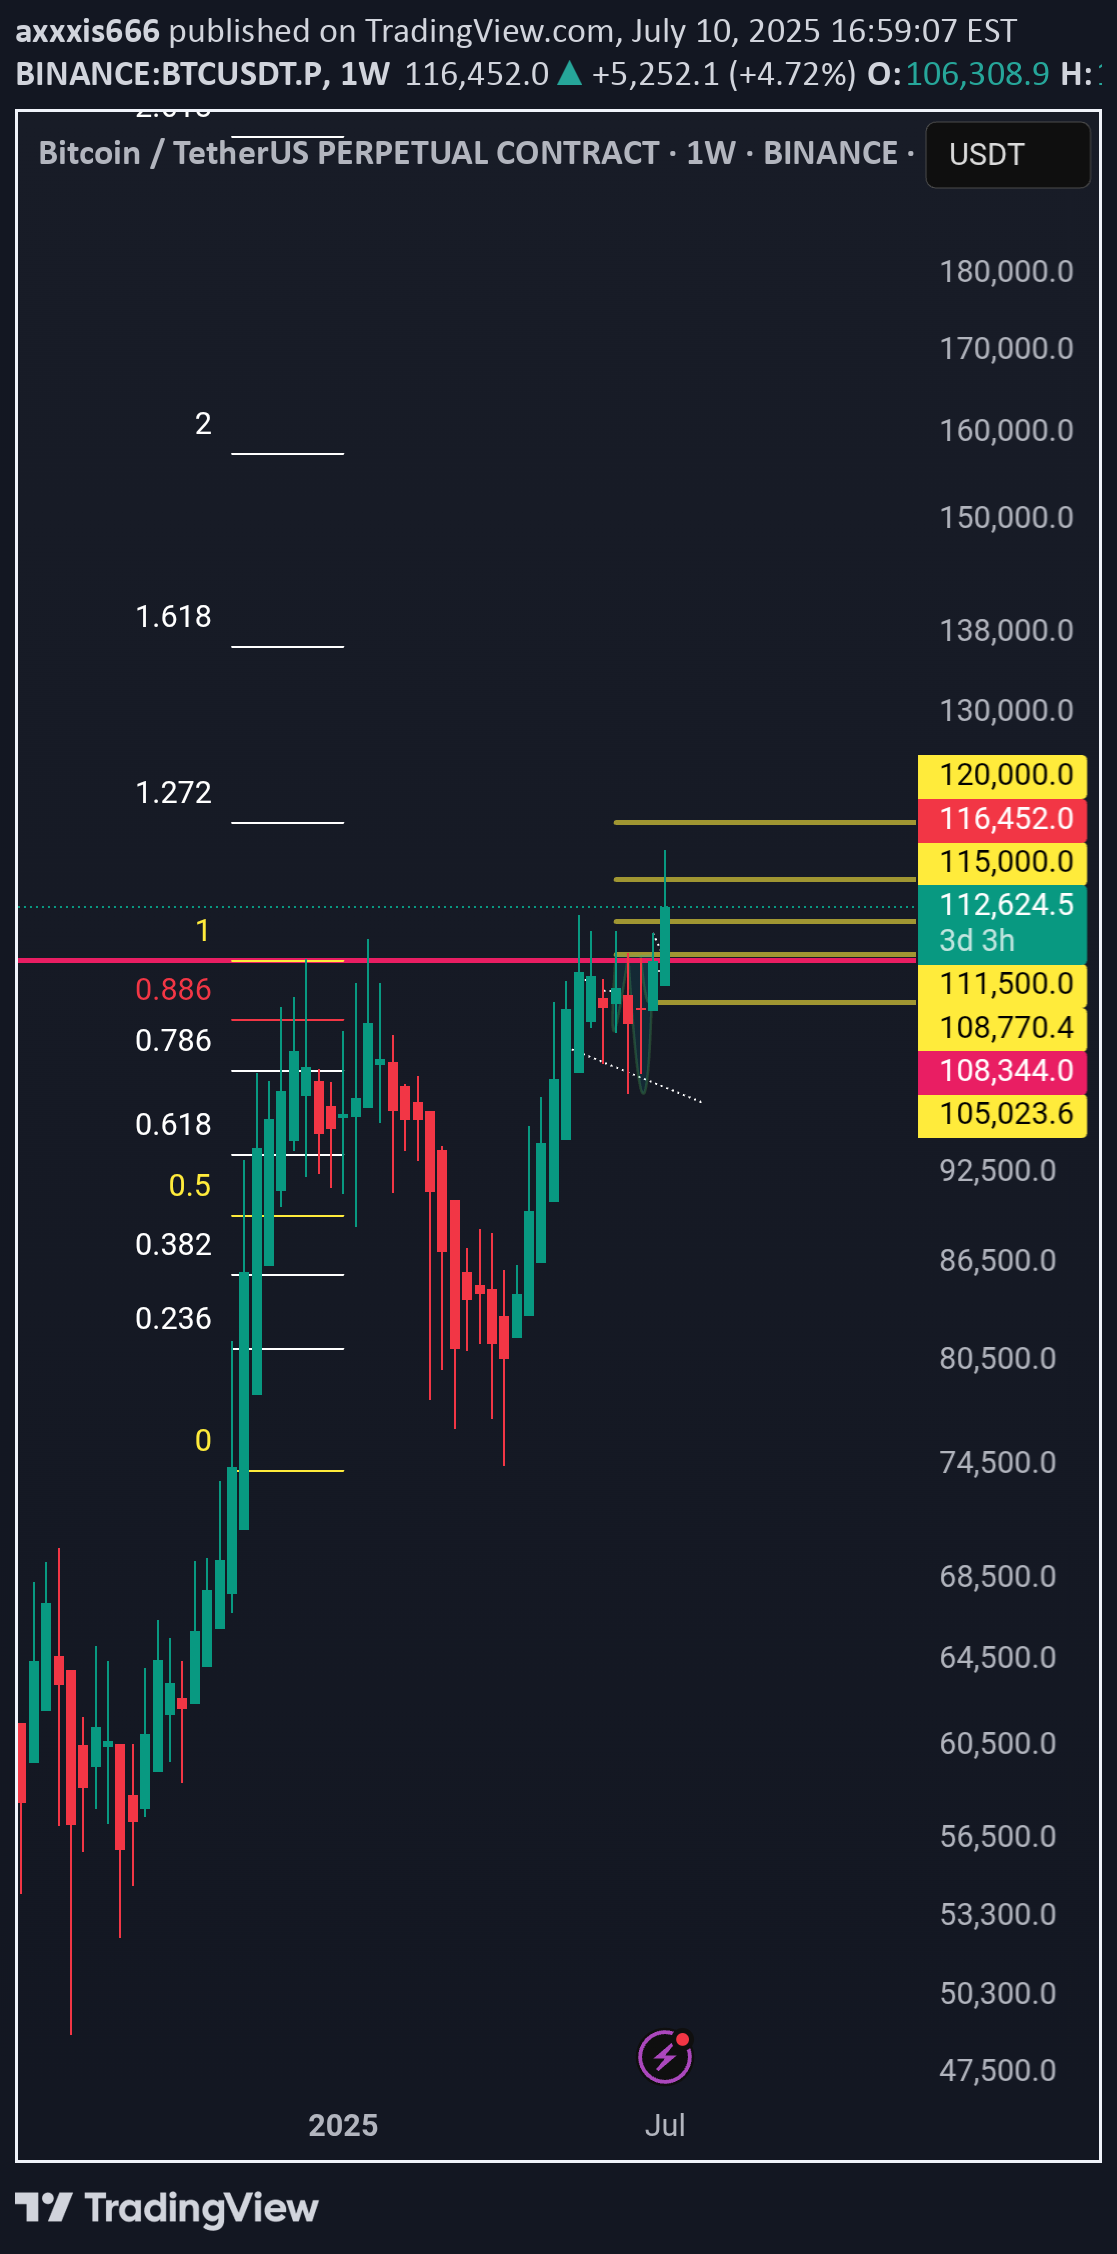
If we take a look at weekly time frame btcusdt has formed a bullish cup and handle/ iH&S pattern and the nearest take profit area is the 120k. It is a good tp area for short term traders.
axxxis666
Ethusdt bullish cup and handle daily
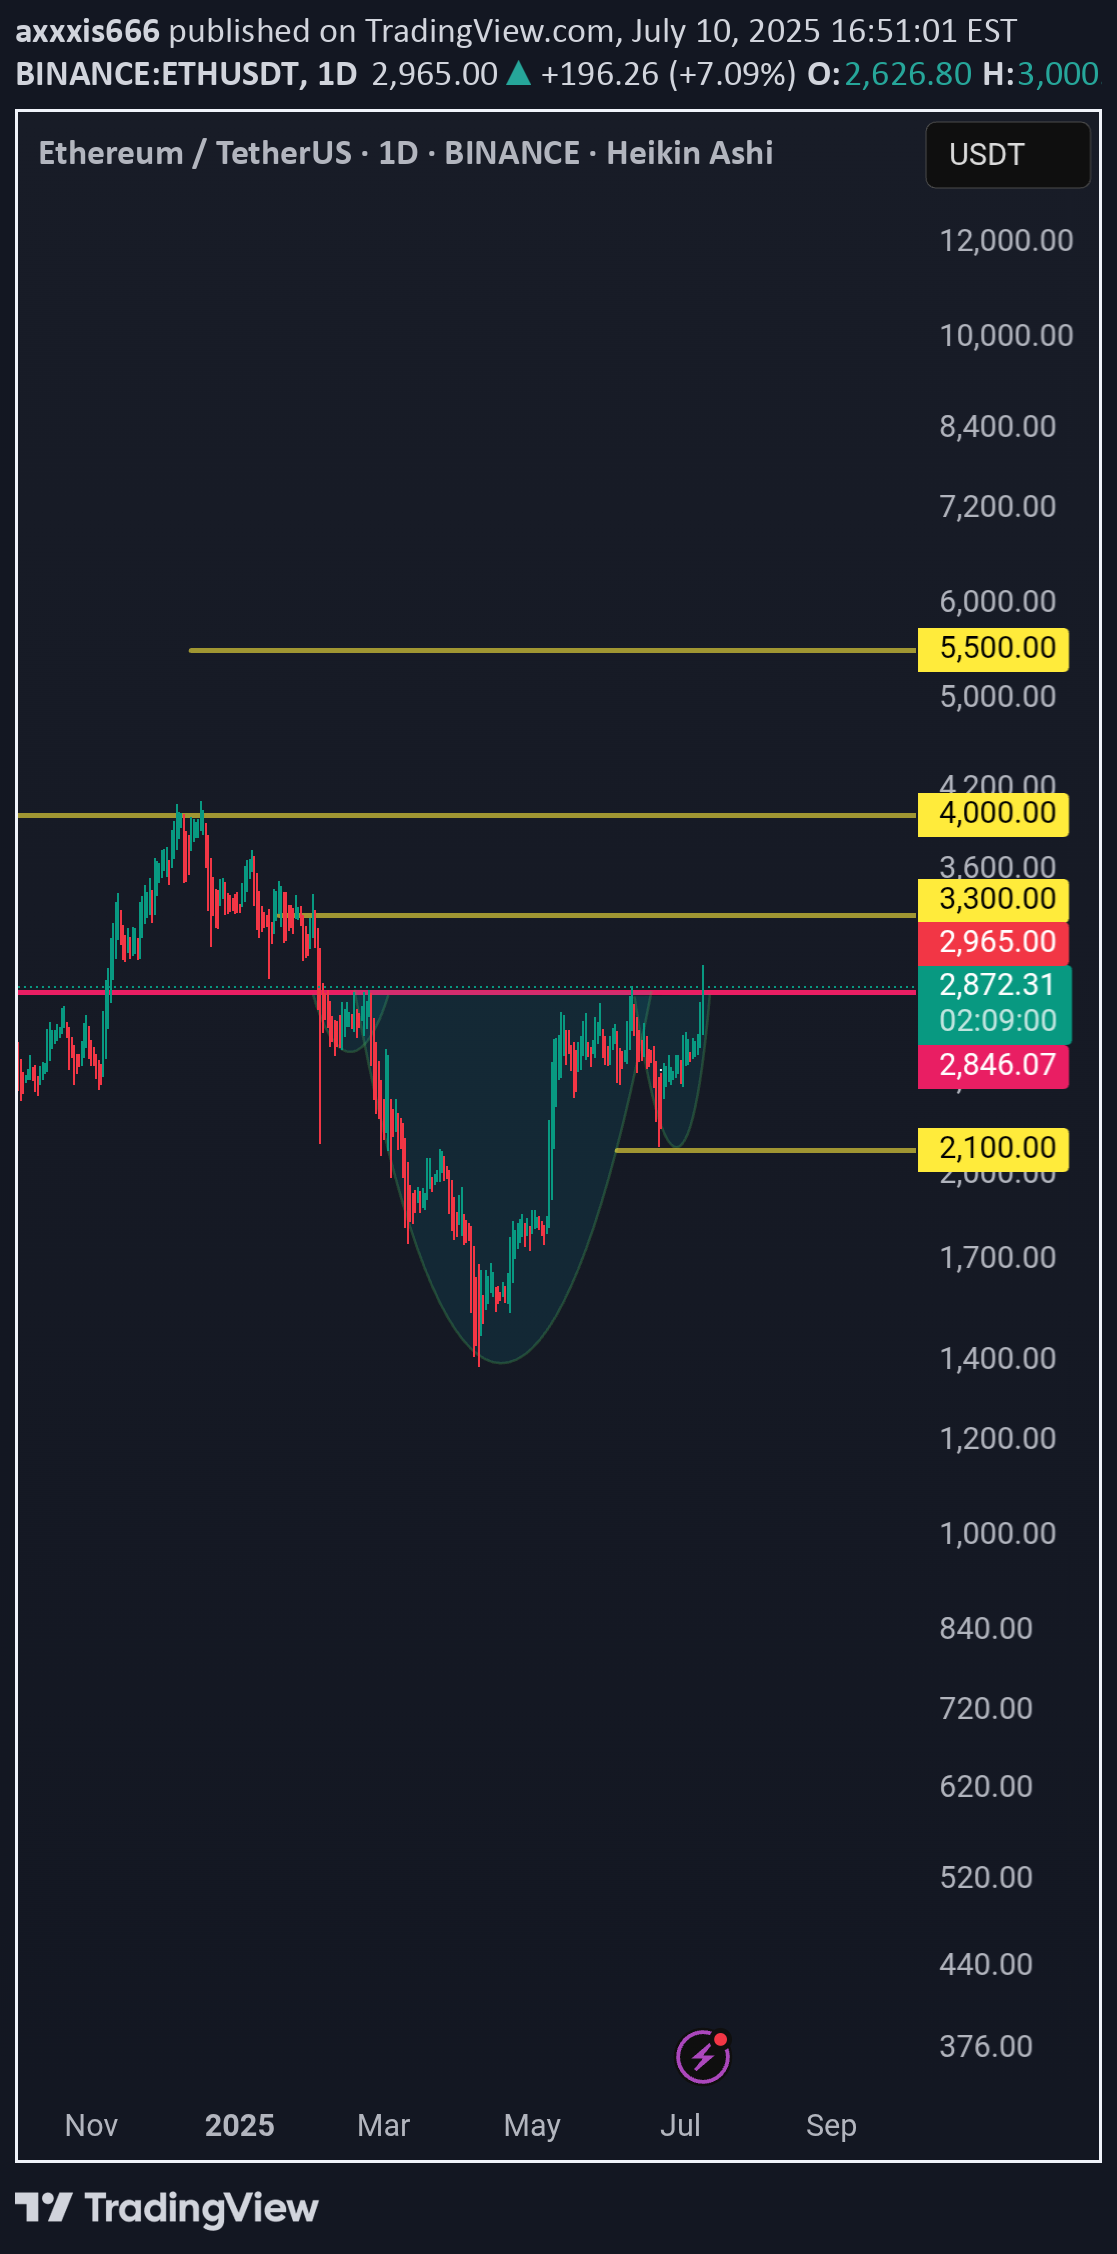
Ethusdt is forming a big cup and handle pattern in daily time frame. A close above 2850 in daily time frame may activate the pattern. Targets are 3300, 4000 and 5500 Pattern invalidation: A close below 2100Activated. For spot traders onlyTp 1 reachesTp 2 reachedTrailing stop reached, manually closed the trade.
axxxis666
Solusdt 4hr tf Bullish iH&S patter
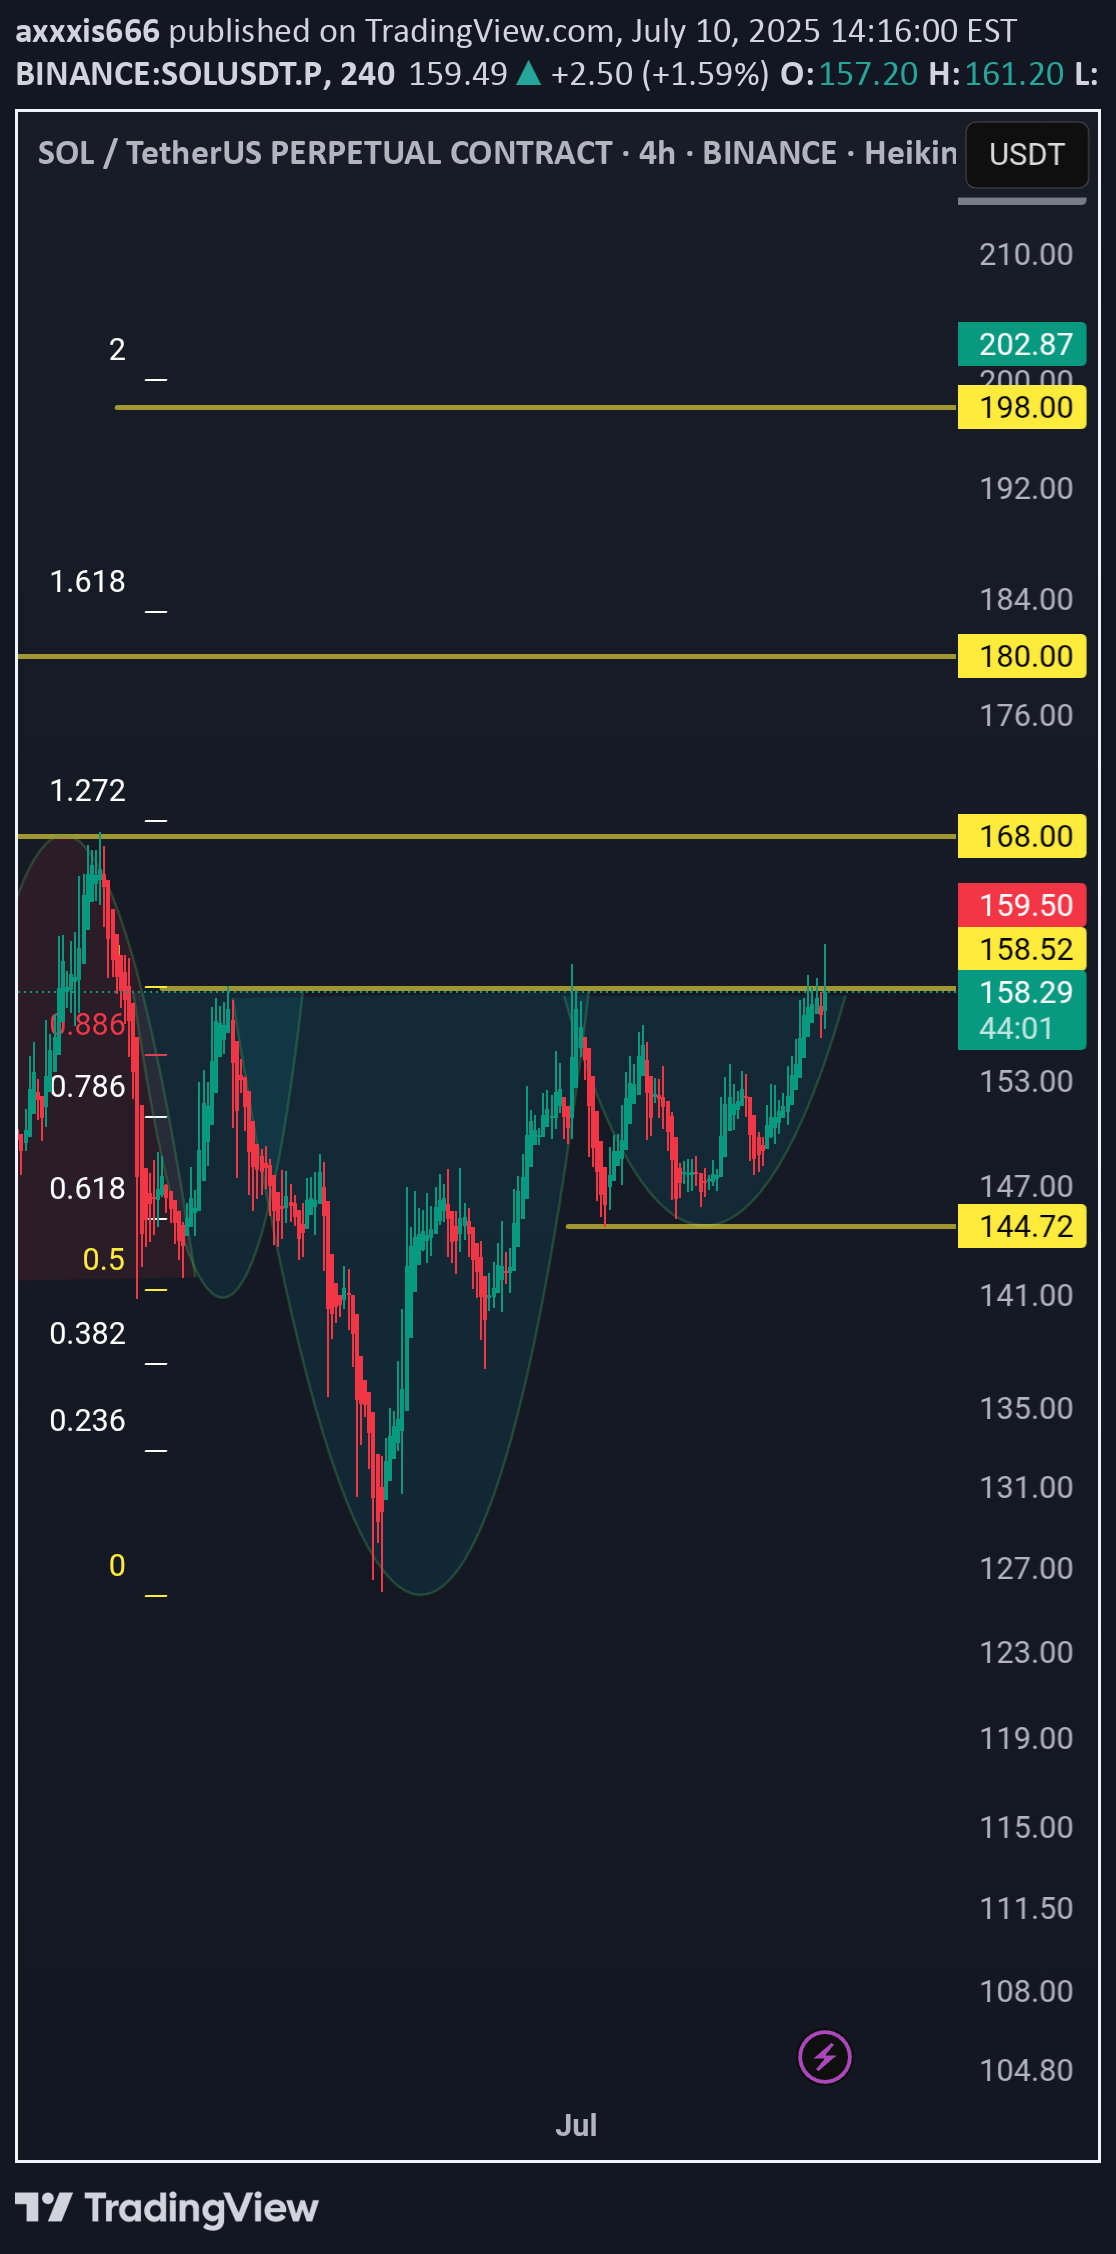
Forming a Bullish iH&S pattern, may activate the pattern if closes above 159. Targets are 168, 180 and 198 Invalidation if closes below 144Activated a while agoTp 1 reachedClosed manually. Reached breakeven area
Disclaimer
Any content and materials included in Sahmeto's website and official communication channels are a compilation of personal opinions and analyses and are not binding. They do not constitute any recommendation for buying, selling, entering or exiting the stock market and cryptocurrency market. Also, all news and analyses included in the website and channels are merely republished information from official and unofficial domestic and foreign sources, and it is obvious that users of the said content are responsible for following up and ensuring the authenticity and accuracy of the materials. Therefore, while disclaiming responsibility, it is declared that the responsibility for any decision-making, action, and potential profit and loss in the capital market and cryptocurrency market lies with the trader.