
ashif030
@t_ashif030

What symbols does the trader recommend buying?
Purchase History
پیام های تریدر
Filter
XAUUSD Sell Opportunity!
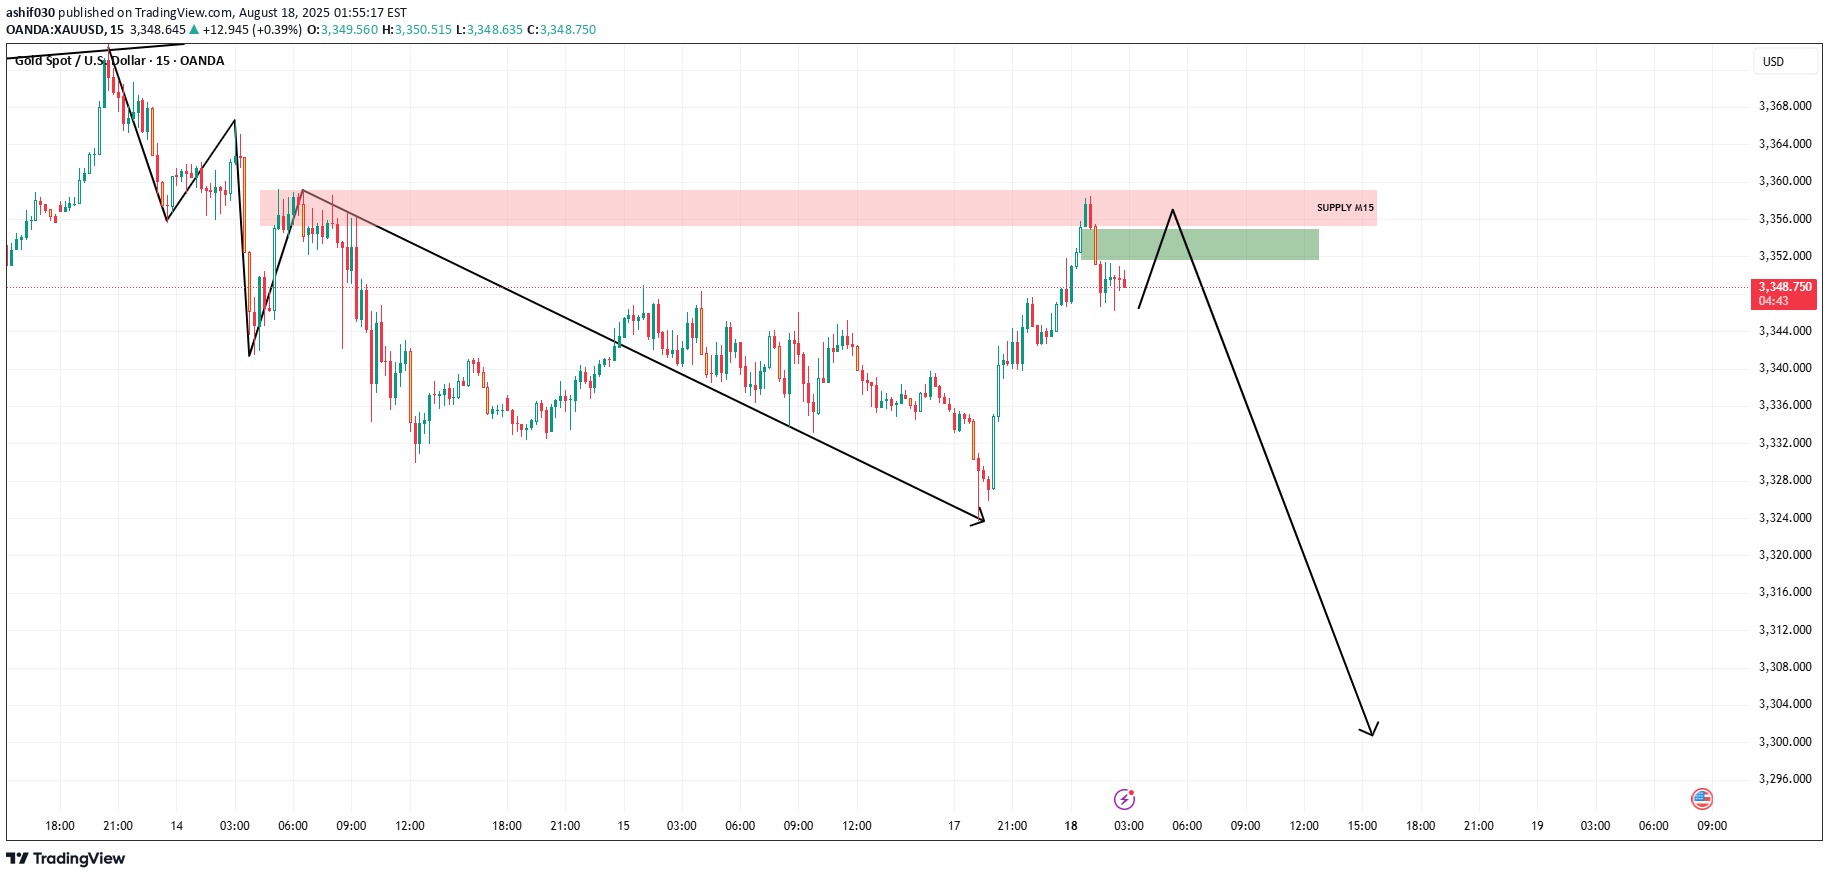
Gold (XAU/USD) remains in a bearish market structure on the M15 timeframe. Price has now tapped into the supply zone (3352 – 3356) and is showing signs of rejection. 🔎 Trade Idea: Bias: Bearish Sell Zone: 3352 – 3356 Stop Loss: Above 3360 Take Profit 1: 3340 – 3332 Take Profit 2: 3300 📌 Notes: Structure still favors sellers (lower highs and lower lows). Watch for candlestick confirmation before entry. Risk management is key – trade safe!
XAUUSD BUY OPPORTUNITY!
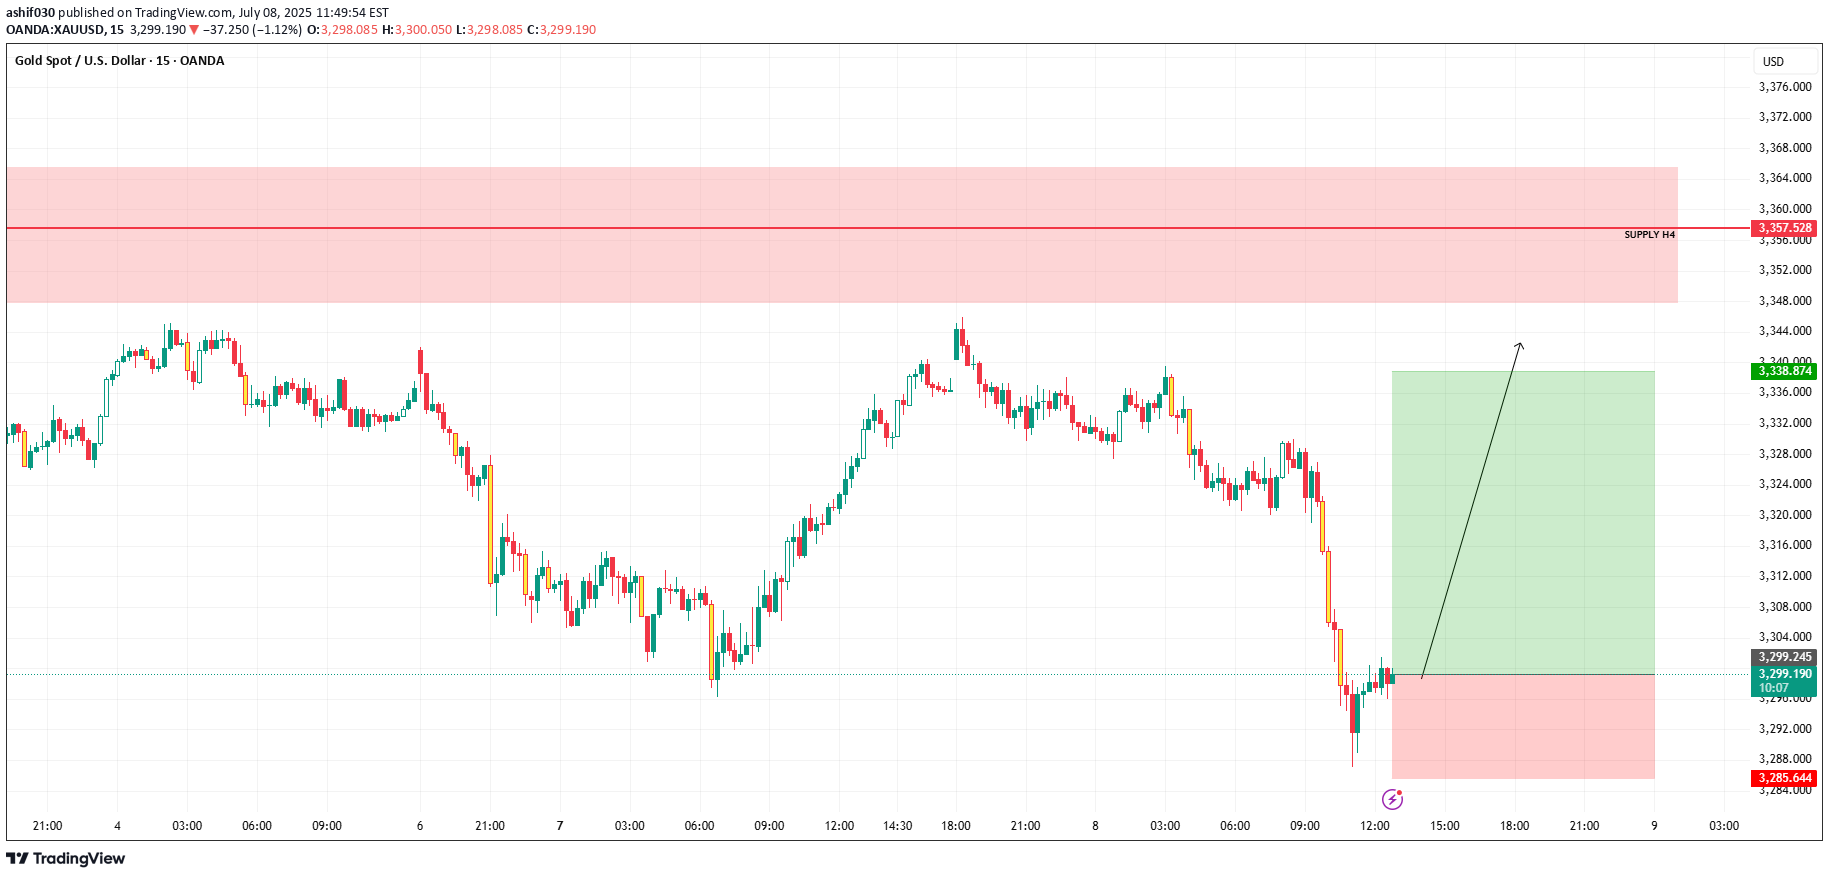
🟢 Current Trade Setup (Buy Position)Entry: Around 3,299.46Take Profit (TP): 3,338.87Stop Loss (SL): 3,285.64Risk-Reward Ratio: ~1:3 ➜ This is a favorable R:R setup.Key Zone - Supply AreaMarked as SUPPLY H4 (Higher Time Frame 4H supply zone).Price Range: ~3,350 to 3,368+This is where sellers may aggressively enter the market.A potential reversal zone—watch price action closely when it reaches there.🔸 Recent Price ActionA strong sell-off occurred before this setup.Price then formed a sharp wick and a potential demand reaction around 3,285–3,290.Price is now attempting a bullish recovery (possibly a liquidity grab followed by accumulation).🔸 Bullish SignalThe recent structure shows a double bottom / demand reaction.Entry aligns with the bottom of the move, offering good positioning.📌 What to WatchIntraday Buyers’ Momentum:If volume supports upward momentum, it could push price toward TP.Reaction at 3,320–3,340:Minor intraday resistance zones before the TP.If price hesitates, consider partial profit-taking.Rejection from Supply H4:TP is placed just below the H4 supply zone — smart take.Avoid extending TP unless there's a strong breakout candle.🧠 Summary✅ Strong R:R setup.✅ Clean reaction from demand.🚨 Supply H4 zone ahead — expect resistance near 3,350–3,360.📈 As long as price holds above ~3,290, the setup is valid.
Gold Buy Opportunity!

🟨 Key Zones:POI: Identified as the Point of Interest (POI) or a 15m demand zone.Gray Box: Likely the true demand area (origin of the impulsive move), aligned with the red support line around $3,351.898 – $3,360.000.Lower Orange Zone: Labeled as 4H and Daily Demand, a major higher timeframe support zone.🔄 Market Structure:The chart shows a clear uptrend, with higher highs and higher lows.A recent correction is underway toward the POI/demand zone.The chart anticipates a bullish bounce from the POI, targeting the $3,498.209 resistance zone (marked at the top).✅ Potential Trade Idea (Long Setup):Entry Zone: Between $3,360 – $3,351 (gray demand zone).Target: Around $3,498.Invalidation (SL): Below $3,351, or further below the demand zone, to reduce the risk of stop hunt.RR: Favorable if managed properly, roughly 1:4 or higher.

Market Structure & Trend:The chart shows a strong bullish move followed by a correction.The price has reached a key resistance area near $2,816 - $2,829, where selling pressure is observed.A potential bearish setup is forming, indicating a possible price decline.Key Observations:Bearish Setup:A short trade setup is marked with a stop-loss above resistance (~$2,829).The take-profit target is near $2,786, aligning with previous demand levels.Support & Demand Zone:A yellow demand zone (H1) is marked around $2,776 - $2,786, which could act as a strong support area.If price reaches this zone, buyers might step in for a potential reversal.Trendline & Structure:The chart shows a possible break of the rising trendline, supporting a bearish move.If price fails to break below $2,786, consolidation or a bullish bounce might occur.Trading Plan:Bearish Bias:Entry: Near $2,812 - $2,816Stop-Loss: Above $2,829Take-Profit: $2,786, with potential extension to $2,776Bullish Reversal Possibility:If price strongly reacts at the H1 demand zone, buyers could enter for a reversal back to $2,800+

Support Zone Identification:A strong rejection near $2736.55 highlights the presence of buyers at this level. This could act as a springboard for a bullish reversal.Trade Idea:Entry:A potential long trade is feasible near $2736.55, once the price shows confirmation of rejection and upward momentum.Stop-Loss:Below $2730.60, as a break below this level may invalidate the bullish bias.Target:The supply zone at $2767.82, aligning with the broader downtrend structure.Risk-to-Reward Ratio:The setup offers an attractive risk-to-reward ratio, ensuring the risk is minimal compared to the potential gain.Confluence Factors:The demand zone near $2736.55 aligns with recent price consolidation.The broader market structure remains intact, with the supply zone acting as the next significant resistance.Conclusion:Monitor the $2736.55 level for signs of bullish price action before entering the trade. A successful breakout could see XAUUSD targeting the $2767.82 supply zone.
GOLD BUY OPPORTUNITY!

Demand Zone (Green Area):A clearly marked demand zone lies below the current price level. This zone could potentially act as a strong support area where buyers are likely to step in.Price Movement Projection:The drawn path suggests that the price may drop into the demand zone and then reverse sharply upward toward the marked resistance level at $2,724.91.Buy Opportunity:Look for long positions around the demand zone if there are signs of reversal (e.g., bullish candlestick patterns or other confirmation signals).Target:Aim for the resistance at $2,724.91 as the first target.Stop Loss:Place a stop loss below the demand zone to manage risk in case the price breaks lower.
XAUUSD Sell Opportunity

Bearish Momentum:1. A sharp move down (red arrow) is expected as price leaves the supply zone.2. The confirmation of the bearish trend is seen in the breakdown of minor support levels.Trend:The current price action indicates a potential trend reversal from bullish to bearish.Key Risk:If the price breaks above the H1 supply zone, it invalidates the bearish setup and suggests further upside.
Gold Buy Opportunity!

Demand Zones (Yellow Boxes):The highlighted yellow zones indicate demand areas where buying interest is expected. Price might retrace to these zones before a potential move is higher.Imbalance and Price Targets:The chart illustrates an imbalance in price action, likely from a rapid bearish move (shown in the earlier left side). This is marked with a potential corrective wave.Projection (Red Arrow):A retracement is expected, possibly to test a lower level of support (around 2,641 or lower to the demand zones). After retracement, a bullish move towards the yellow resistance area (2,684 zone) is anticipated.Structure:The recent trend shows higher highs and higher lows, hinting at bullish momentum after the previous sell-off.
Gold Buy Opportunity

Gold now in my M15 demand zone. Gold is bullish in my opinion and this is a good bottom
Gold Sell Opportunity!

Use pending order. Hopefully, it will give us some good profit.
Disclaimer
Any content and materials included in Sahmeto's website and official communication channels are a compilation of personal opinions and analyses and are not binding. They do not constitute any recommendation for buying, selling, entering or exiting the stock market and cryptocurrency market. Also, all news and analyses included in the website and channels are merely republished information from official and unofficial domestic and foreign sources, and it is obvious that users of the said content are responsible for following up and ensuring the authenticity and accuracy of the materials. Therefore, while disclaiming responsibility, it is declared that the responsibility for any decision-making, action, and potential profit and loss in the capital market and cryptocurrency market lies with the trader.