
analizcigeldihanim
@t_analizcigeldihanim

What symbols does the trader recommend buying?
Purchase History
پیام های تریدر
Filter
analizcigeldihanim
تحلیل زک/تتر (ZEC/USDT): سطوح کلیدی حمایت برای بازگشت احتمالی قیمت
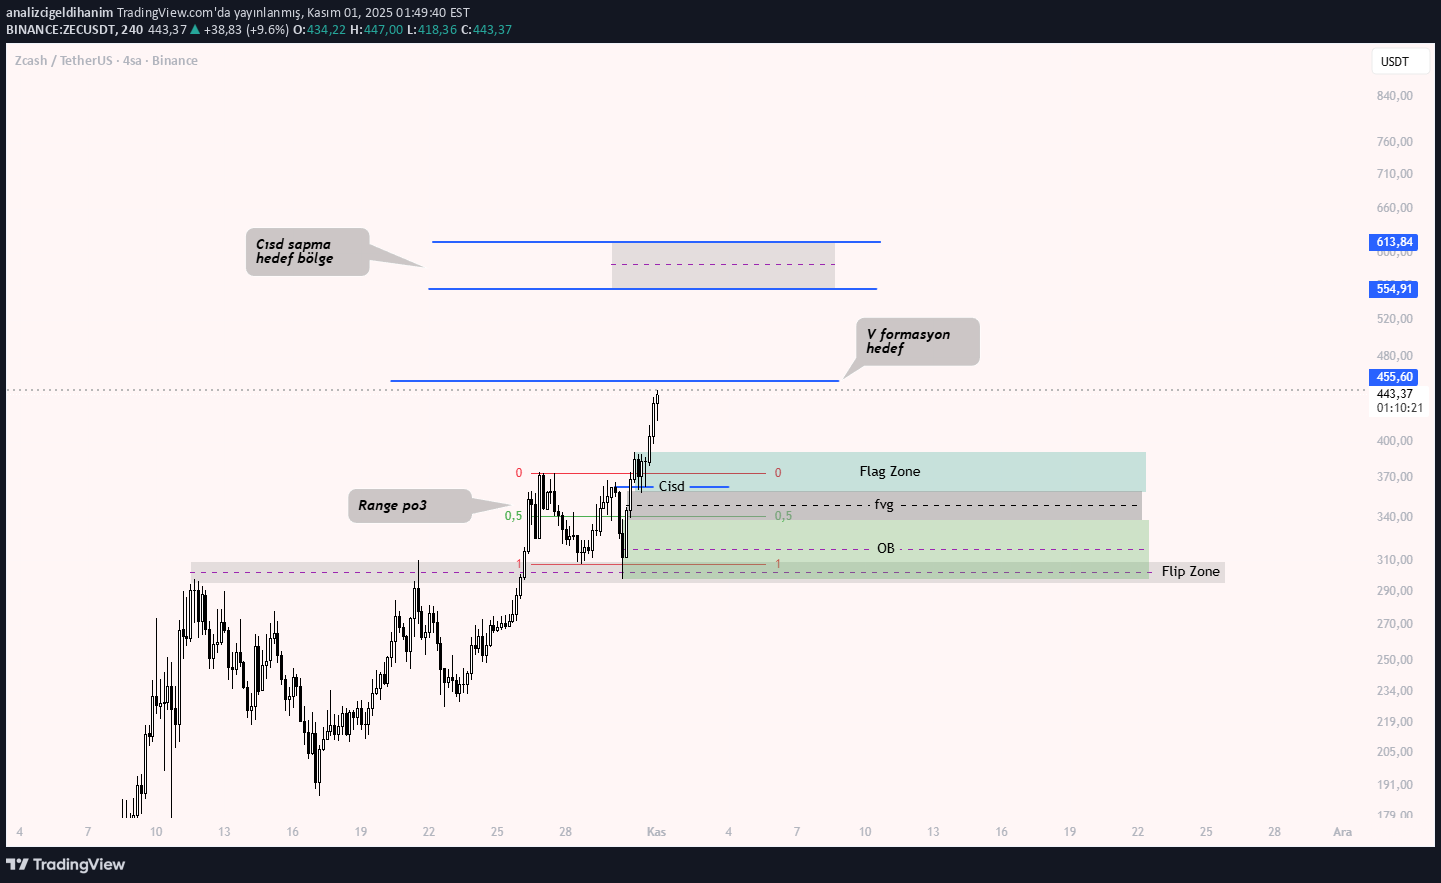
The chart is for follow-up purposes. I have already marked the areas where the price may act as support in case of an increase or possible pullbacks.
analizcigeldihanim
تحلیل روزانه قیمت ریپل (XRP): از محدوده تا اهداف قیمتی! (بدون توصیه سرمایهگذاری)
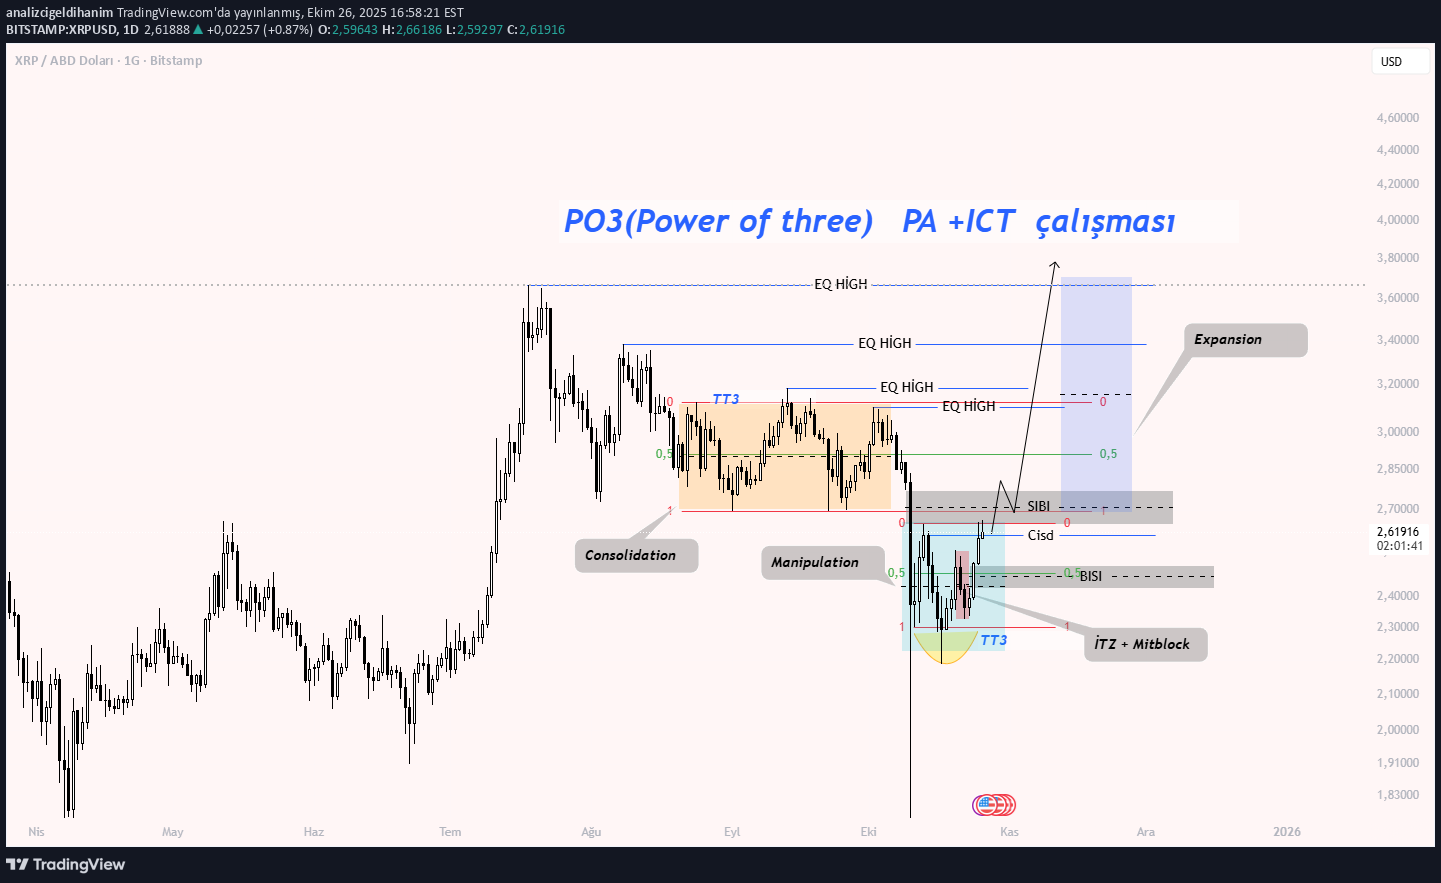
It is a daily chart analysis. It is a PA + ICT study. If it enters the range, I think there will be an expansion in the price movement. If the price retreats from here to the BISI point, I guess it will be viewed as buying. The PO3 structure will be active when the price is above the SIBI level and the channel enters the alt band. The targets will be the EQ High points I mentioned above, respectively. It is a daily chart; Goals may not come immediately. The chart is for tracking purposes only and does not contain investment advice!!! LOTS OF EARNINGS.
analizcigeldihanim
تحلیل نمودار روزانه لایت کوین (LTC/USD): آیا منطقه نوسانی (Range) و الگوی PO3 شکل میگیرد؟
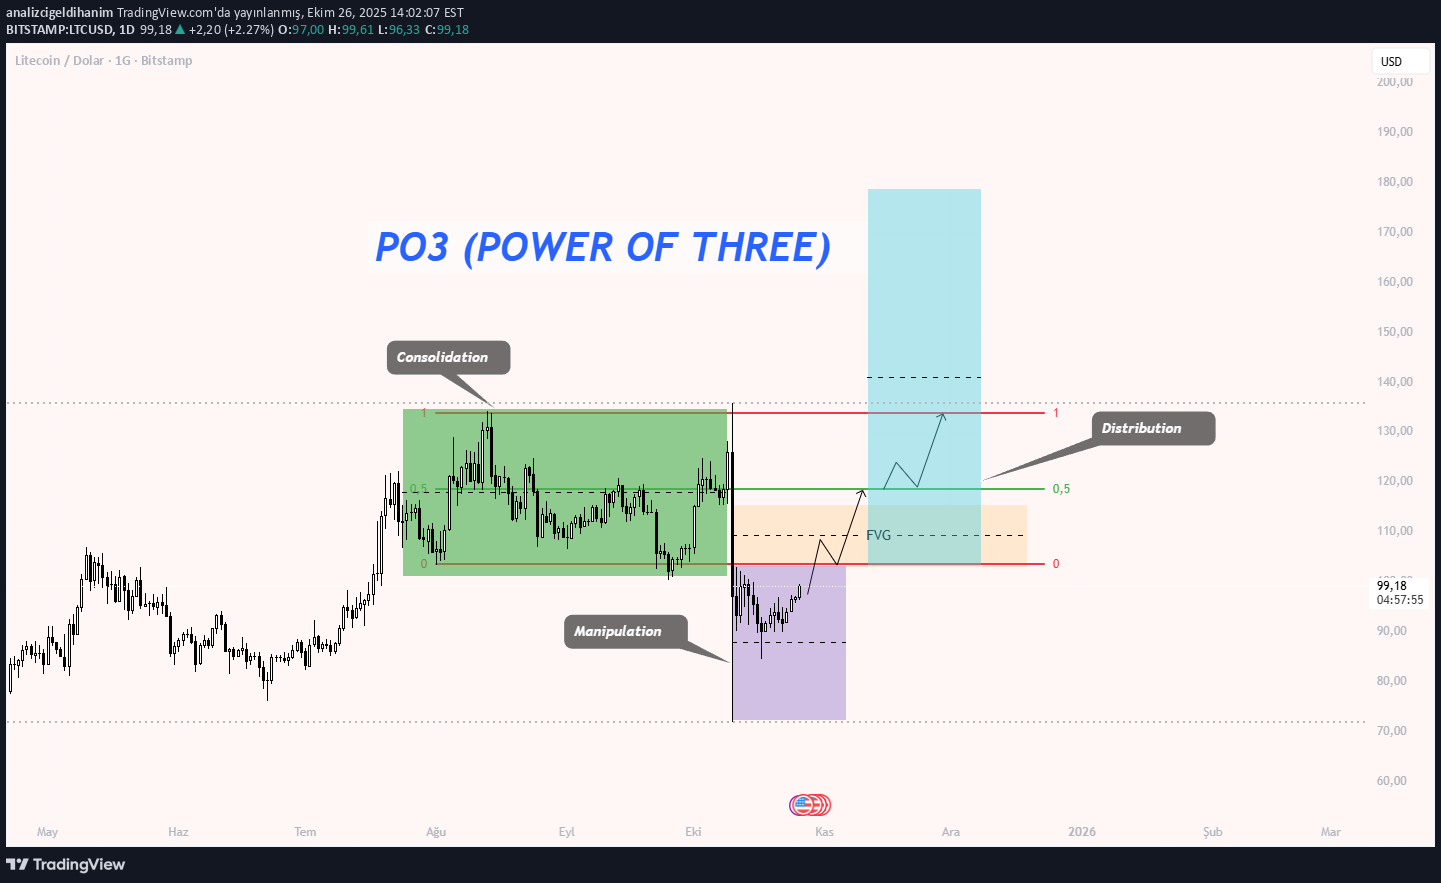
There is a range formation on the daily chart. PO3 formation may occur. Price according to range transaction logic If it enters the range again, the first target range midpoint becomes 0.5. If the price closes daily above the range middle band, range high is its other target... There is PO3 formation. Consolidation manipulation has taken place, next is the distribution part... The chart is for tracking purposes. It does not contain investment advice!!!! LOTS OF EARNINGS.
analizcigeldihanim
تحلیل روزانه بیت کوین: از محدوده تا سوپ لاکپشت و هدفهای قیمتی!
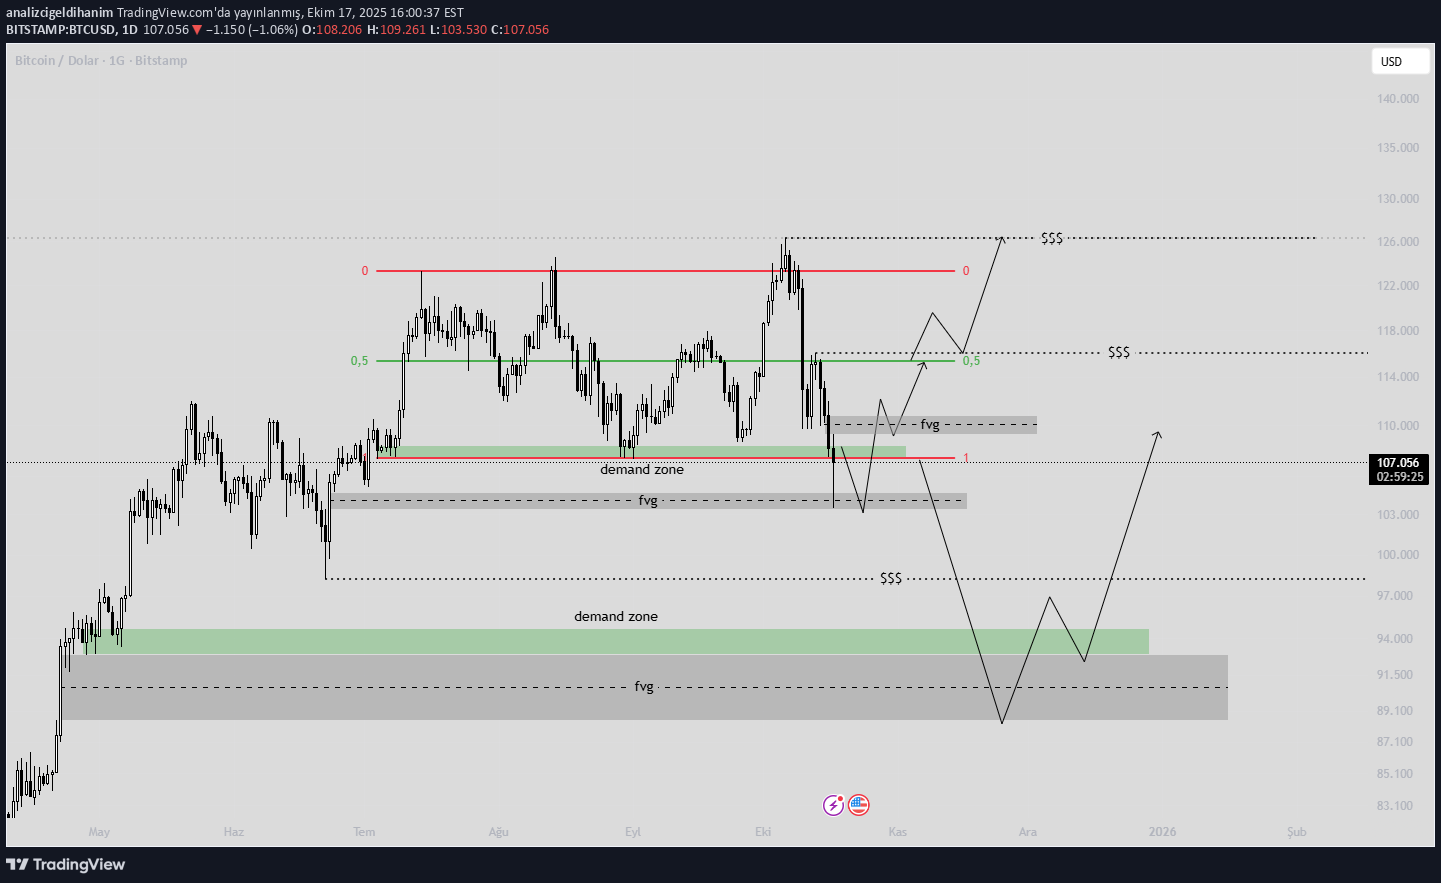
In the daily chart, EQ lows were made within the range, it received a reaction from the fvg region. Turtle soup will be activated by putting it into the range again. If it throws it into the range, our first target is 0.5. If the daily closes are above the midpoint of the range, I think it will make a new ath..... In the opposite scenario, if the decline deepens, the demand zone in the old low and alt zone will be closed and there may be a movement in the upward range in the fvg there again... The chart is for tracking purposes only. It does not contain investment advice!!!
analizcigeldihanim
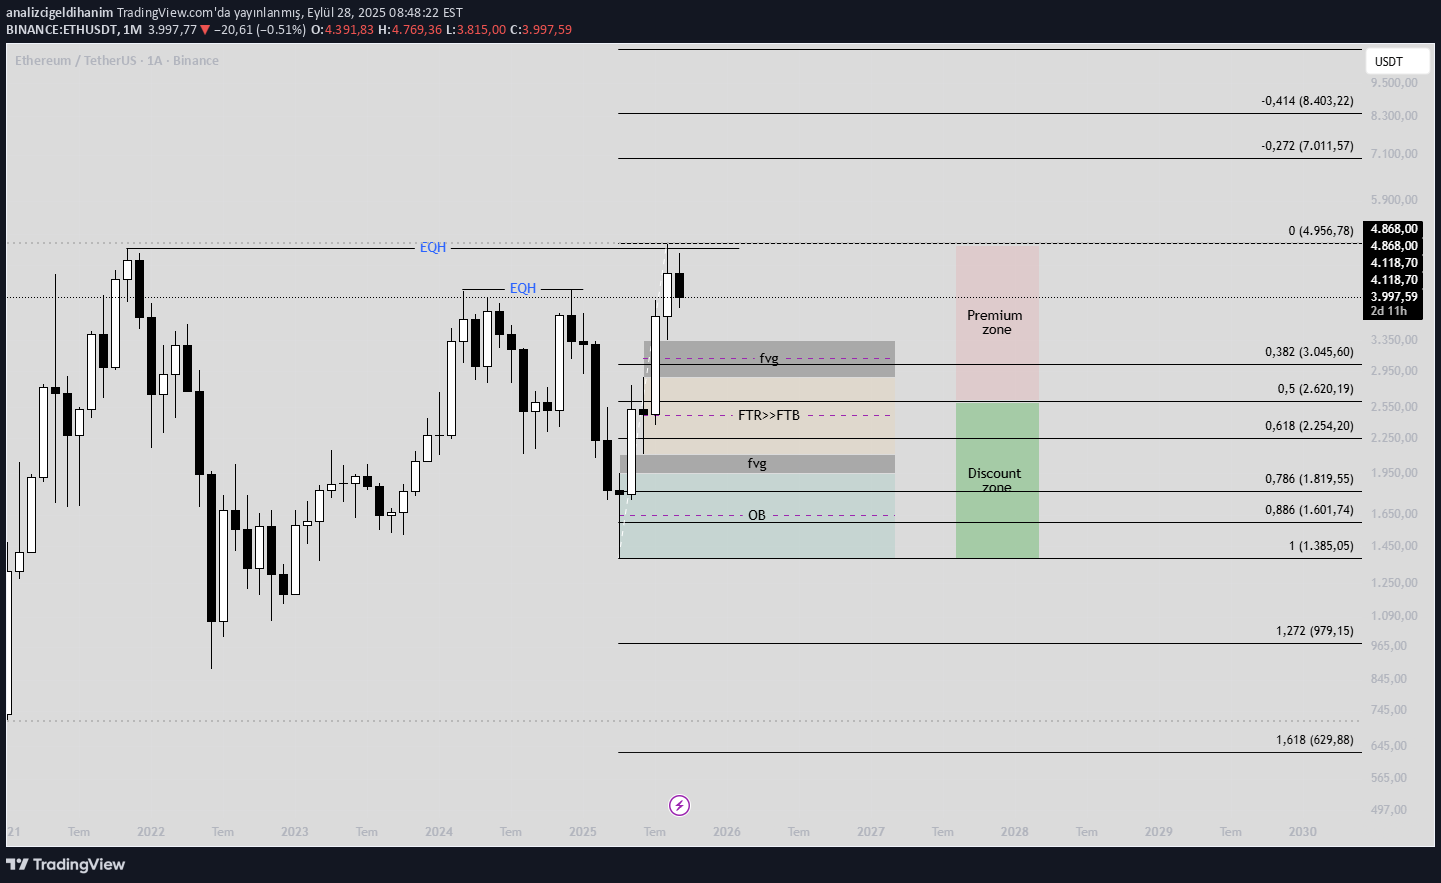
I have shown the fields that the price can return in the monthly graphics. Graphic Follow -up is not included in investment advice !!
analizcigeldihanim
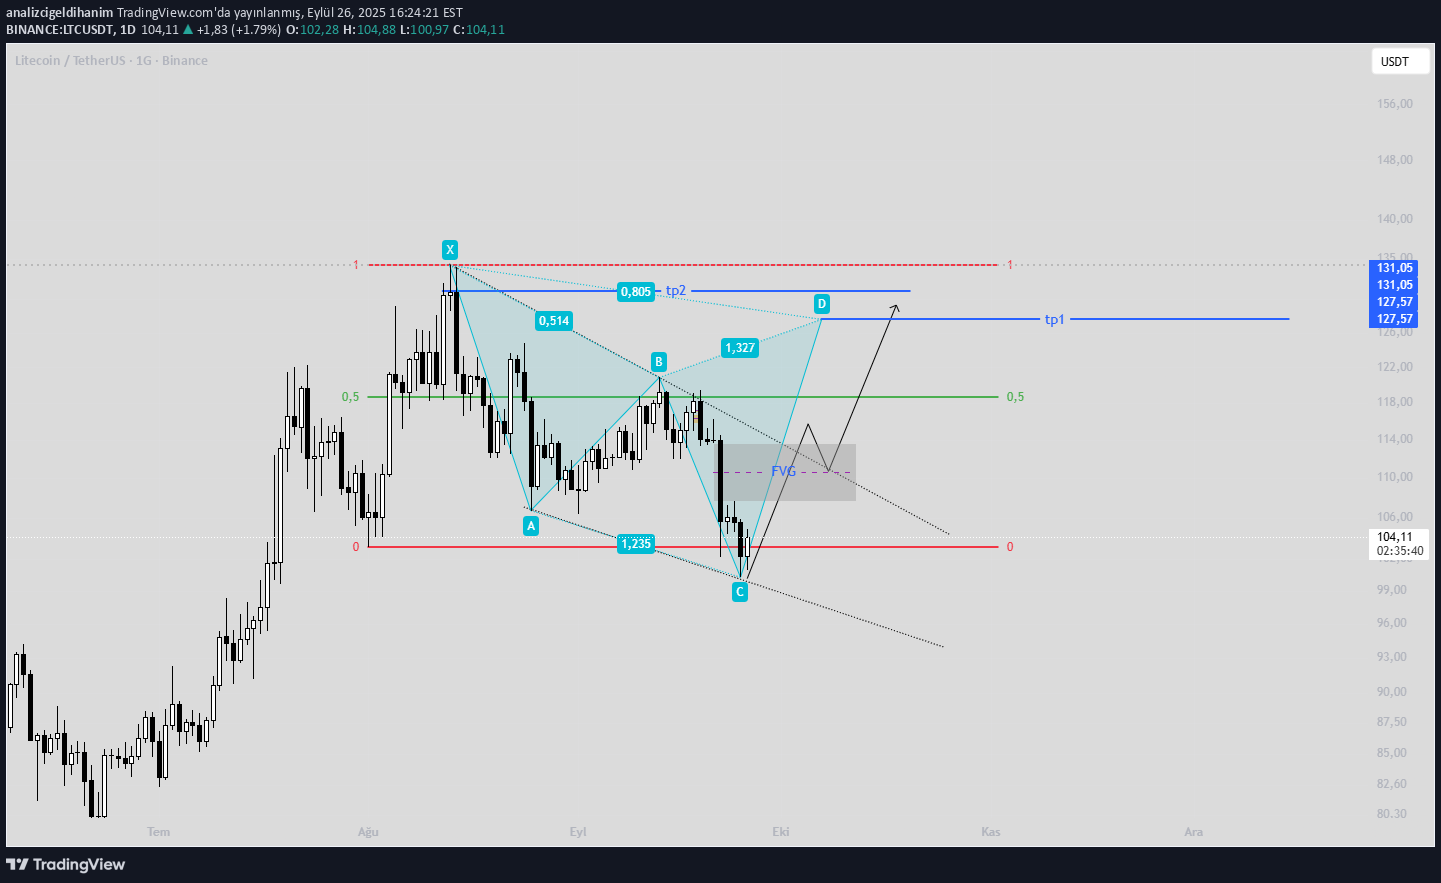
Movement continues in Range İçerisin in Daily Graphic. Old Low Liq Price seems to have thrown it in the range, the first target Range 0.5 point I made possible Cypher Drawing D Point 127 $. Graphic follow -up is for investment advice that does not include plenty of gains.
analizcigeldihanim
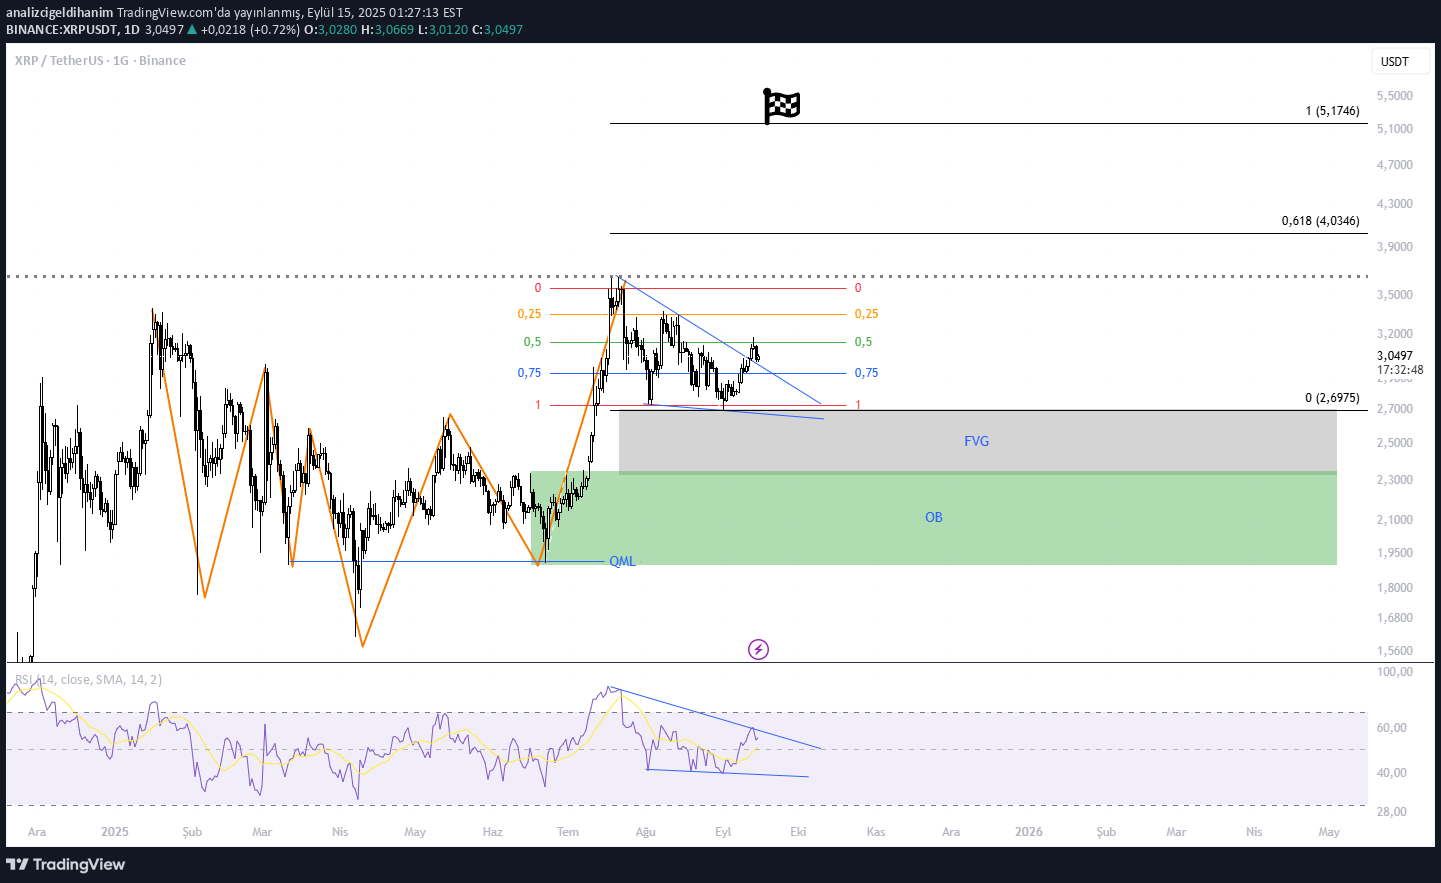
If XRP/USDT Makes daily closures above $ 0.5 of the Range region in Range in Range in the daily graphics, the first goal will be $ 3.50. The chock target for the daily shows the level of $ 5 ... Waam breaks and retestti has been thrown. Graphic is for tracking purposes .. does not include investment advice !!!!
analizcigeldihanim
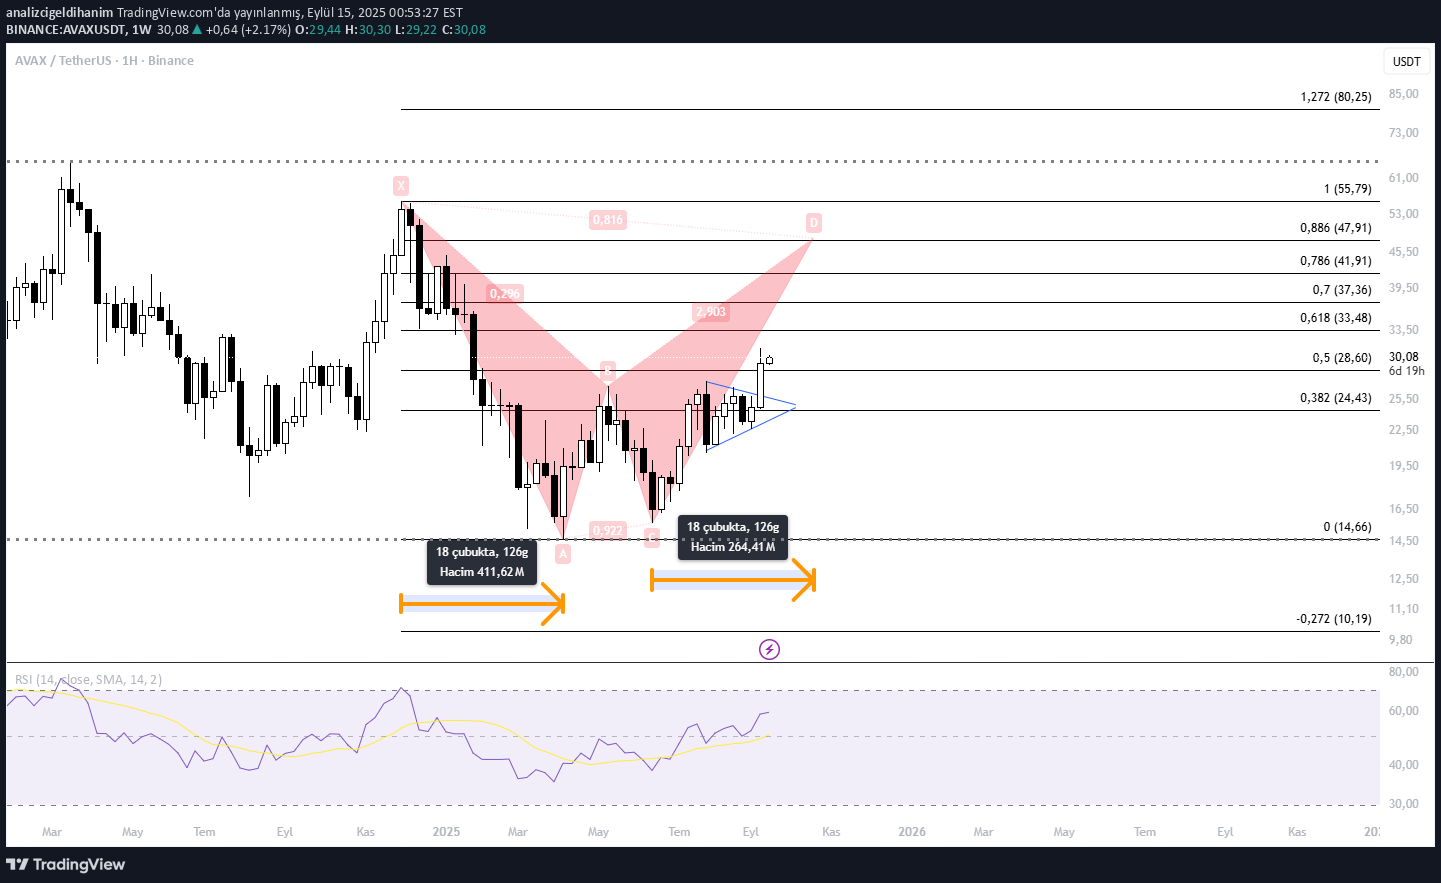
I made a possible bat formation drawing in the weekly graphics. The formation of the C-D foot symmetrically appears to be October 20. Flama Target 37 $ $ It is my drawing for graphic tracking purposes .. does not include investment advice !!!
analizcigeldihanim
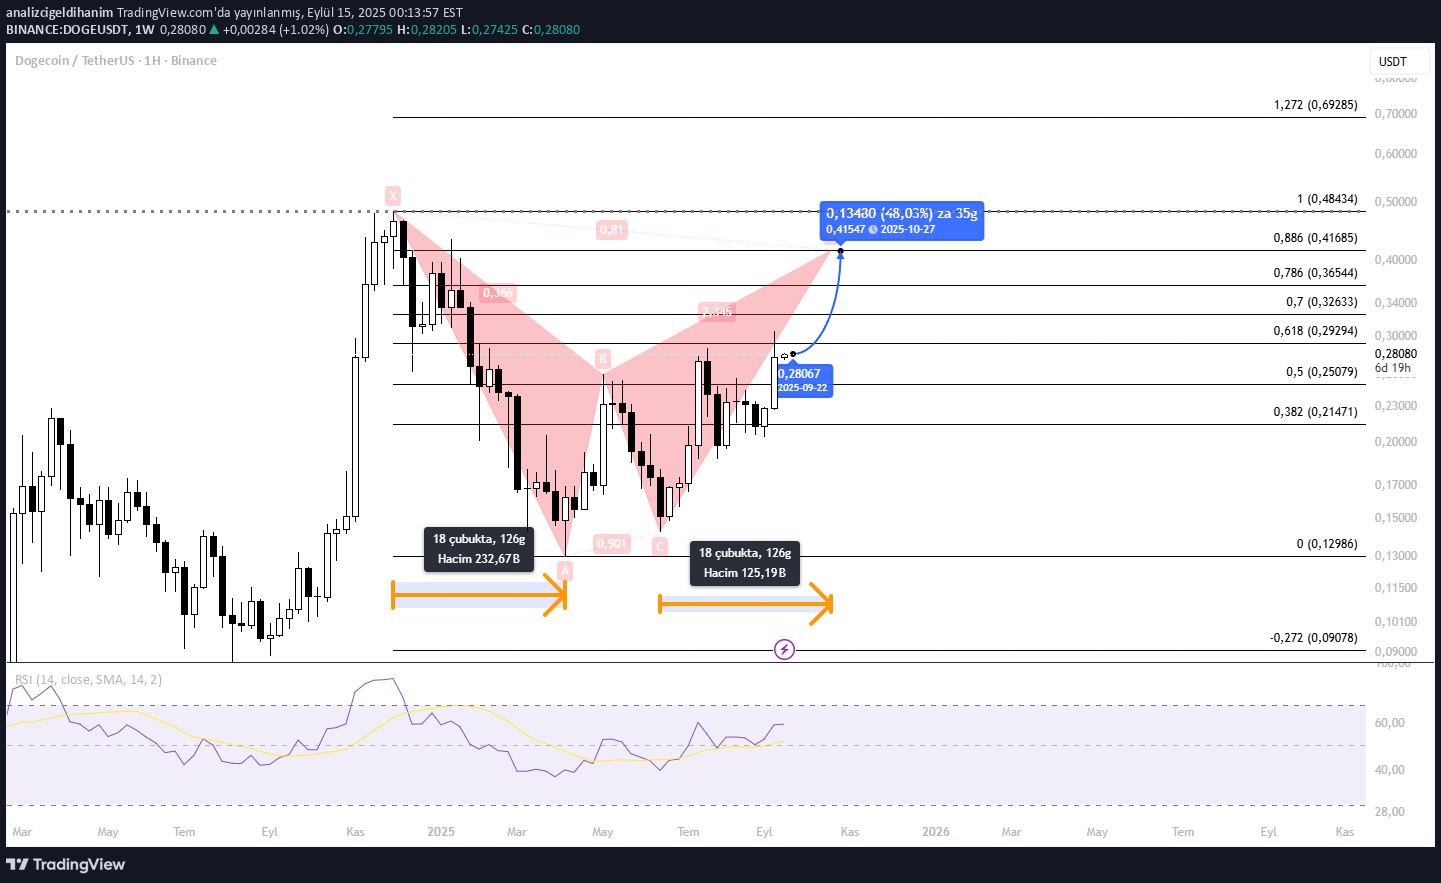
I made a possible bat drawing in the weekly graph. Point D symmetrical formation corresponds to October 20. Graphic Follow -up.
analizcigeldihanim
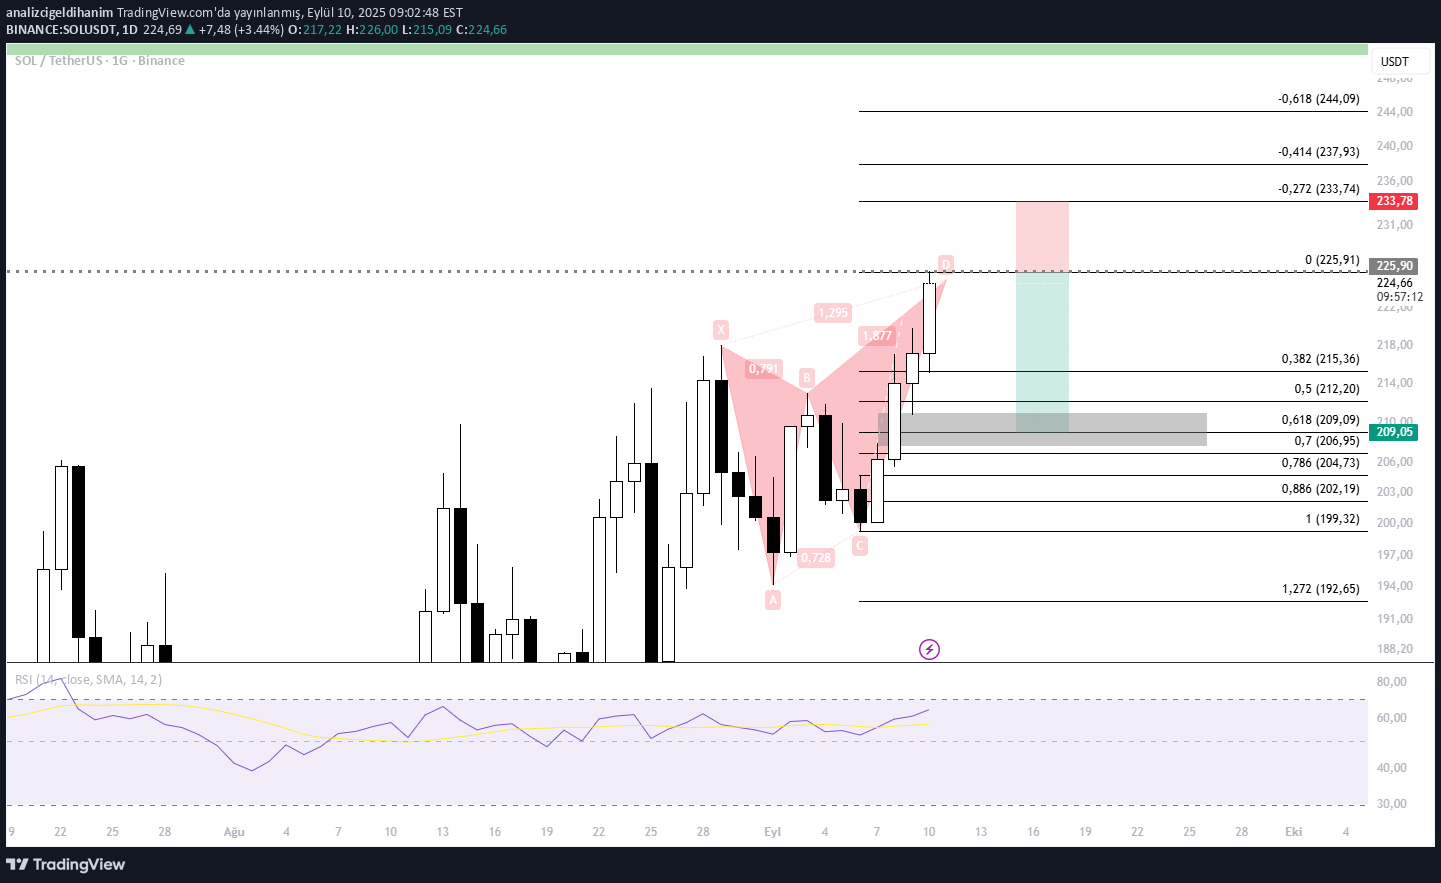
Daily Graphic Butterfly Formation targets Fib 0.382 FIB 0618 Asagi FVG empty falls from these points to the FVG area may be withdrawn from these points to the FVG area ... The profit rate is 8 %risk reward rate 2rr. Graphic Follow -up is not included in investment advice !!
Disclaimer
Any content and materials included in Sahmeto's website and official communication channels are a compilation of personal opinions and analyses and are not binding. They do not constitute any recommendation for buying, selling, entering or exiting the stock market and cryptocurrency market. Also, all news and analyses included in the website and channels are merely republished information from official and unofficial domestic and foreign sources, and it is obvious that users of the said content are responsible for following up and ensuring the authenticity and accuracy of the materials. Therefore, while disclaiming responsibility, it is declared that the responsibility for any decision-making, action, and potential profit and loss in the capital market and cryptocurrency market lies with the trader.