
agatarigan
@t_agatarigan

What symbols does the trader recommend buying?
Purchase History
پیام های تریدر
Filter
The 3-Method Framework: Simplifying Technical Analysis
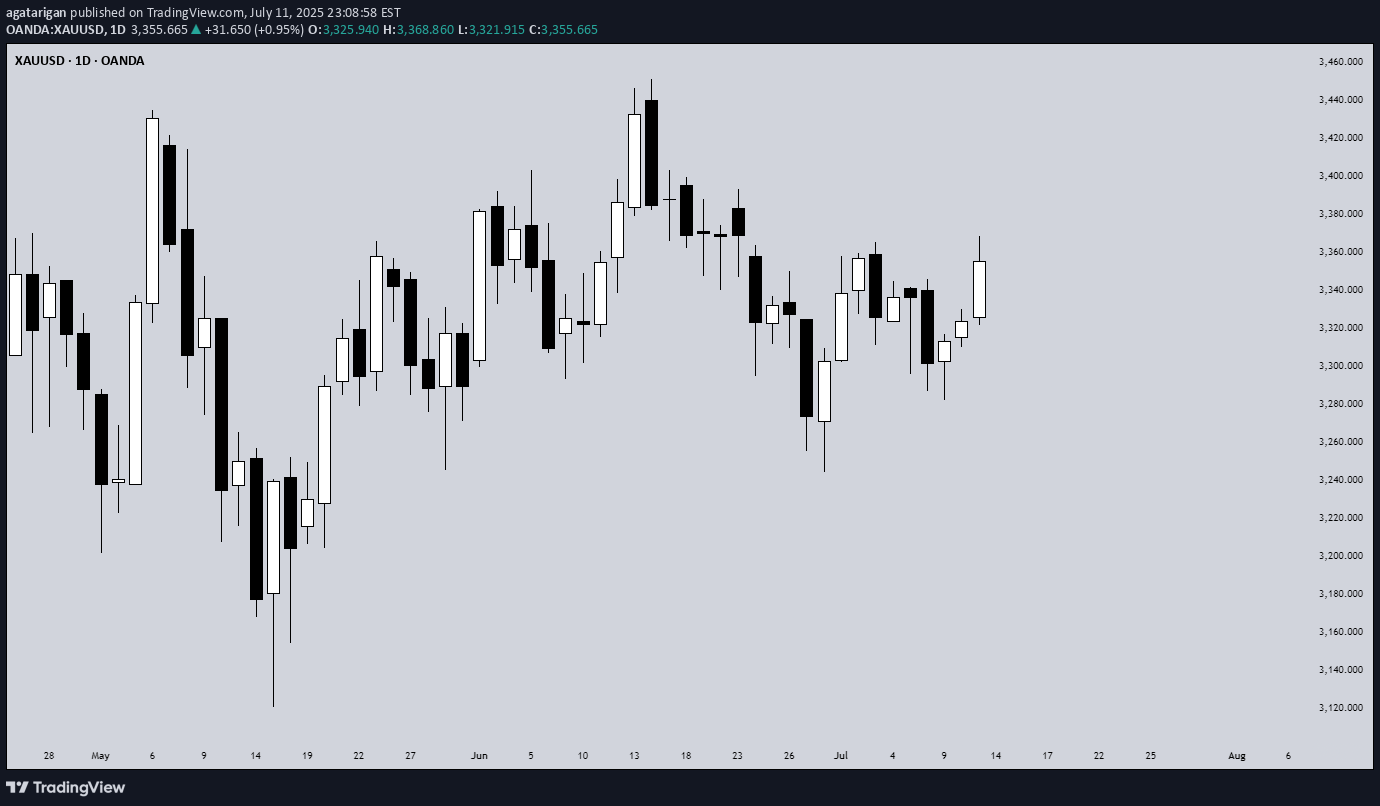
Most traders get caught up in complex indicator setups, thinking that more tools equal better results. We rely on moving averages to tell us if prices are trending up or down, and we depend on support and resistance levels to predict market movement. But what if I told you there's a simpler, more powerful way to read the market using pure price action? Today, I want to share my experience and understanding of bias and expectations for the next candle formation. This approach is refreshingly simple because we don't need to understand every single price movement - we just need to focus on what matters most. Method 1: Opening Price Comparison The first method is beautifully straightforward. For a bullish bias, the current opening price should be above the previous opening price. That's it. Sounds almost too simple, right? But simplicity often holds the greatest power in trading. For Gold yesterday, we simply needed to compare the latest opening price on the Daily timeframe with the previous opening price. It's that simple. Method 2: Mid-Level Analysis The second approach involves comparing mid-levels between candles. We compare the mid-level of the previous candle with the mid-level of the candle before that. I know it might sound a bit complicated when explained this way, but once you visualize it on your chart, the concept becomes crystal clear. Still on Gold, we just compare the 50% or mid-level of the previous candle with the candle two periods back from the latest candle on the daily chart. Method 3: Expansion Expectations The third method helps us anticipate expansion in price. Traditional complex methods require analyzing numerous factors, but this simplified approach only needs two candles before the current one. Here's how it works: we use the high and low of the candle two periods back, and the open and close (body) of the previous candle. If the previous candle's body sits within the high-low range of the two-candle-back formation, we can expect price expansion. The beauty of this method is that we don't care whether the price is bullish or bearish - we simply expect expansion to occur. Think of it like a compressed spring: when price gets squeezed within a previous range, it often seeks to break out in either direction. We're not predicting the direction, just the likelihood of significant movement. Still on Gold, I randomly selected all inside candles on the Daily timeframe. Remember, the purpose is only to expect expansion, not direction. If you want to use this for directional bias, make sure you apply the additional analysis required. Remember, there are no guarantees in trading, but this method provides valuable insight into potential market expansion. Advanced Combinations for Enhanced Analysis Combining Methods 1 and 2 creates our most accessible approach since you only need two candles. When both the opening price and mid-point from two candles ago indicate bullish conditions, we can expect the current candle to follow an OLHC bullish pattern. You can see the 3 examples I've provided in the image, and all of these are applicable across all timeframes, both daily and 4-hour. Combining all three methods offers a more sophisticated analysis, particularly useful for anticipating market reversals. This involves marking the current and previous opening prices, comparing mid-levels from the last two candles, and identifying the high/low range from two to three candles back. Now I'm adding Inside Candles from 2-3 periods back (My personal rule is maximum 3 candles before the current candle, or this analysis will lead to analysis paralysis). The Bullish and Bearish Rules Bullish Rule 1: Opening price above the previous opening price Mid-level of the previous candle above the mid-level of the previous candle before that. Inside candle formation (optional) Bearish Rule 1: Opening price below the previous opening price Mid-level of the previous candle below the mid-level of the previous candle before that. Inside candle formation (optional) The Secret Sauce: Timeframe Harmony Here's where the "devil is in the details" comes into play. You might find perfect bullish conditions on your chart, but the market still reverses. The secret lies in using this method on Daily and 4-hour timeframes simultaneously. Simply understand it from the chart. Simply understand it from the chart. If Rule 1 conditions are met on the daily chart, they must also align on the 4-hour chart. When the 4-hour contradicts the daily, follow the 4-hour signal as it might indicate a "sell on strength" or "buy on weakness" scenario. The formula is simple: [Daily Rule 1] must align with [4-Hour Rule 1] I've never tested this on 1-hour charts because the Daily and 4-hour combination provides sufficient accuracy for my trading approach. Enhanced Rules for Precision Rule 2 makes the inside candle formation mandatory rather than optional. Sometimes you'll encounter mixed signals where the mid-level suggests one direction while the opening price suggests another. The solution? Drop down to a lower timeframe for additional confirmation. I don't recommend using this method below the 4-hour timeframe, but you can certainly apply it to Monthly or Weekly charts for long-term bias determination. The key is analyzing both Daily AND 4-hour timeframes together, not just one or the other. When timeframes conflict, often just one key level provides the confirmation you need - typically a previous Monthly or Weekly high or low. Final Thoughts Pure price action mastery isn't about having the most sophisticated setup or the most indicators on your chart. It's about understanding the fundamental relationship between opening prices, mid-levels, and candle formations across meaningful timeframes. This approach has served me well because it cuts through market noise and focuses on what price is actually telling us. Start with these three methods, practice identifying the patterns, and gradually build your confidence in reading pure price action. Remember, consistent profitability comes from mastering simple, reliable methods rather than chasing complex strategies. Keep practicing, stay disciplined, and let price action guide your trading decisions. Good Luck! :)
Is It Possible to Predict Market Direction with Certainty?

Someone asked me about predicting market movements with certainty. In response to a question about detecting large orders and forecasting market direction, let’s explore how markets truly operate and how to grow as a trader. The Nature of Market Movement Markets move through collective behavior, not individual orders. Even when sentiment indicators show a near 50:50 split between short/long positions, markets can still trend strongly in one direction. Why? Because market movement depends on: The aggressiveness of orders (market orders vs. limit orders) Timing of trade execution Position sizes and their distribution Psychological factors affecting mass behavior Example: Imagine BTCUSD with apparently balanced sentiment. Yet, if long positions are primarily passive limit orders while shorts are aggressive market orders with tight stops, the price could trend down sharply despite the "balanced" ratio. The Illusion of Certainty There is no way to predict market direction with certainty. The market comprises millions of participants with: Different analysis methods Various timeframes (scalpers to long-term investors) Diverse motivations (hedging, speculation, investment) Unique reactions to the same news Real-world Example: During major news events like FOMC meetings, you'll often see prices swing violently in both directions. Why? Because even with the same information, traders interpret and react differently based on their: Portfolio needs Risk tolerance Trading timeframe Overall market view Building Better Trading Habits Instead of seeking certainty, focus on developing good trading habits: 1. Risk Management First Use proper position sizing (never risk more than 1-2% per trade) Set stops based on technical levels, not arbitrary numbers Example: If trading support/resistance, place stops beyond the next significant level, not just at round numbers 2. Asymmetric Returns Aim for trades where potential profit exceeds potential loss Target 1:2 risk-reward at minimum Example: If risking $100, your minimum target should be $200 profit 3. Consistency in Strategy - Stick to your trading plan even when other strategies look attractive - Document all trades and review regularly - Example: Keep a trading journal with setup, entry, exit, and lessons learned 4. Building Good Habits Start each day with market analysis Review major news and potential impact Set clear entry/exit rules before trading Regular review of trading performance Example Schedule: - 8:00 AM: Market overview - 8:30 AM: Review potential setups - 9:00 AM: Check for news events - 4:00 PM: End-of-day review Common Pitfalls to Avoid 1. Strategy Hopping Switching strategies frequently based on recent performance Following multiple traders with different approaches Solution: Commit to one approach for at least 3 months 2. Overtrading Taking trades out of boredom or FOMO Solution: Set daily/weekly trade limits 3. Revenge Trading Trying to recover losses quickly Solution: Take a break after losses, review what went wrong Remember: The market doesn't care about what you want. It moves based on collective action, not individual desires. Focus on adapting to market conditions rather than trying to predict them. Your success in trading isn't determined by how much you know, but by how well you apply what you know through consistent, disciplined habits.
Awal Terjunnya Harga Emas atau Awal ATH Baru?

Analisa saya sebelumnya menyebutkan bahwa perkiraan saya pada harga XAUUSD adalah kenaikannya sampai pada target terderkatnya di 2426.530, kemudian pada Old High yang kini sudah di break oleh harga dan menjadi high baru atau ATH baru pada harga emas. Kali ini, Emas sudah memberikan penolakan harga yang cukup kuat dengan dibuktikan oleh +FVG yang tidak direspect oleh harga dan membuatnya menjadi IFVG. Hal ini juga pernah terjadi antara 16-23 Mei 2024. Ekspektasi saya jika ditanya "kemana harga akan pergi?", jawaban saya adalah pada target terdekatnya. Setelah itu, jika memang Premium Array meresist harga dan harga membuat low baru, maka Sell Side Liquidity terdekat yang kemungkinan besar menjadi Target harga berikutnya. Target terakhir saya pada analisa ini adalah pada Sell Side Liquidity yang terletak paling bawah pada chart. Jika anda membuka timeframe Monthly, Sell Side Liquidity tersebut adalah Low dari FVG yang kemungkinan akan dijadikan sebagai level entry para institusi keuangan internasional. Dari sudut pandang Institusi Keuangan Internasional, salah satunya dari Credit Agricole, masih sama seperti yang saya sampaikan di ide sebelumnya, Emas masih jadi primadona karena Forex sedang tidak baik-baik saja menurut mereka (holding time mereka mungkin lebih dari 1 bulan karena dana yang mereka punya hingga jutaan dollar). Kesimpulan pada analisa kali ini adalah Ekspektasi penurunan harga XAUUSD hingga ke Target pertama di 2380 (50% of the range). Untuk penurunan lebih jauh, saya masih menunggu data yang muncul pada beberapa hari berikutnya. Terimakasih telah membaca ide yang saya publish, jika ada pertanyaan boleh langsung tanya di komentar dan semoga informasi ini dapat berguna untuk anda. 😁 Selamat trading dan semoga beruntung!
Disclaimer
Any content and materials included in Sahmeto's website and official communication channels are a compilation of personal opinions and analyses and are not binding. They do not constitute any recommendation for buying, selling, entering or exiting the stock market and cryptocurrency market. Also, all news and analyses included in the website and channels are merely republished information from official and unofficial domestic and foreign sources, and it is obvious that users of the said content are responsible for following up and ensuring the authenticity and accuracy of the materials. Therefore, while disclaiming responsibility, it is declared that the responsibility for any decision-making, action, and potential profit and loss in the capital market and cryptocurrency market lies with the trader.