
Zola_Hello
@t_Zola_Hello

What symbols does the trader recommend buying?
Purchase History
پیام های تریدر
Filter
Signal Type
Zola_Hello
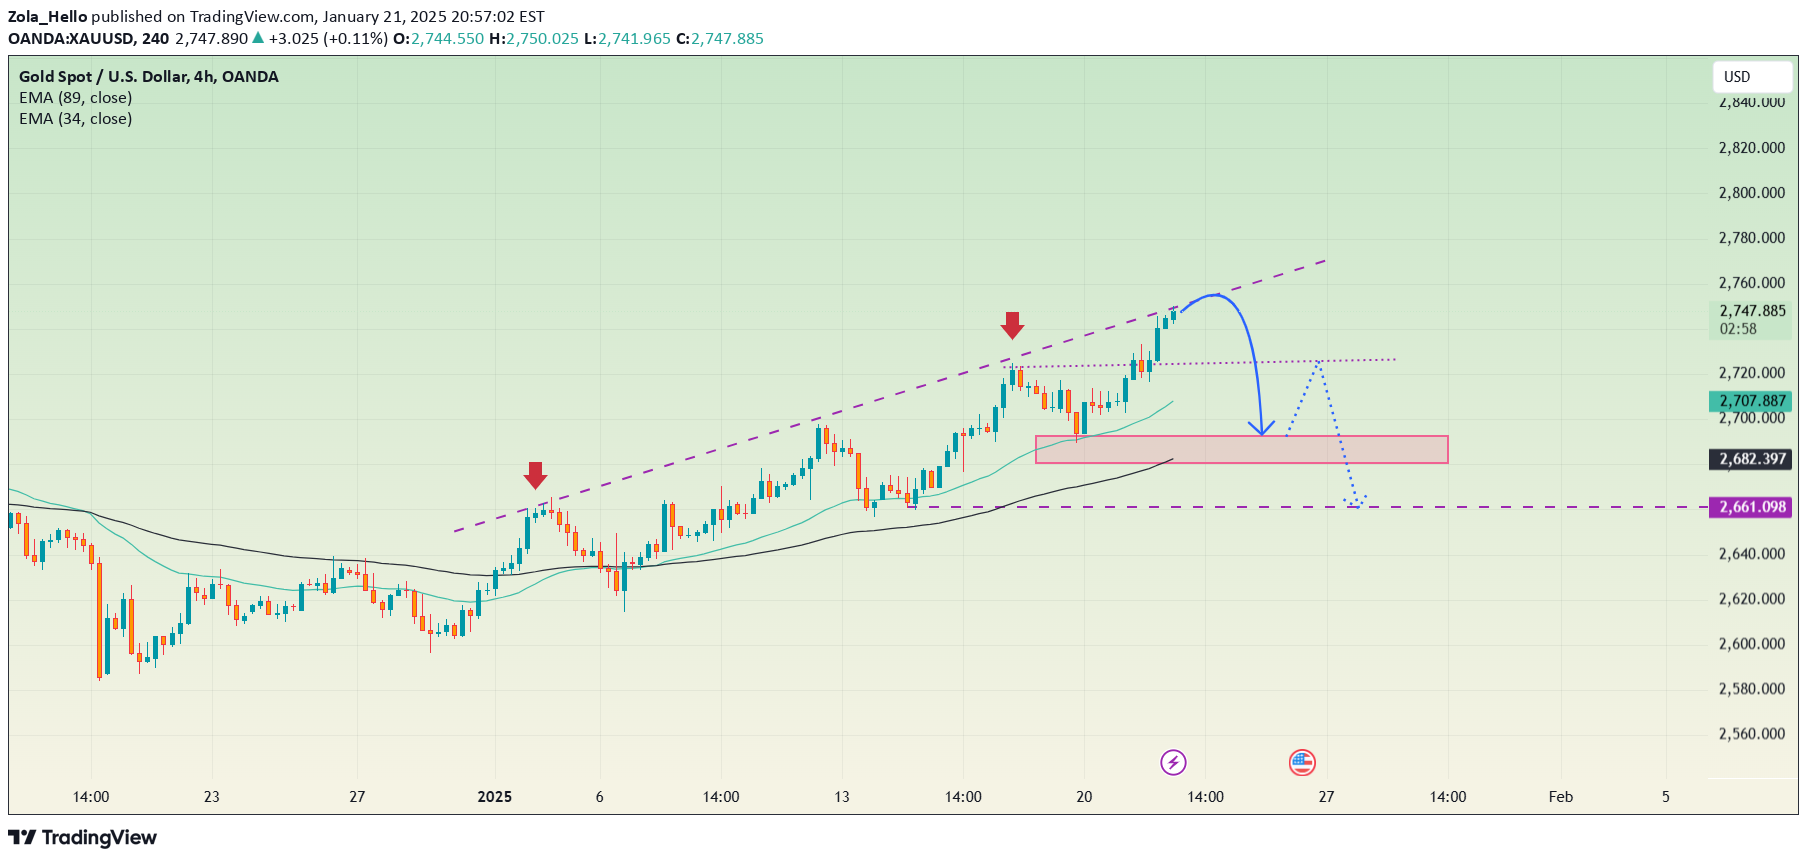
Gold (XAU/USD) is hovering around $2,748 after hitting its highest level since early November. This consolidation resembles a "pause" as gold gathers strength to decide its next direction. Comments on tariffs from President Trump and expectations of further Fed rate cuts are keeping gold's bullish sentiment intact. But does gold have enough momentum to break higher?On the 4-hour chart, gold remains in an uptrend with dynamic support levels at EMA 34 ($2,707) and EMA 89 ($2,682). Strong resistance at $2,754 is the key hurdle for gold to clear to extend its rally. On the downside, the support zone at $2,727–$2,657 may act as a launching pad for another upward move.Buy: If the price breaks above $2,754, target $2,780, with a stop-loss below $2,745.Sell: If the price drops below $2,727, target $2,682, with a stop-loss above $2,735.
Zola_Hello
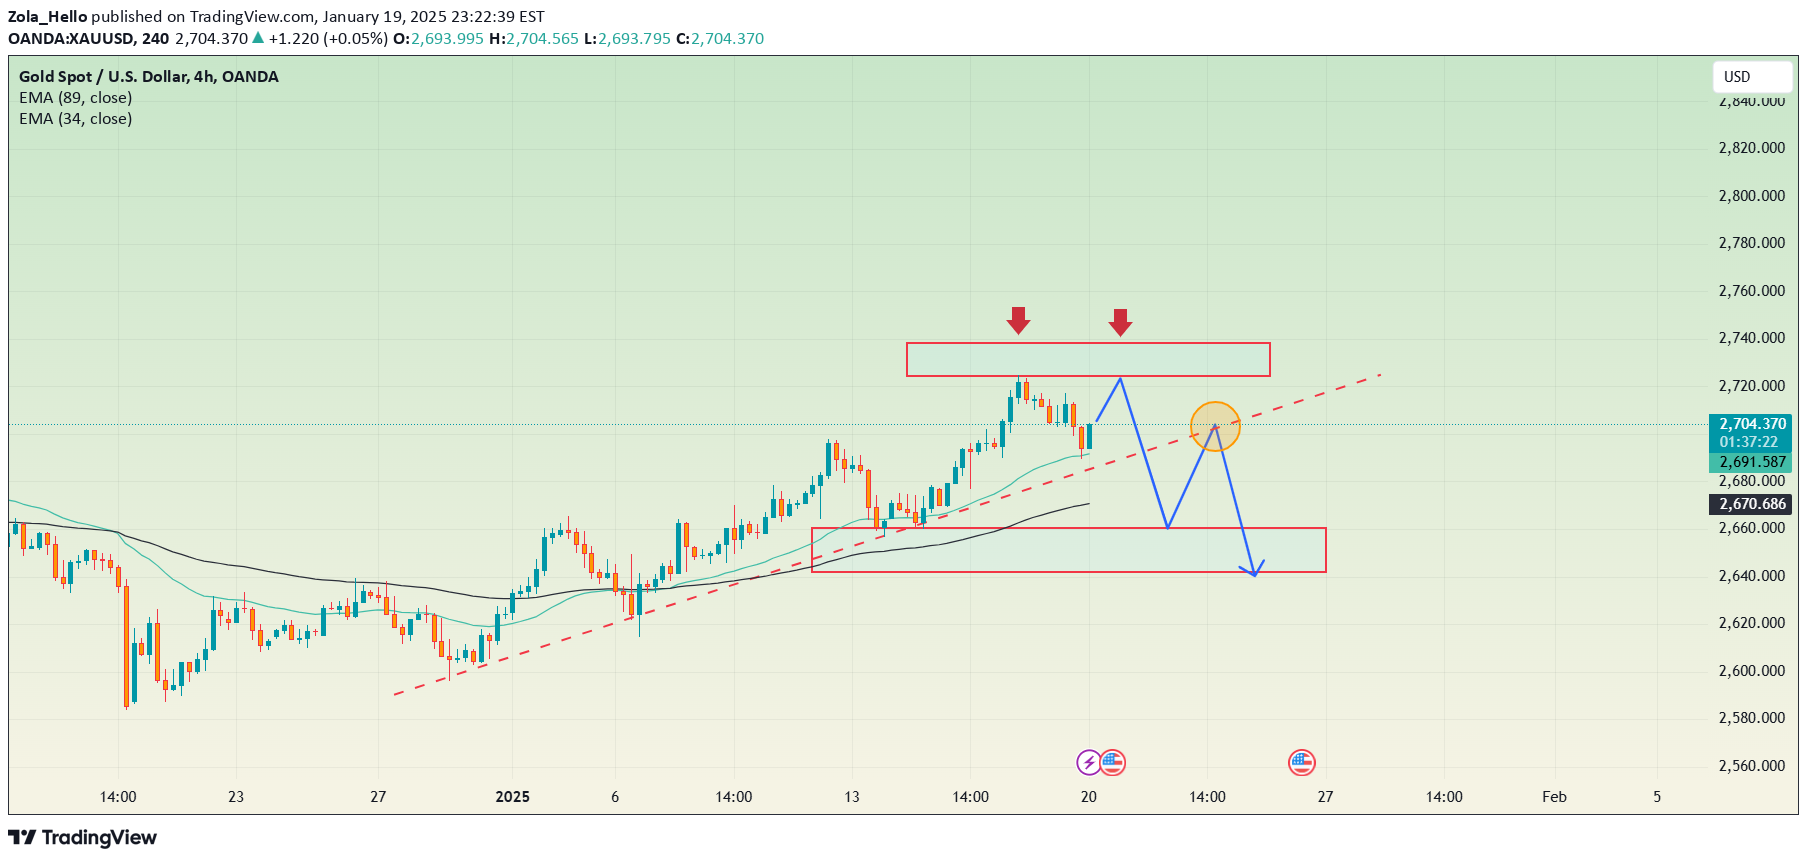
Gold (XAU/USD) continues to retreat, pulling back from the monthly high of $2,725 due to heightened profit-taking pressure from traders ahead of the U.S. presidential inauguration. Market caution during the Martin Luther King Jr. holiday also contributes to the bearish sentiment.On the 4-hour chart, the price hovers near the key support level of $2,691, with downward pressure intensifying as it struggles to break through the major resistance at $2,723.689. The EMA 34 ($2,691.538) and EMA 89 ($2,670.667) provide temporary support, but selling momentum remains dominant.Integrated Strategy:Sell: If the price approaches the $2,723.689 resistance, target $2,670 and potentially $2,646.702, with a stop-loss above $2,730.Buy: If the $2,646.702 support holds, consider long positions with targets at $2,691 and $2,723.Political factors and profit-taking pressures may sustain volatility or deepen the decline. Watch critical levels closely to adjust your trading positions accordingly.
Zola_Hello
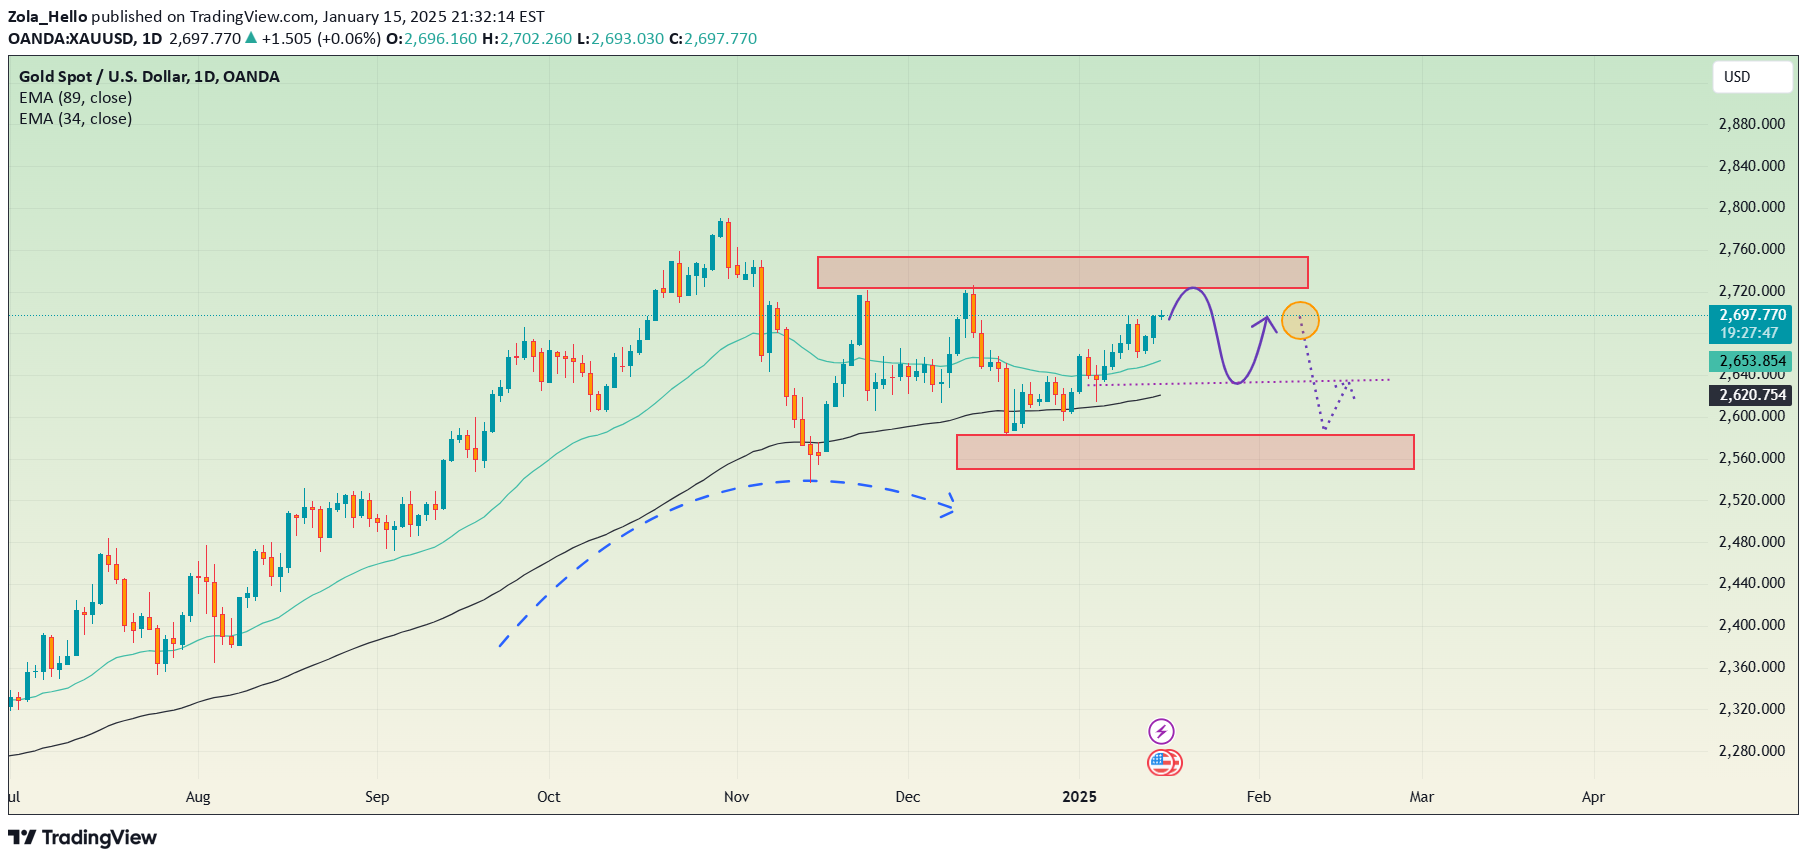
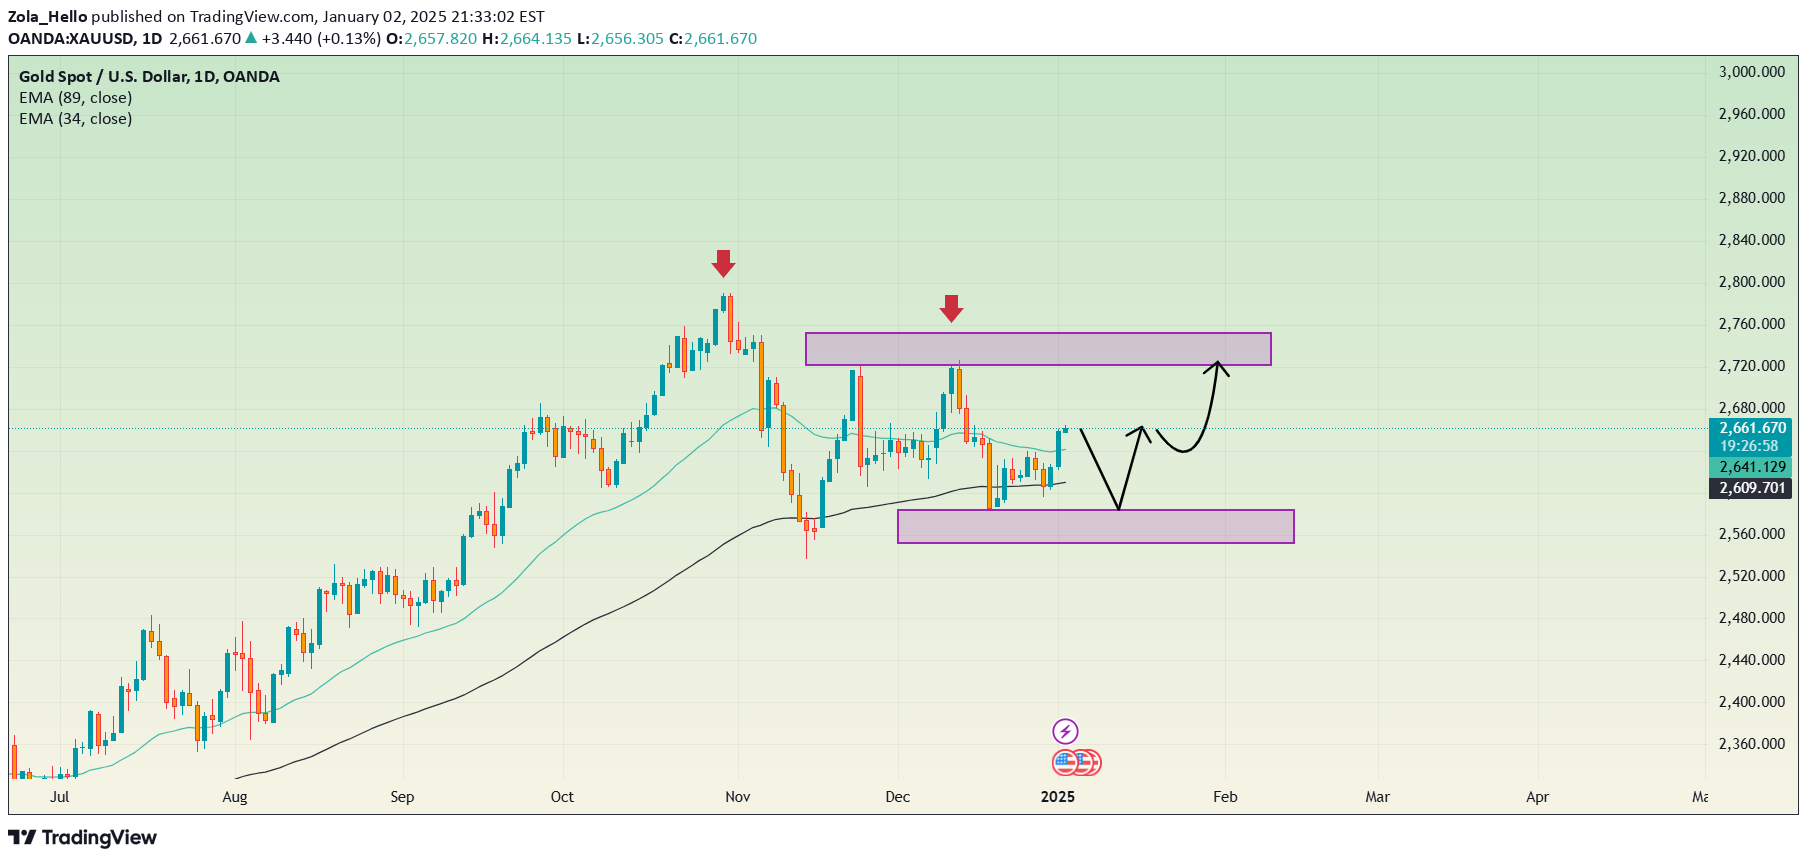
XAU/USD is fluctuating around the $2,700 level, showing consolidation as moderate U.S. inflation data supports expectations for further Fed rate cuts. On the daily chart, the price is approaching strong resistance at $2,723.428, but bullish momentum is slowing due to buyer hesitation.If the price fails to sustain above $2,700, it is likely to pull back to test key support at $2,620 - $2,583.466. A break below this zone could push the price into a deeper bearish trend.Trading Strategy:Short-term Sell: As the price approaches the $2,723.428 zone, target $2,620 and $2,583.466. Set a stop-loss above $2,730.Monitor Support Zone: If the price holds above $2,620, consider short-term buying with a target back to $2,700.While bulls await clear signals above $2,700, caution around bond yields and Fed policy may exert further bearish pressure in the short term. Watch price action near $2,723 for precise trading decisions.
Zola_Hello
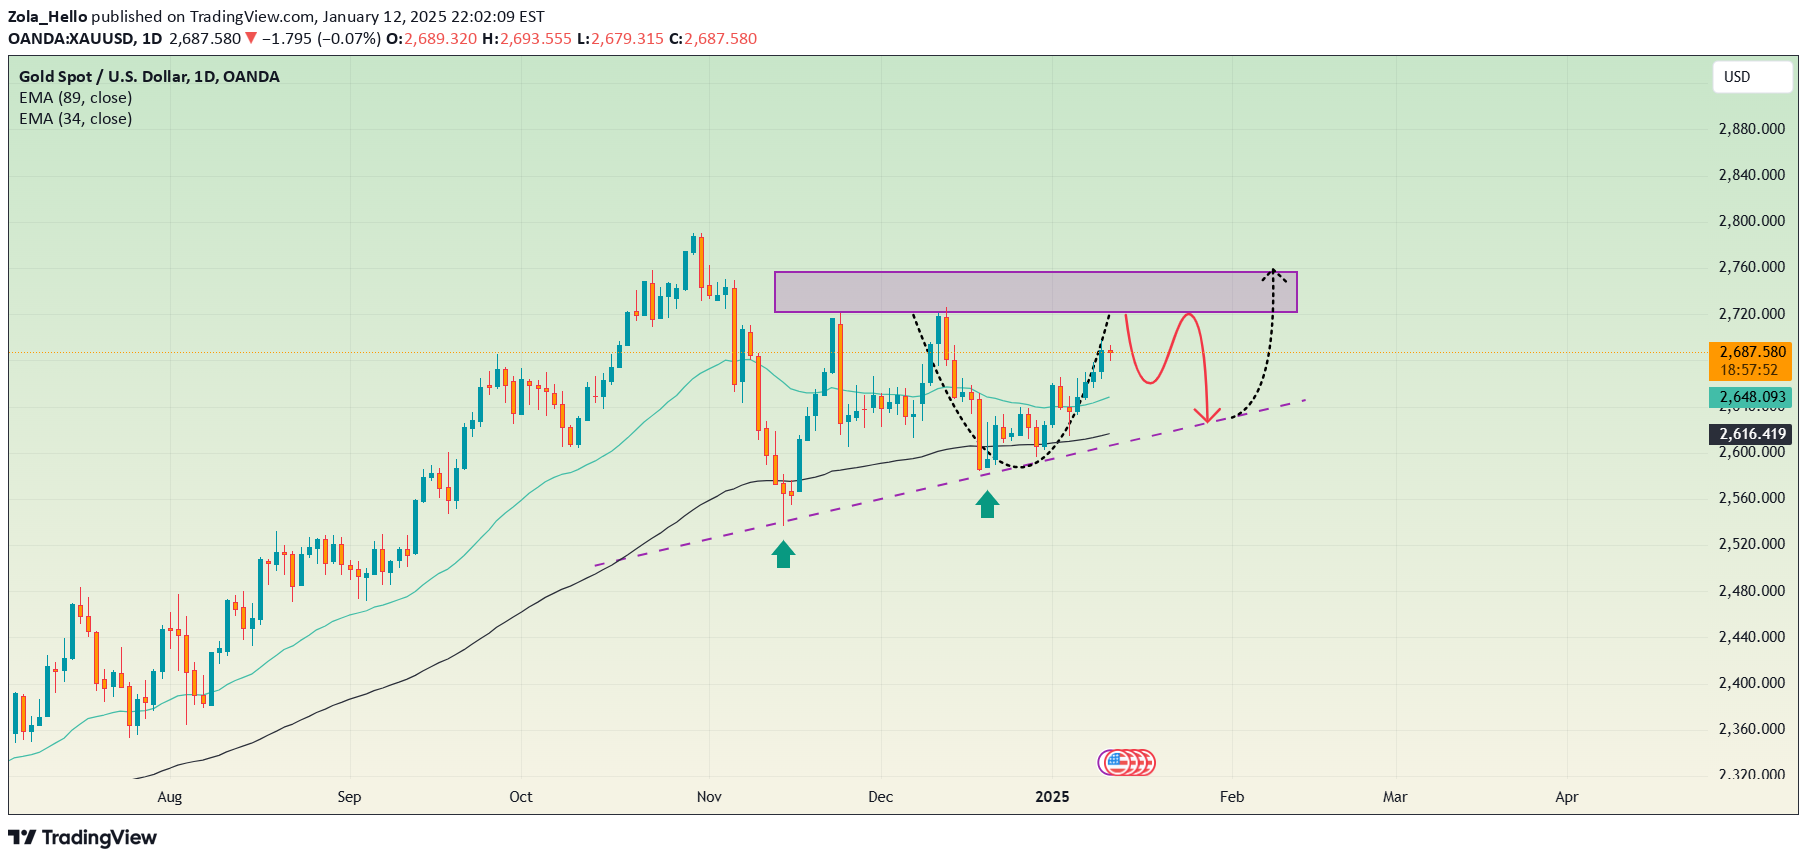
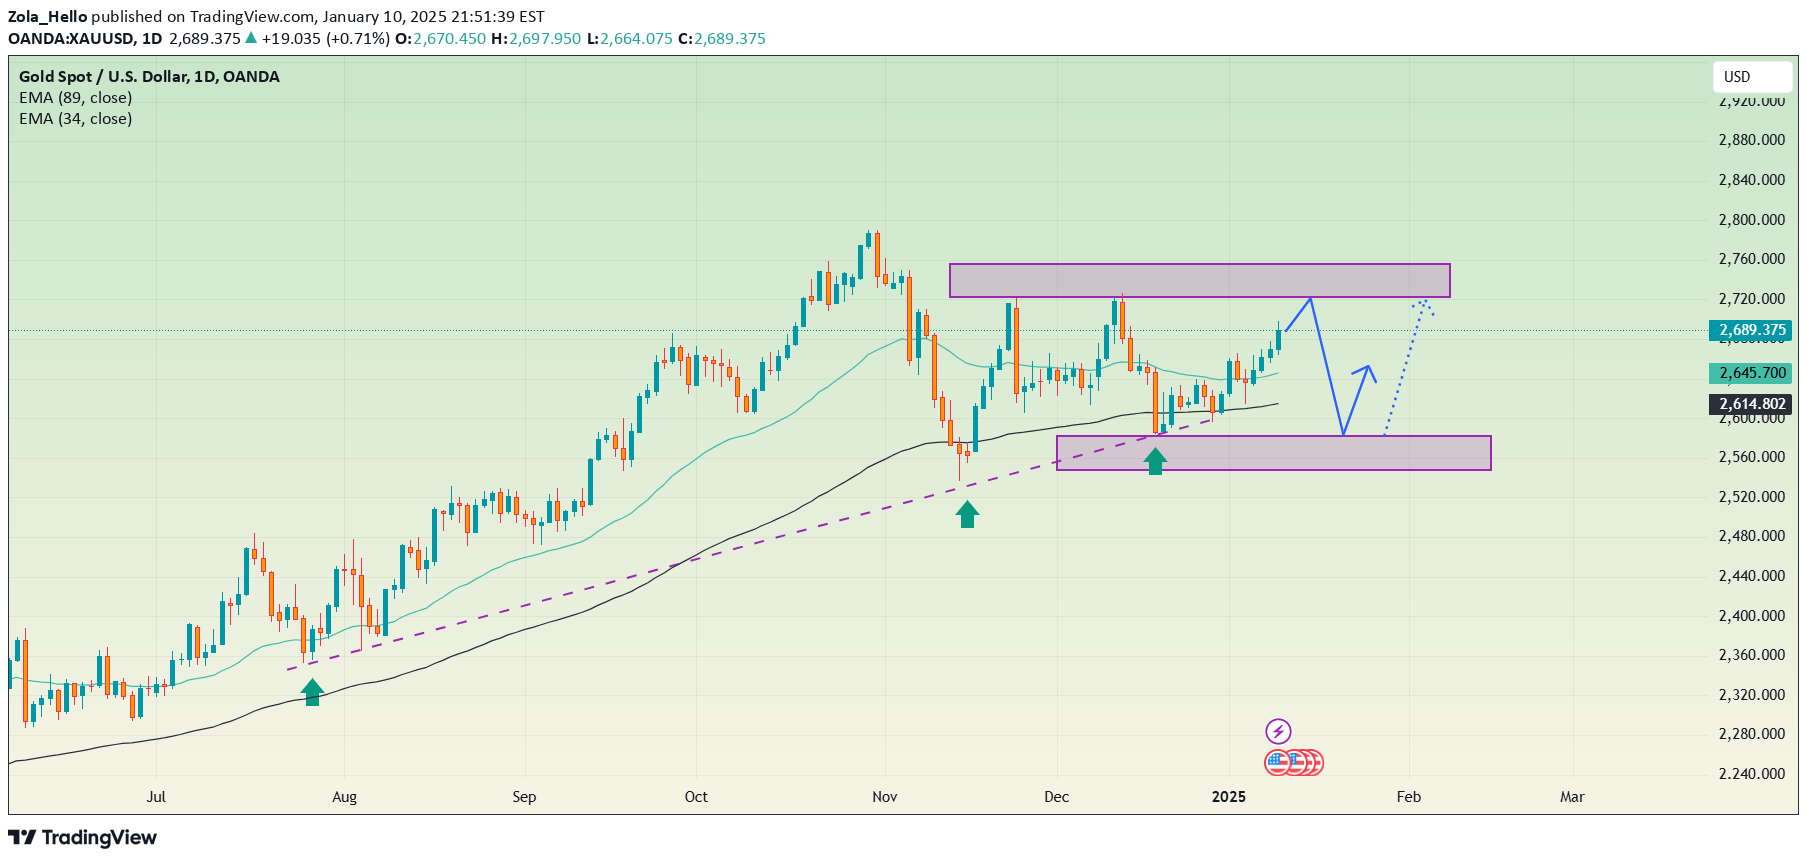
Gold prices hover below $2,700, showing signs of exhaustion as the bulls face strong resistance in the $2,750-$2,761 range. The daily chart reflects a sideway downtrend, with the price locked in a tug-of-war between buyers and sellers. The ascending trendline and key support at $2,623 act as the last bastions for the bulls, while the 34 and 89 EMA stand firm as dynamic barriers.Despite the strength of the U.S. dollar, driven by hawkish sentiment and risk-on appetite, geopolitical uncertainties and safe-haven demand keep gold resilient. However, the upward momentum has waned, suggesting limited room for a breakout above $2,700 without new catalysts.If the price breaks below $2,623, it could accelerate a decline towards $2,600 or lower, reinforcing the bearish sentiment. Conversely, if buyers regain control and push above $2,700, a retest of $2,761 might spark renewed buying interest.This market phase reflects cautious optimism tempered by underlying risks, requiring traders to closely monitor dollar strength and political developments for cues on the next directional move.
Zola_Hello
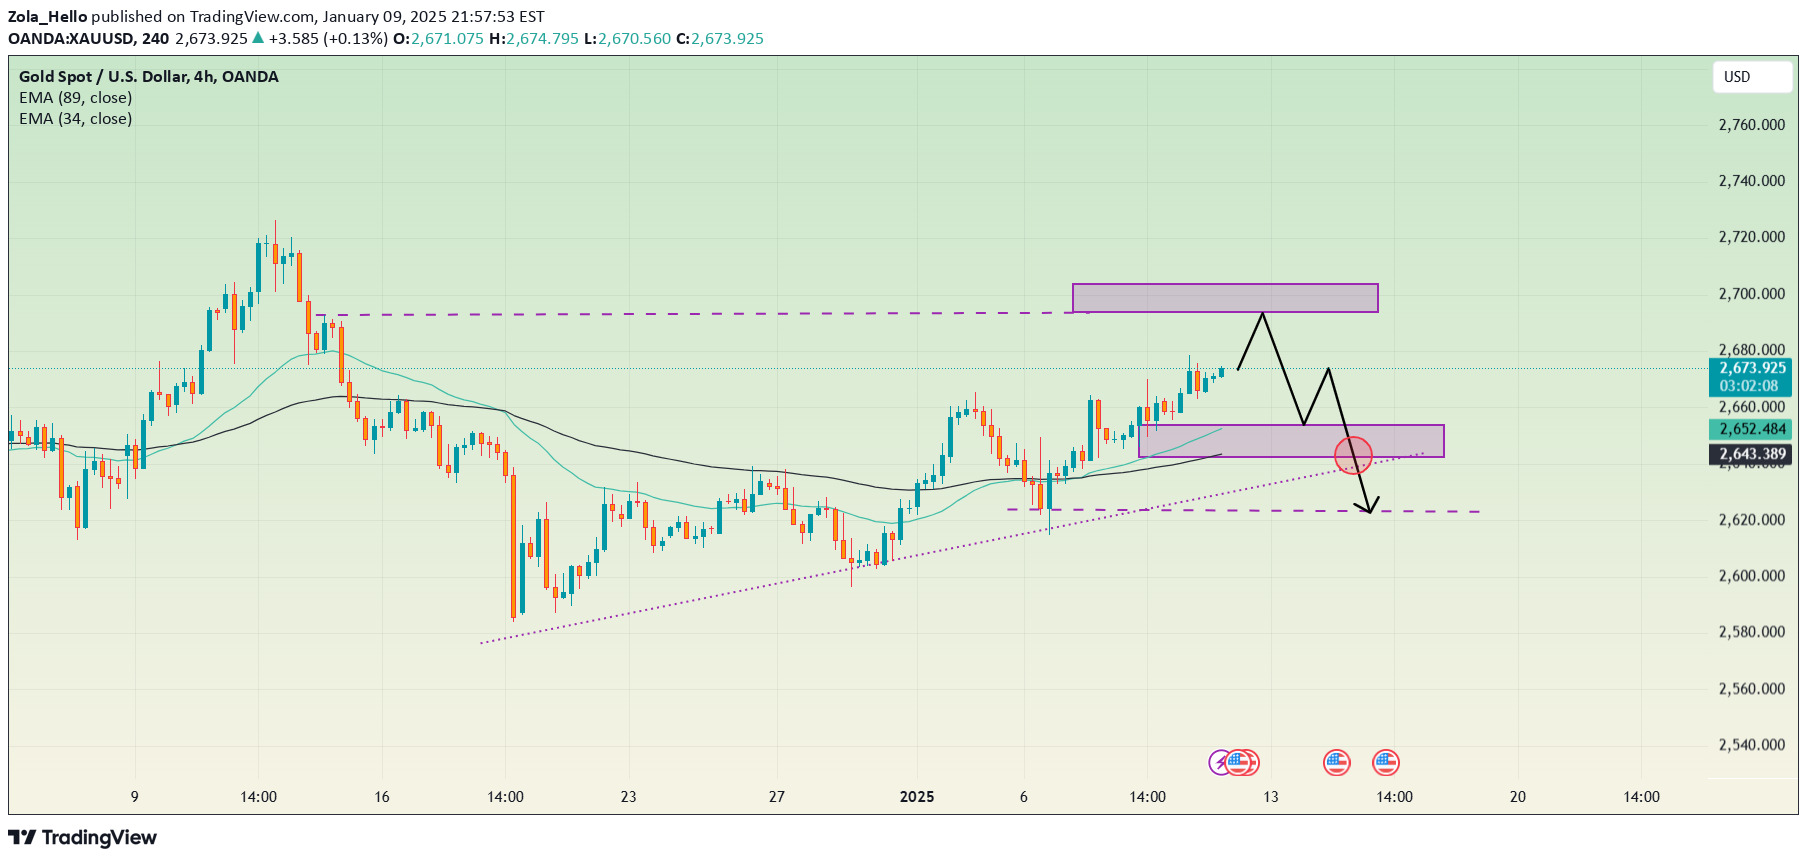
Gold is inching closer to the $2,700 resistance level, like a warrior venturing into a final battle. After dipping to $2,660 in response to strong U.S. jobs data, XAU/USD quickly rebounded, but the $2,700–$2,723 zone remains a significant "fortress" to conquer. The daily chart reveals the EMA 34 and EMA 89 acting as "shields," protecting the uptrend and keeping prices above the critical $2,645 support zone.Market sentiment is torn: on one side, safe-haven demand pushes gold higher; on the other, the strength of the U.S. dollar and rising Treasury yields dim the shine of the precious metal. If gold breaks above $2,723, it could soar to $2,750 – a promising new peak. Conversely, if it falls below $2,645, selling pressure could drag prices down to the $2,586 zone, where buyers might re-enter the market.The current market resembles a tense chessboard, where every move carries both opportunity and risk. Will gold break through the limits and extend its rally, or succumb to the whirlpool of selling pressure? The answer lies in the upcoming NFP data and the moves of cautious investors.
Zola_Hello
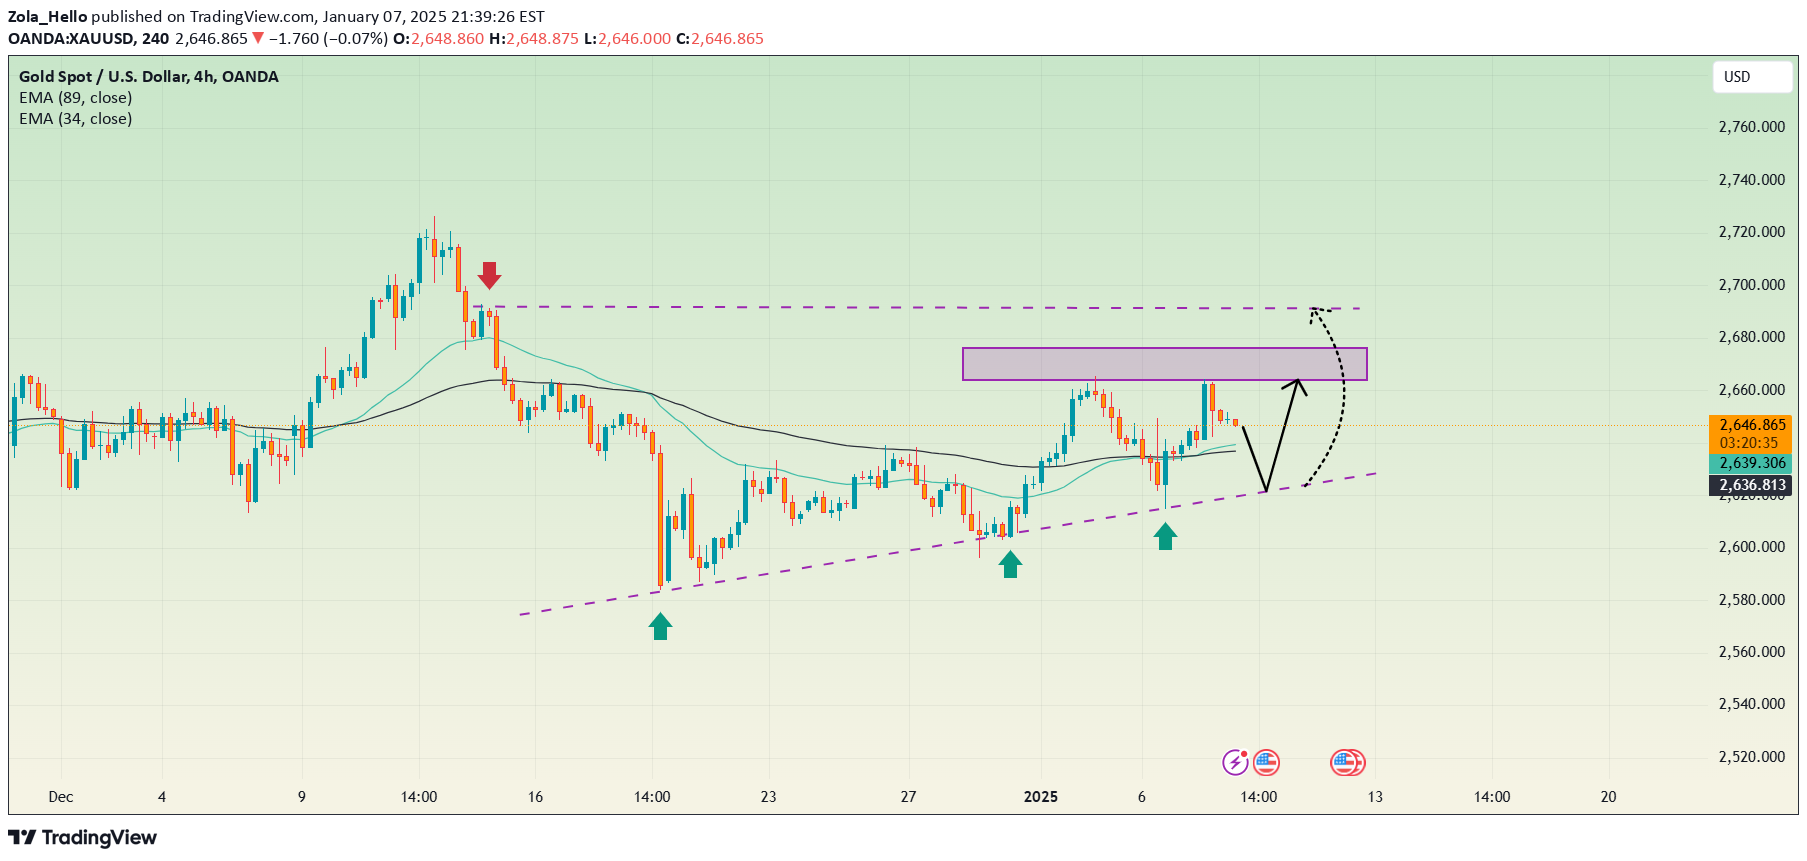
Gold is treading cautiously around $2,674, just a breath away from the four-week peak at $2,678. The 4-hour chart reveals a tense battle at the resistance zone of $2,690-$2,700, a level gold must breach to continue its upward conquest. The EMA 34 and 89 act as loyal companions, supporting the price within the upward trend yet underscoring its fragility.Behind the golden shine lies the looming shadow of a strong USD and the NFP data awaiting its verdict. If gold fails to break $2,690, a steep slide toward the support zones of $2,643, or even $2,521, could follow. However, if it conquers the resistance, gold may soar to $2,718 and beyond.The market now resembles a chessboard filled with mysteries, where every move requires calculated precision. Will gold ascend to the throne or retreat to its starting point? The answer lies in upcoming economic data and the sentiment of those placing their bets.
Zola_Hello
Gold is anchored at $2,647, standing resilient like a warrior against opposing winds. The EMA 34 and 89 intertwine as a shield, guarding the $2,619 level, while the $2,663 zone rises like an unyielding fortress.Geopolitical risks and the shadow of Trump’s tariffs ignite hope for buyers, yet U.S. bond yields scatter thorns along the path upward. The market holds its breath, awaiting the Fed minutes, where words may decide gold’s fate.A breakout above $2,663 could send gold soaring like an eagle to $2,700. Traders must tread carefully, navigating the fine line between opportunity and risk.
Zola_Hello
XAU/USD trades near $2,660, moving sideways between key support at $2,580 - $2,590 and resistance at $2,710 - $2,720. The 34-day and 89-day EMAs provide dynamic support and resistance, maintaining the consolidation. Safe-haven demand remains strong due to ongoing tensions in the Middle East and the Russia-Ukraine conflict, supporting gold’s value.In the short term, a break above $2,720 could lead to $2,750, while a fall below $2,580 may push prices toward $2,550. Traders should monitor geopolitical events and economic data for clearer direction.
Zola_Hello

Gold is currently trading around $2,622, signaling a sideways trend before potentially moving lower. On the 4-hour chart, prices are confined within a narrow range, capped by a strong resistance zone at $2,635 - $2,640, where the EMA 89 ($2,635) acts as a key barrier. Conversely, crucial support at $2,610 - $2,615 serves as a pivotal level to limit downside risks.While the market is in an accumulation phase, pressure from expectations that the Fed will maintain a less dovish policy stance has diminished gold’s appeal. Additionally, low year-end trading volumes have resulted in narrow price movements, with cautious sentiment prevailing.In the short term, a break below $2,610 could extend the decline toward the $2,600 region or even lower. On the other hand, if XAU/USD manages to surpass the $2,635 level, the next upside target would be $2,650 - $2,660. However, this scenario remains constrained amid tightening Fed policy expectations and rising bond yields. Traders should closely monitor signals from U.S. economic data to determine the next drivers of gold prices.
Zola_Hello

Gold prices are holding an upward trend on the 4-hour chart, trading around $2,626. The ascending trendline provides strong support, complemented by EMA 34 ($2,624) and EMA 89 ($2,638), which add momentum for further gains. The key resistance zone at $2,638 - $2,640 poses a significant hurdle for the price to overcome to sustain the bullish momentum.The current uptrend is supported by geopolitical tensions and safe-haven demand, but buying pressure remains subdued due to the lack of commitment from buyers amidst the Fed's hawkish stance. The divergence between expectations for Fed tightening and global instability pressures has kept gold trading within a narrow range.If the price breaks through the $2,640 resistance zone, the next target would be $2,689, marking a fresh high. However, failure to break above could lead to a slight correction towards the support level near $2,617 before seeking new bullish momentum. In a bearish scenario, the price may test the broader support zone around $2,600.
Disclaimer
Any content and materials included in Sahmeto's website and official communication channels are a compilation of personal opinions and analyses and are not binding. They do not constitute any recommendation for buying, selling, entering or exiting the stock market and cryptocurrency market. Also, all news and analyses included in the website and channels are merely republished information from official and unofficial domestic and foreign sources, and it is obvious that users of the said content are responsible for following up and ensuring the authenticity and accuracy of the materials. Therefore, while disclaiming responsibility, it is declared that the responsibility for any decision-making, action, and potential profit and loss in the capital market and cryptocurrency market lies with the trader.