
Zjien13
@t_Zjien13

What symbols does the trader recommend buying?
Purchase History
پیام های تریدر
Filter
Zjien13
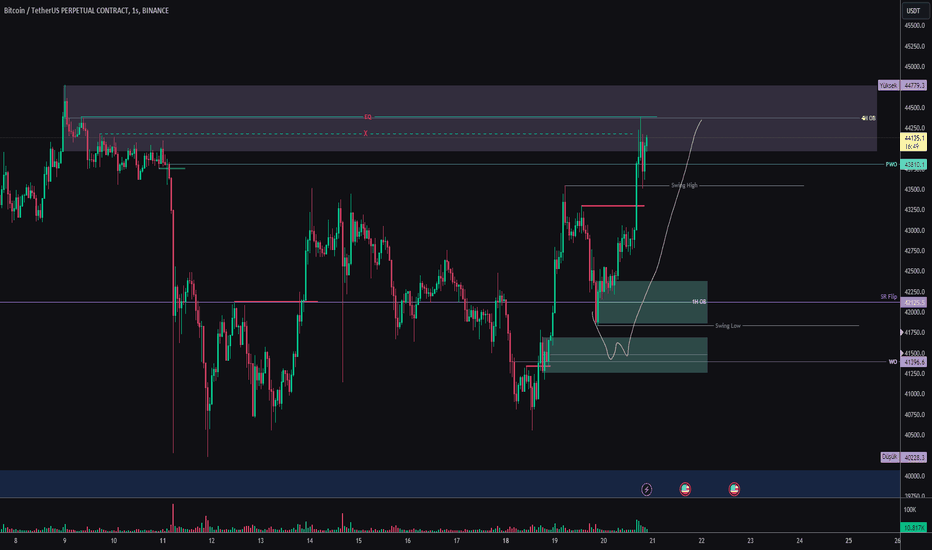
BTCUSDT.P 2 HOUR PA

There is still bullish price action on the daily chart unless the $40230 level is lost. On the 1-hour chart, the market direction is bearish. In the previous chart, I said that the price would rise above $43850 and go to $46000. I'm adding the previous chart to the description. First, it was rejected at $43850, left equal high there, and then did not close below the middle of the range, but found support in the optimal trade entry zone and was priced up to $46000 over this zone. Coming to the question of what will happen now, the market will be shaped according to the ETF news. Within the daily price movement, the 1-hour chart is actually included in the internal market structure. By following the order flow in this way, transactions in the direction of the trend will be healthier. I think the price will move horizontally for a while in the red box, because there is no liquidity left on the 1-hour chart that I can see at the moment. I think that by creating liquidity in this box and acting according to that liquidity again, the trend direction will be determined in the short medium term (3-4 months) with the ETF news. Additionally, I do not include the wicks of large wick candles in the 1 hour period. Instead, I base it on the swing created after this wick candle arrived.
Zjien13
Bitcoin BTCUSDT.P 1 Hour PA

There are two scenarios I'm considering. If it gets rejected in the 4-hour supply zone and the price retreats to the range low zone, it will become bullish again. 46K to go to. Frankly, the decline scenario is more meaningful in this case. Its upward direction on the hourly brings a retest to the 4-hour supply area. Since the chart is the same chart, the time frames naturally move in relation to each other. Larger time frames are always more accurate guidance. While the price was withdrawing, it always fell by taking liquidity, but it did not take the swing low liquidity. When such situations occur, sharp declines can usually occur. Please do not forget to manage your risk.
Zjien13
BTCUSDT.P 1 Hour PA

After the range deviation, it is highly likely that the targets will be range mid and then range low. If it deviates below the range, it would be better if it reaches 38600.
Zjien13
BTCUSDT.P PA

In this way, the deviation results of the movement occurring within the range can be processed.
Zjien13
BTCUSDT.P 1 Hour PA
Frankly, I was expecting a little more withdrawal, but it went away before it came, and the liquidity at 40500 seems to be sufficient before it drops to 40200. It is necessary to watch the price whether it can rise to the $45k level or whether there will be a retreat. Actually, I was expecting an earlier retest in the middle of the daily orderblock at 44k, but it has reached now, but the direction seems to have turned bullish again in the short term. Identifying the liquidity will help you understand the price more easily. If the price can't get over 45k and starts showing bearish signs, I'll start thinking about 38600s again.
Zjien13
BTCUSDT.P 1 HOUR PA

If you manage to read the market structure correctly, you will see that liquidity is made between swing low and swing high. The halving is approaching. I think the pullbacks will occur in the first quarter of the year and then be replaced by a nice bull. While the price was climbing up at 38600, it left an untaken liquidity zone. I still think there will be a deviation to that zone within this range. Afterwards, there will be an increase towards $42000 and depending on the reaction of the price there, I think we will see whether it will reach $32000 or not and where it will change its direction according to the price movement when it comes. This is the scenario in my mind. Of course, this scenario may change. Whatever the price shows and whatever the trend is, you need to act accordingly. You cannot try to swim against the current. Don't forget to manage your risk.Comment: The price received a weak reaction from the range eq. The weekly opening is now in the middle of the range. In such cases, the range eq works better.
Zjien13
BTCUSDT

In my opinion, daily swings are created by combining multiple time frames in this way. I plan to follow it this way unless the price rises above 44780. First of all, when 38600 cannot hold here, 33000's, if it moves in accordance with this range structure, I think it will retreat to $29000 and price will be like this until the weekly demand area. Of course, my ideas may change, but this scenario seems good for a healthy rise. From there, I think the bull will start fully.
Zjien13
BTCUSDT.P 1 Hour

If the price enters the range again, moves as I have drawn, makes another small liquidity purchase and breaks above the LTF, we can now consider the deviation part under the range. I think there will still be a retest of the 38600 Range EQ within the daily range. Do not take transactions without managing your risk.
Zjien13
BTCUSDT.P 1 Hour

Unless the arrow marked area, that is, the upper part of the range, is passed, the price will make another low. Sections marked hourly swings. Short transactions can be viewed in the form of orderflow. It is best to get confirmation in a lower time frame
Zjien13
BTCUSDT.P 1 Day

If the price reverses its direction in 1 hour, it will tend to go up to its daily OB. This may happen if it throws itself above 42500. The range on the chart is the range formed by the price movement in the first quarter of 2022. Range structures created by previous price movements over a large period of time work well. When the first pullback fails to hold around 38600, I expect it to drop to around 33000. Look for confirmation in the lower time frame in which you are trading. In this way, you can participate in the transaction with extra approval and higher RR.
Disclaimer
Any content and materials included in Sahmeto's website and official communication channels are a compilation of personal opinions and analyses and are not binding. They do not constitute any recommendation for buying, selling, entering or exiting the stock market and cryptocurrency market. Also, all news and analyses included in the website and channels are merely republished information from official and unofficial domestic and foreign sources, and it is obvious that users of the said content are responsible for following up and ensuring the authenticity and accuracy of the materials. Therefore, while disclaiming responsibility, it is declared that the responsibility for any decision-making, action, and potential profit and loss in the capital market and cryptocurrency market lies with the trader.