
Yash_Jain_1309
@t_Yash_Jain_1309

What symbols does the trader recommend buying?
Purchase History
پیام های تریدر
Filter
Yash_Jain_1309
احتمال جهش ۱۵۰ درصدی قیمت آلگوراند (ALGO) تا پایان دسامبر! آیا این فرصت تکرار میشود؟
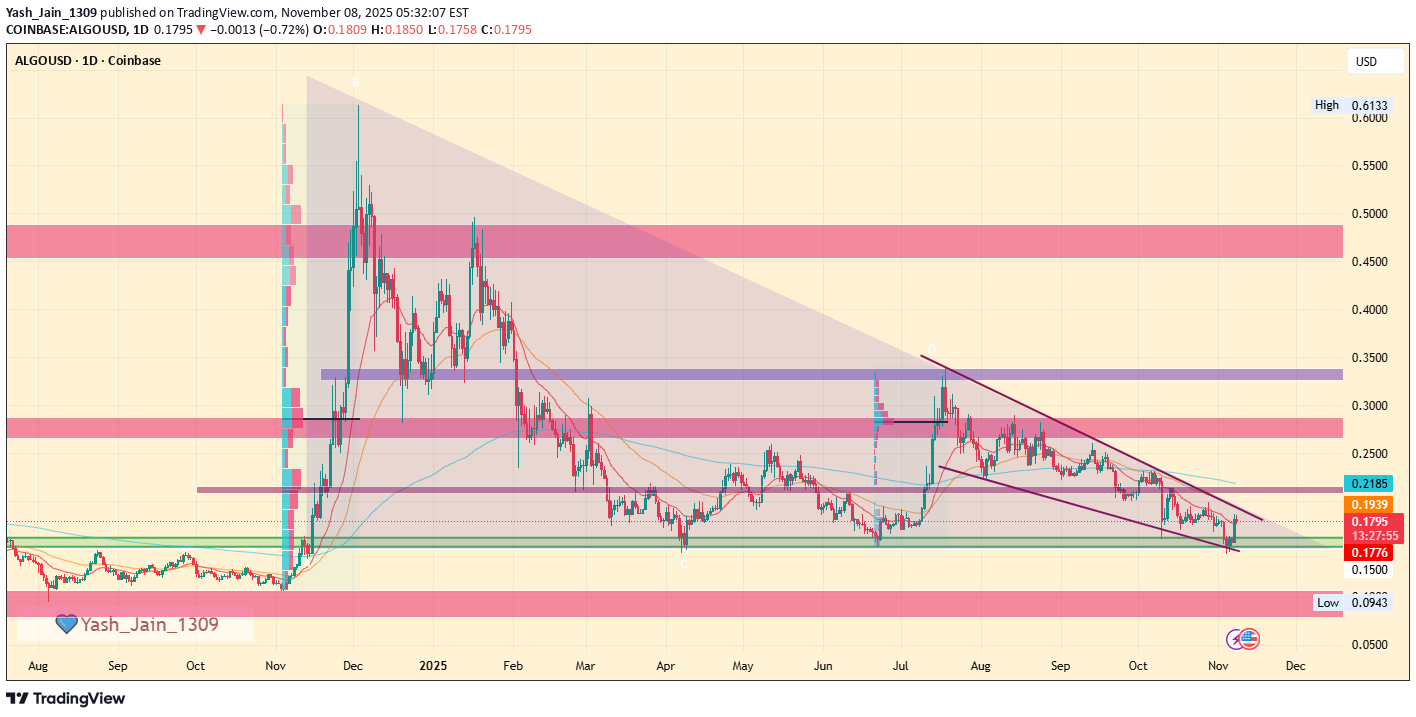
The odds suggest a high chance of a northward rally in ALGO/USD this time. Why i am saying this is because of its price action that has just revisted an key support this week that has never let down investors. So far, since the late 2024 rally, on most touch points at this foundational support, it has resulted in some decent bullish spikes; however, that momentum has decreased with increased touch points. Since this price action has resulted in a descending triangle pattern and appears to be close to breaking its upper border, a rally to break out of this perspective can't be ruled out, now that the bare minimum would yield a 150% rise. However, if momentum fails to materialize due to another major suspicion of weakening in this key demand area, then a decline followed by consolidation could occur heading into the first half of 2026, and December would close within the consolidation range below or above the key range support ALGO is currently testing. Note*: DYOR, okay, it's not financial advice. Don't come running to me crying if you take a trade on a whim. It's just my perspective.
Yash_Jain_1309
Can we see NEAR at $8 before 2025 end?
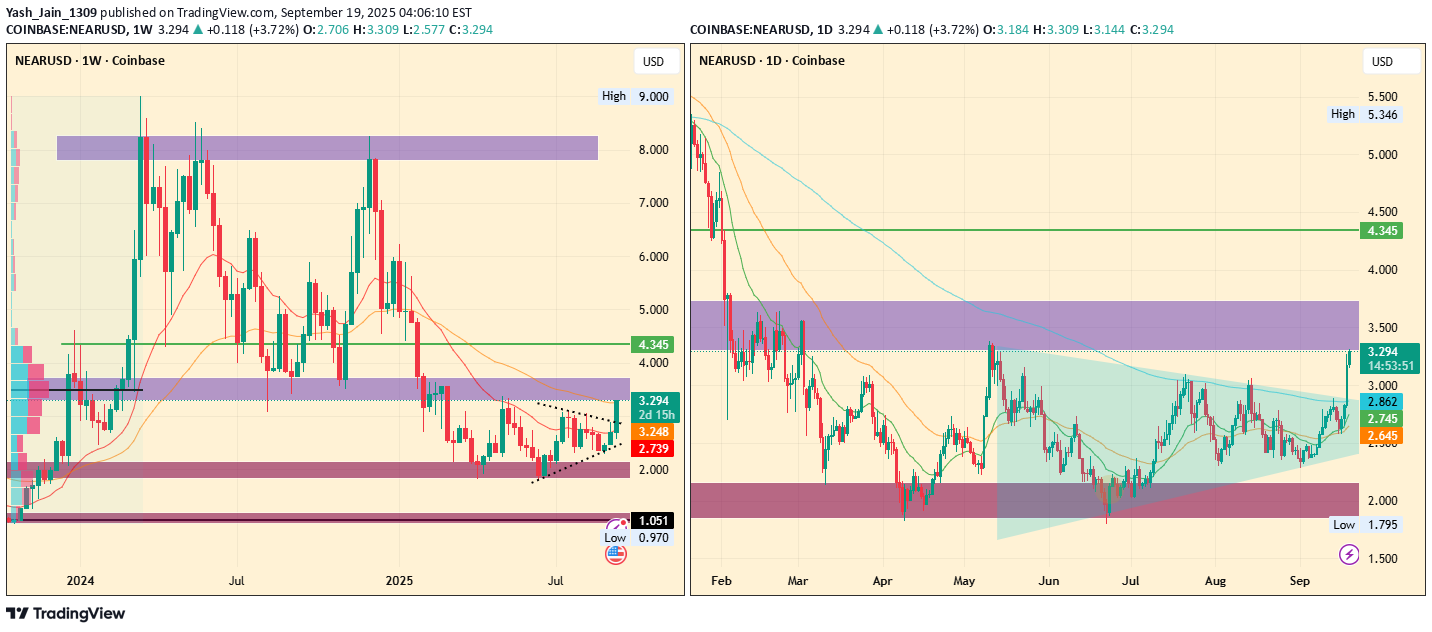
It's a blockchain for AI that's been doing a lot of work these days and pushing many things on X, making it a wild card in the AI category. This crypto saw its deepest depth in price but still held above $2, making it fundamentally strong, as it didn't mark a new low for its token, that's a big deal, you know. Now, if you see technically, I arranged two charts for you to see. One is daily, and the other is weekly. Let's talk about weekly. It reveals that a high institutional footprint marked by FRVP POC at $3.5 is very critical because it's a major supply, which was once a demand area. The good part is NEAR is riding the horse with a daily chart symmetrical triangle breakout and has been approaching this level, thinking it will flip and sustain. If this is sustained, that means if $3.5 is sustained, then we can see a rally to $8 pretty soon. I hope you get my point, guys, so if you want, you still have time before it's still cheap, don't FOMO and DYOR, it's no financial advice, just my own viewpoints.
Yash_Jain_1309
IMX headed for $1 in september but higher in Q4
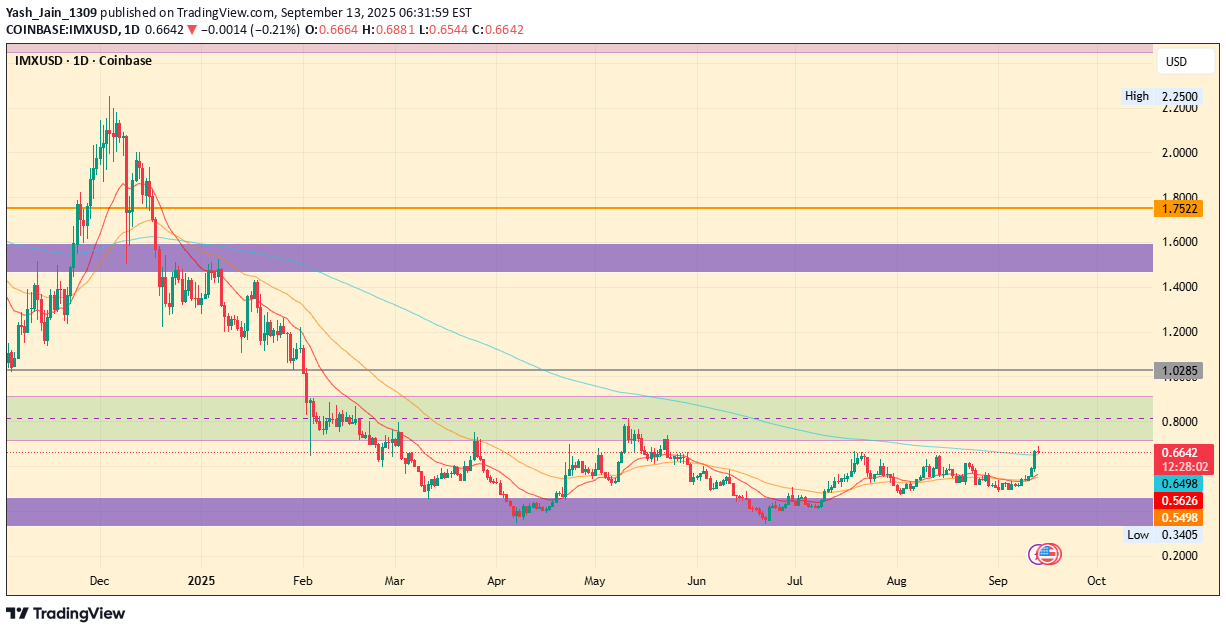
Technically, I IMX just broke key resistance and is showing strong momentum. All signs point to more upside ahead. We can see gain here upto 50%+ around $1
Yash_Jain_1309
the year-end target is still $80+ in HYPE
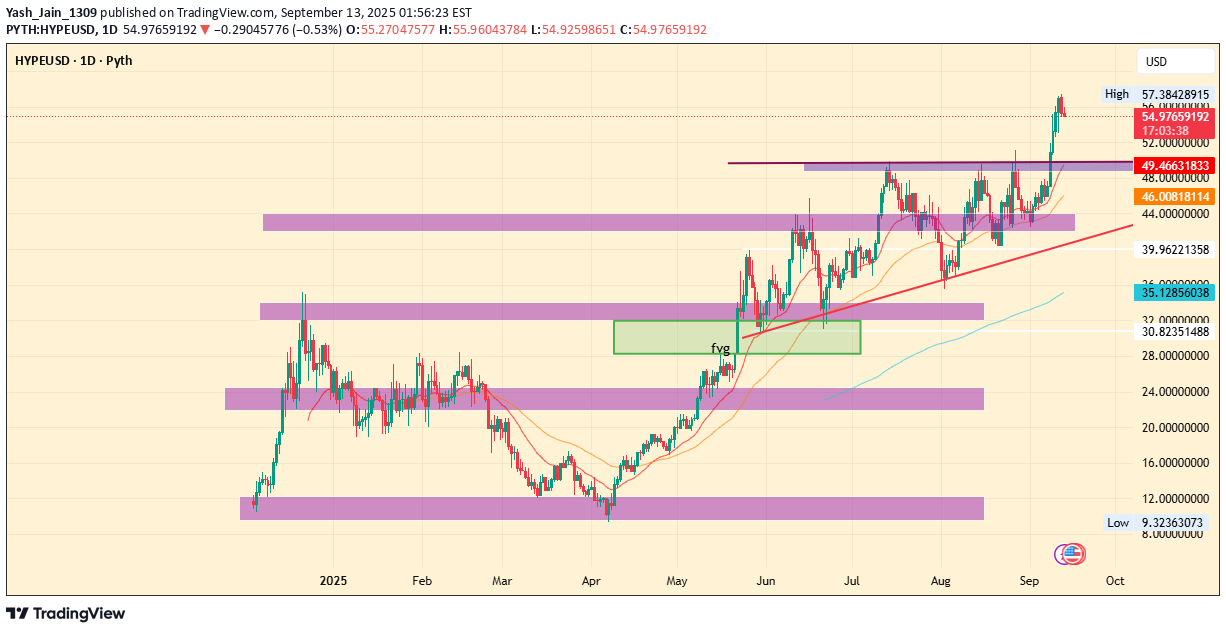
Just 5 months ago, HYPE was trading under $10, and it has now reached its ATH $57 this September. It's not just a random rally because the underlying demand is real and steady, just like BNB. Why do I say so? Because last I checked, DUNE analytics, the sharp acceleration in total users and cumulative trades taken is making a one-sided mountain. Its built-in blockchain has low fees centered around HyperBFT and HyperEVM; its combined power boosts traders' interest. HYPE has benefited mostly one of the strongest perpetual players. The token burn mechanism is also boosting its demand. Even its own stable "USDH" is boosting a whole new layer of demand. Apart from just words, the rally in HYPE supports our words too. Now, rally has spiked $57 from ascending triangle, and now I believe a little retest of pattern's neckline around $49-$51, would allow it to continue higher for $60 this September, while the year-end target is still $80+. let's see how the rest of the year rolls out.
Yash_Jain_1309
In September PENGU broke out of another falling wedge patttern
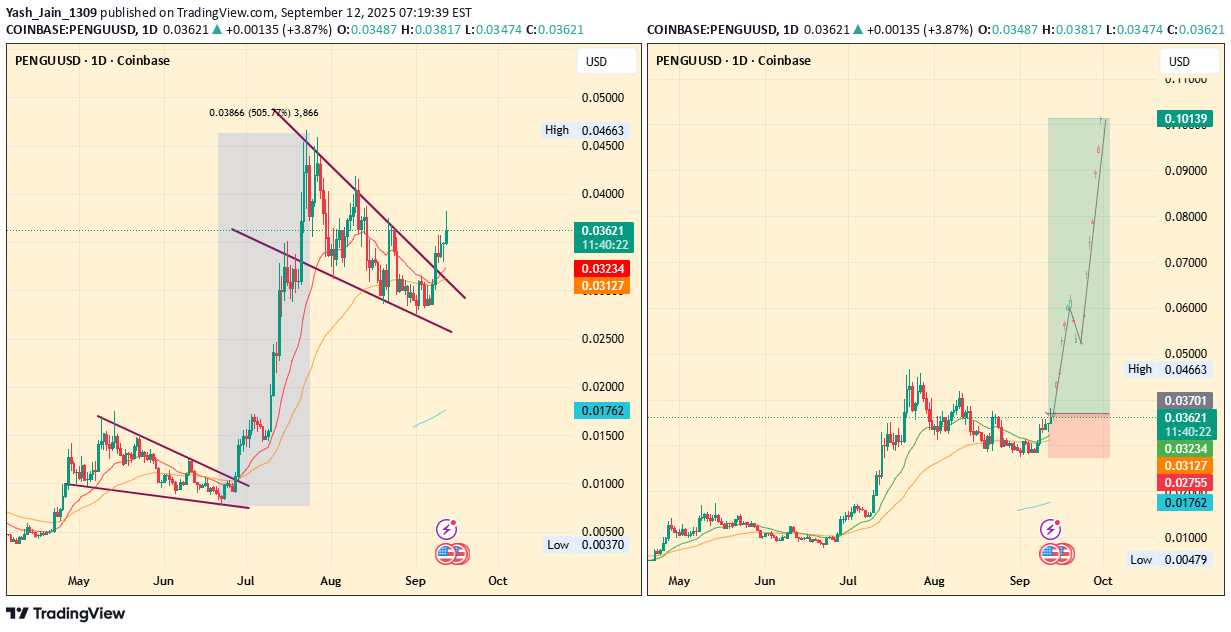
Its price action in Q2 built a falling wedge and gave a breakout of 500% by July. But now in September, PENGU broke out of another falling wedge pattern built in August price action. Let's assume ambitiously that another 500% to come, then it will hit $0.21. But even on the conservative note, if bullish momentum continues this September, then atleaset 180% gains towards $0.10 is possible.
Yash_Jain_1309
Why ADA is destined for $3?
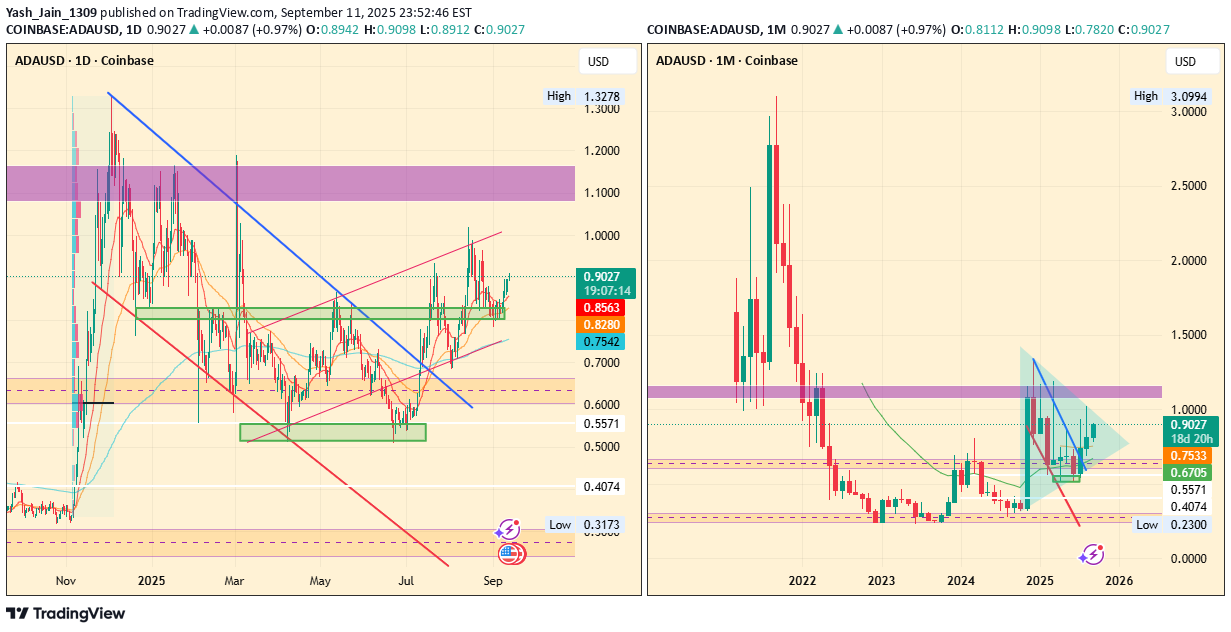
In 2025, the falling wedge was the initial pattern, whose breakout is still ongoing. But this pattern's breakout has been historically volatile with huge spikes, and the current capped rally in ADA is not what is supposed to happen in it. The delay in the rally caused by whales dumping their large ADA holding is clear; momentum is capped artificially in the short term in the second week of September. Maybe whales and smart money want the big players to rally in the last quarter and want to create this suspense for the last, and enjoy the best returns. That could be the reason why whales are supporting the low MC alts to shine and give the market new sets of blue-chip crypto, and to make the sector strong. The mindset is clear that the trend will continue in 2025, but this doesn't outwit the main trend, which is bullish, of course. If you guys can see, the delayed and capped momentum in ADA/USD has formed symmetrical triangle consolidation and is nearing the upper border, which means we are registering $1 soon again this September. But the real cadbury is when it breaks the range, then the weekly chart comes in play, which suggests that 2021 ATH is the target we are aiming at. So i bet $3 minimum for ADA/USD, and let's see how this analysis rolls out.
Yash_Jain_1309
PUMP double bottom pattern in play!
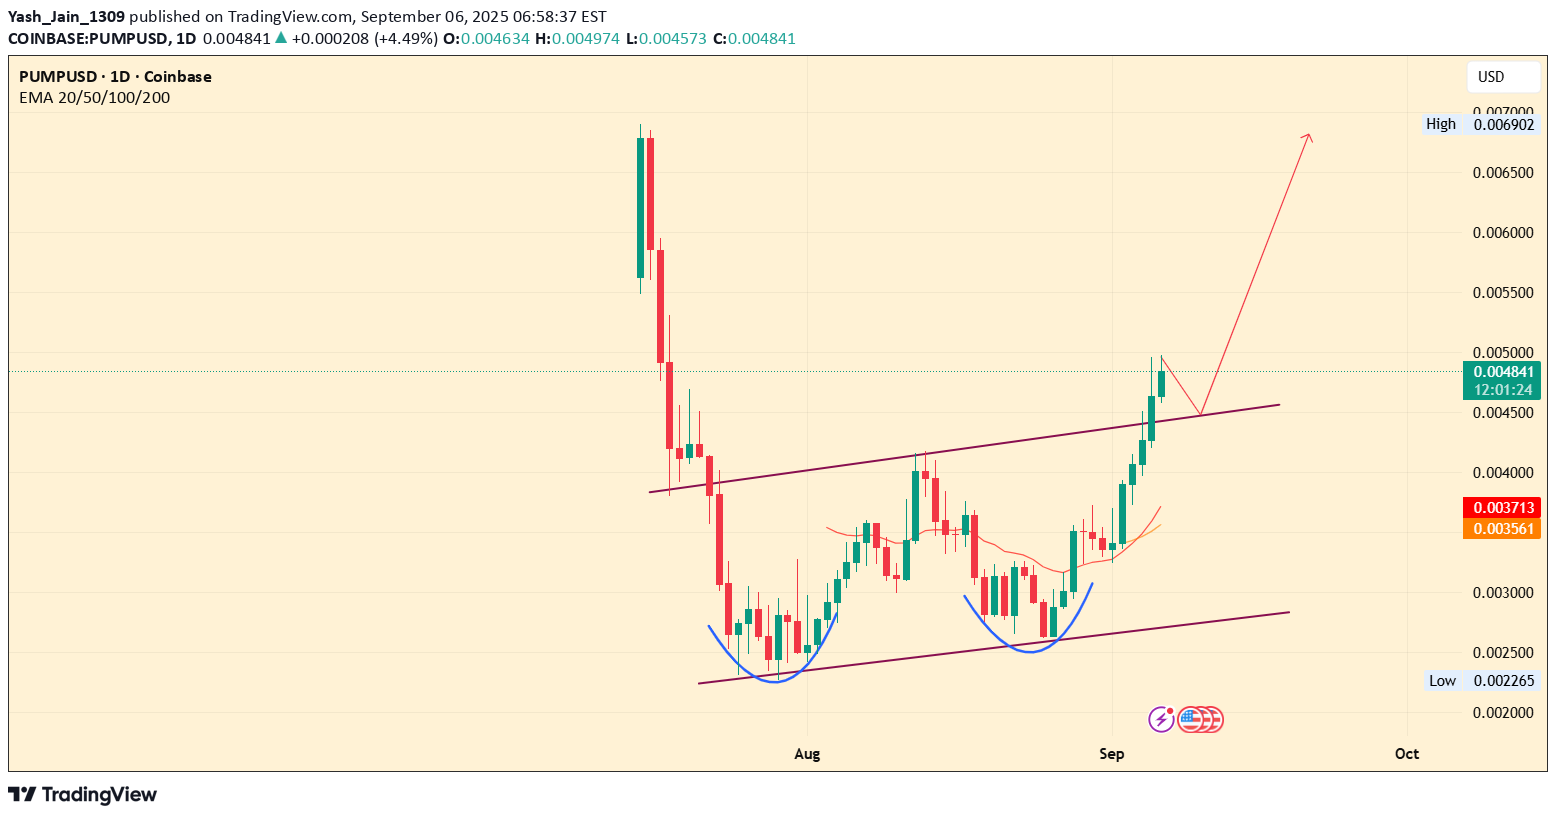
The price action is not odd, but fascinating. It made a tilted double bottom pattern (W) that only forms when demand on lower levels are elevated. A nice pullback to the upper border of the raising wedge or the double bottom's neckline would let the rally continue to $0.0069 or even it could get perpendicular towards $0.01. Let's see where it goes.Its visible on the chart that its following the double bottom breakout, and seems likely that primary aim is $0.01 target.
Yash_Jain_1309
Why SUI Can Breakout Big & End up In Price DIscovery
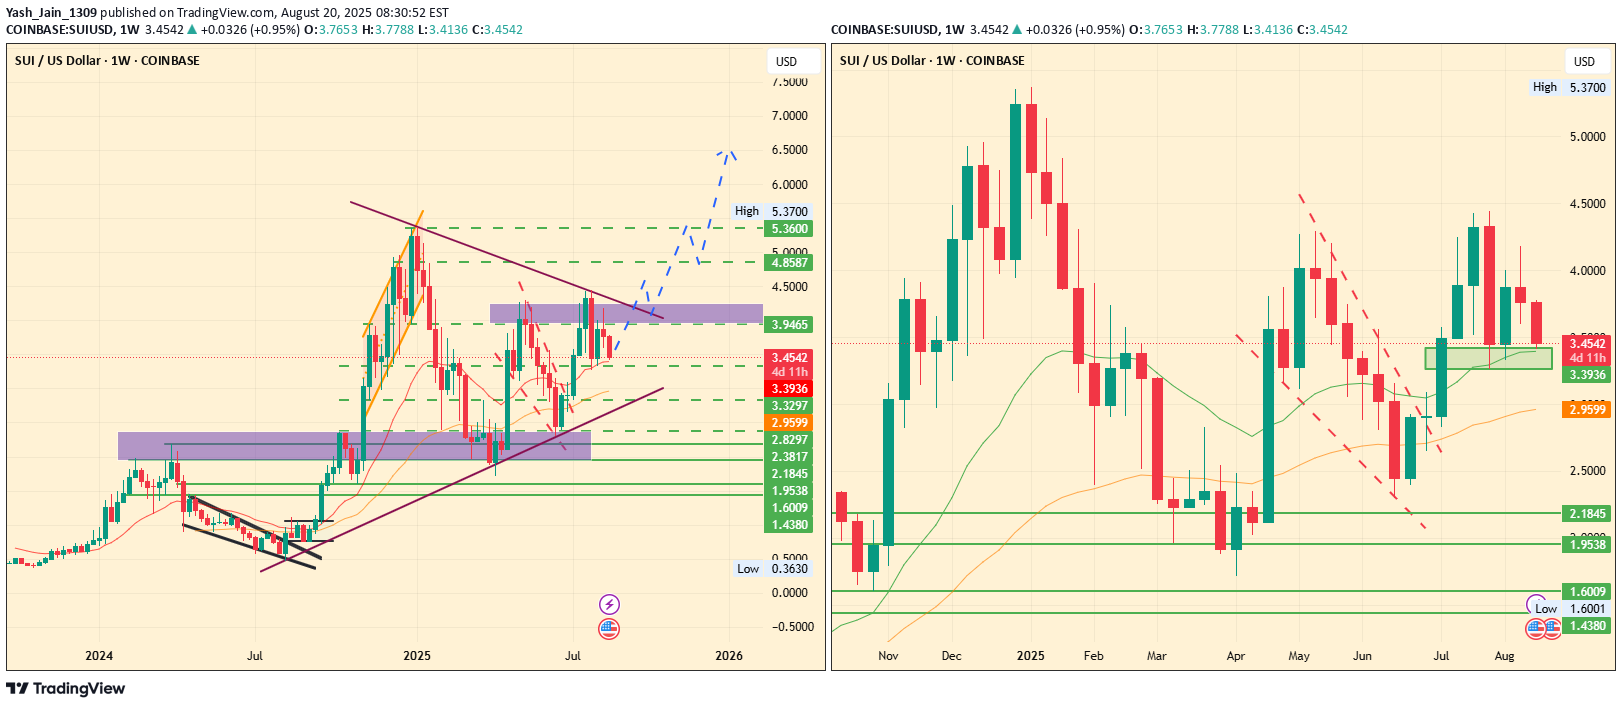
In the current quarter, July brought bullish demand, where this symmetrical pattern played its role on the weekly chart as the SUI price USD reflected a sharp rise from the lower border of this triangle to the upper edge, marking a 90% surge from $2.29 to $4.42. Yet, August brought a pullback toward a key support level near $3.32. If this zone holds and bullish demand steps in, analysts anticipate a retest of the upper border of the pattern. A successful breakout could send the SUI price forecast toward $5.37 in the coming weeks. this retest in Q3 will be followed by an extended rally toward the $6.6 to $7.0 region in Q4 2025.
Disclaimer
Any content and materials included in Sahmeto's website and official communication channels are a compilation of personal opinions and analyses and are not binding. They do not constitute any recommendation for buying, selling, entering or exiting the stock market and cryptocurrency market. Also, all news and analyses included in the website and channels are merely republished information from official and unofficial domestic and foreign sources, and it is obvious that users of the said content are responsible for following up and ensuring the authenticity and accuracy of the materials. Therefore, while disclaiming responsibility, it is declared that the responsibility for any decision-making, action, and potential profit and loss in the capital market and cryptocurrency market lies with the trader.