
XTrendSpeed
@t_XTrendSpeed

What symbols does the trader recommend buying?
Purchase History
پیام های تریدر
Filter
XTrendSpeed
BTCUSD SELL 104400

On the daily chart, BTCUSD has stabilized and is trending upwards, with the short-term bullish trend in control. Currently, the resistance level to watch is around 104400, which is a potential shorting entry point for a bearish bat pattern and is also within a previous supply zone.
XTrendSpeed
خرید اتریوم در ۲۸۳۸: فرصت صعودی بر اساس الگوی گارتلی

On the 4-hour chart, ETHUSD is currently trading in a range. In the short term, pay attention to the support level around 2838, which is a potential buy point for a bullish Gartley pattern.
XTrendSpeed
BTCUSD may break through 94650

On the daily chart, BTCUSD has stabilized and rebounded, with bulls currently in control in the short term. Support is currently around 88400; a pullback and stabilization above this level could present buying opportunities. Resistance is seen around 94650, with a break above this level targeting 99000.
XTrendSpeed
هدف طلا (XAUUSD) کجاست؟ پیشبینی صعودی تا سطح ۵۱۴۶ دلار!

On the weekly chart, XAUUSD continues to rise, showing a clear bullish trend. Currently, the AB=CD pattern is worth watching, with a target of $5146.
XTrendSpeed
XAUUSD BUY 4375

On the weekly chart, XAUUSD broke through the inside bar, reaching a new all-time high. Currently, watch for support around 4375; a pullback and stabilization could present a buying opportunity, with an upside target of 4450-4500.
XTrendSpeed
XAUUSD is watching the support level at 4257
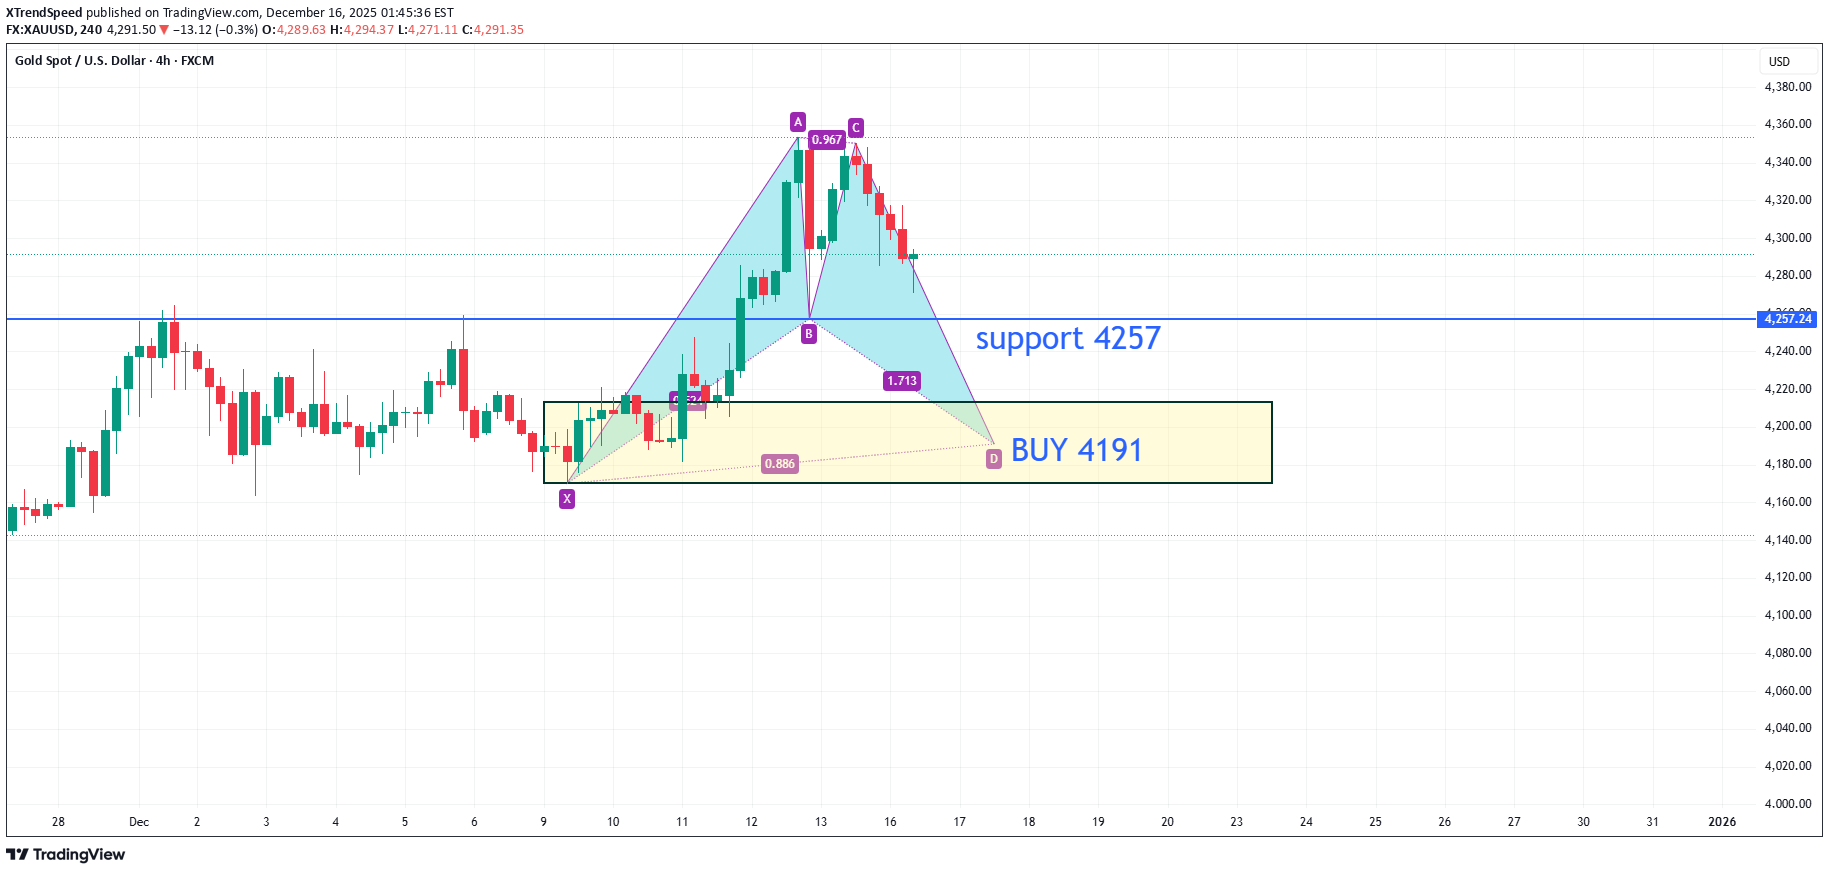
On the 4-hour chart, XAUUSD has retreated from its highs. Currently, watch for support around 4257. If it doesn't break below 4257, it may resume its bullish trend. However, if the price breaks below 4257, it will continue to fall, with further support around 4191, a potential buy point for a bullish bat pattern.
XTrendSpeed
الگوی سر و شانه کف در لایتکوین: آیا زمان خرید فرا رسیده است؟
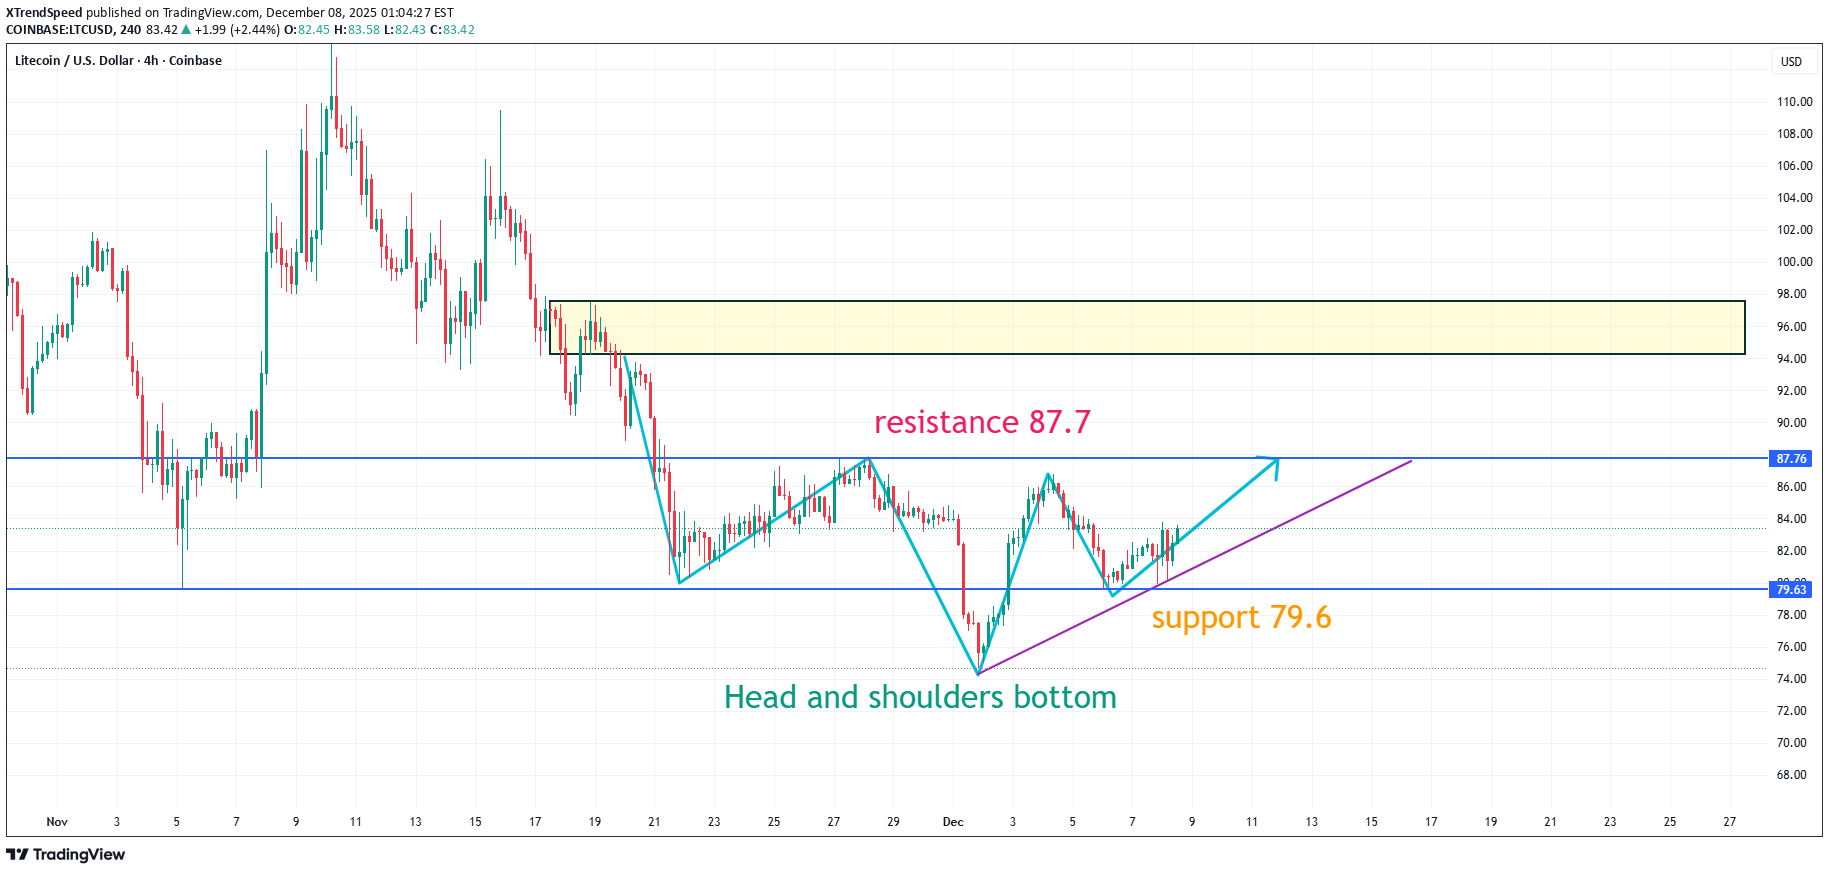
On the 4-hour chart, LTCUSD has formed a potential head and shoulders bottom pattern. Currently, watch for support around 79.6; a pullback that holds above this level could lead to further upward movement. Resistance is seen around 87.7, with a break above this level targeting the 94.2-97.5 area.
XTrendSpeed
اتریوم زیر ذرهبین: آیا مقاومت 104400 فرصت فروش است؟
On the daily chart, ETHUSD has stabilized and rebounded, with bulls holding the upper hand in the short term. Currently, attention should be paid to the resistance around 104400, a potential shorting entry point for a bearish bat pattern, which also falls within the previous supply zone.
XTrendSpeed
احتمال ریزش اتریوم از کجا شروع میشود؟ نقطه ورود طلایی فروش (ETHUSD)
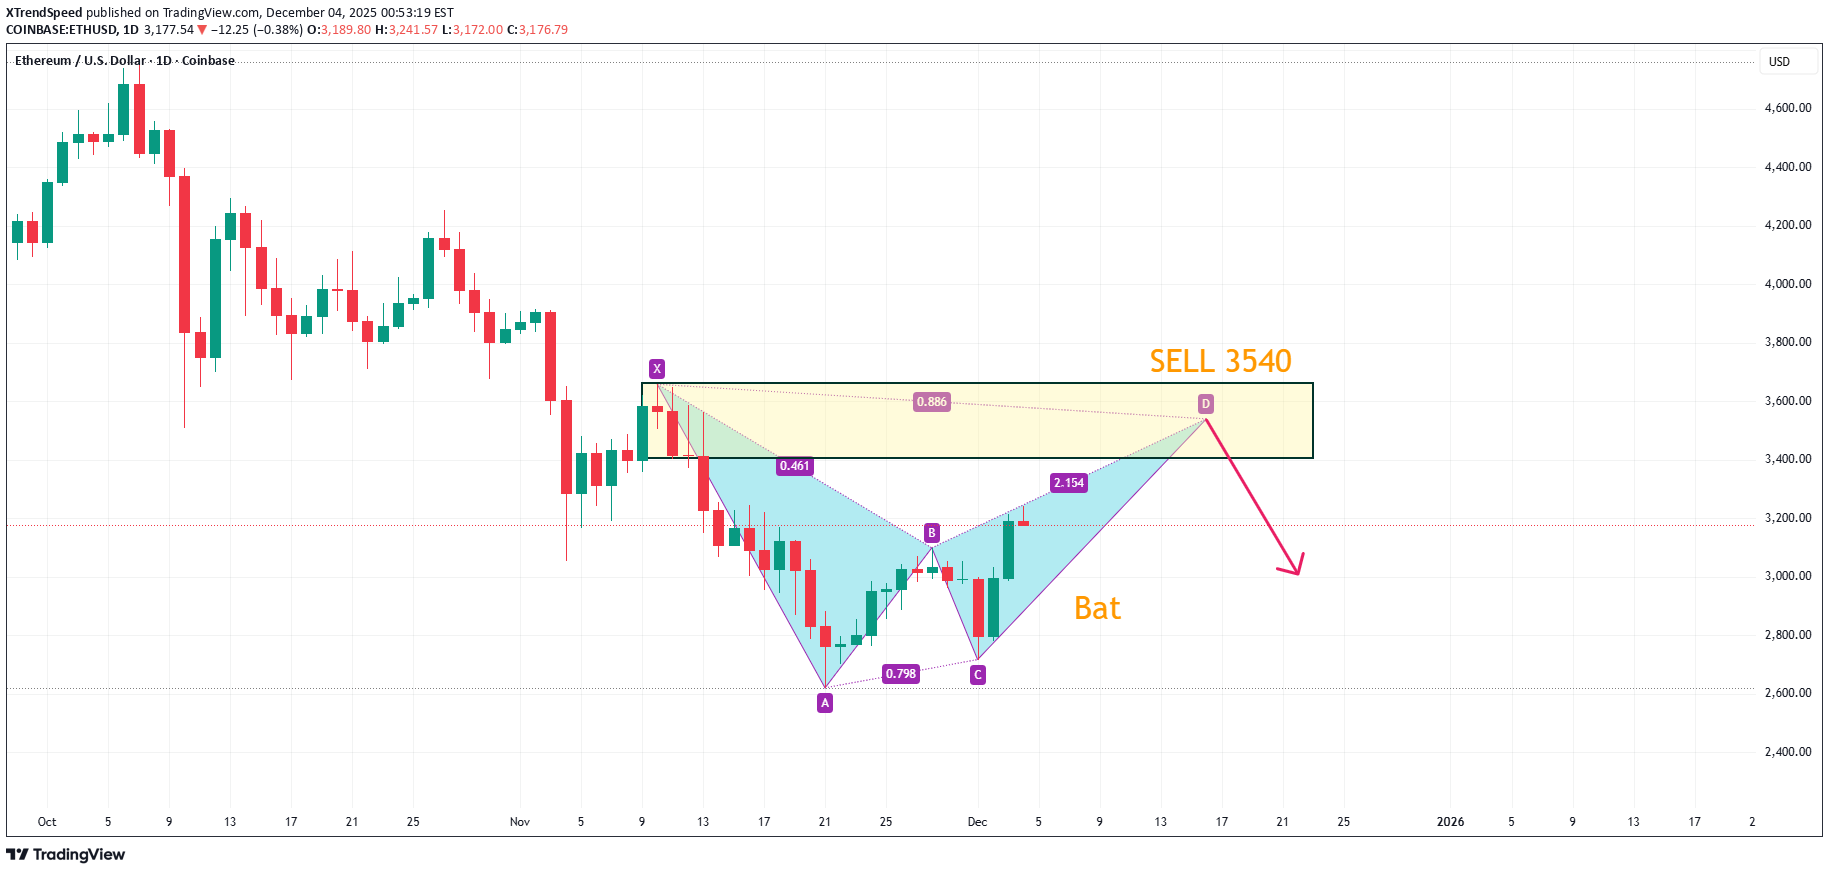
On the daily chart, ETHUSD has stabilized and rebounded in the short term, with bulls in control. Currently, attention should be paid to the area around 3540, which is a potential shorting entry point for a bearish bat pattern, and it also falls within the previous supply zone.
XTrendSpeed
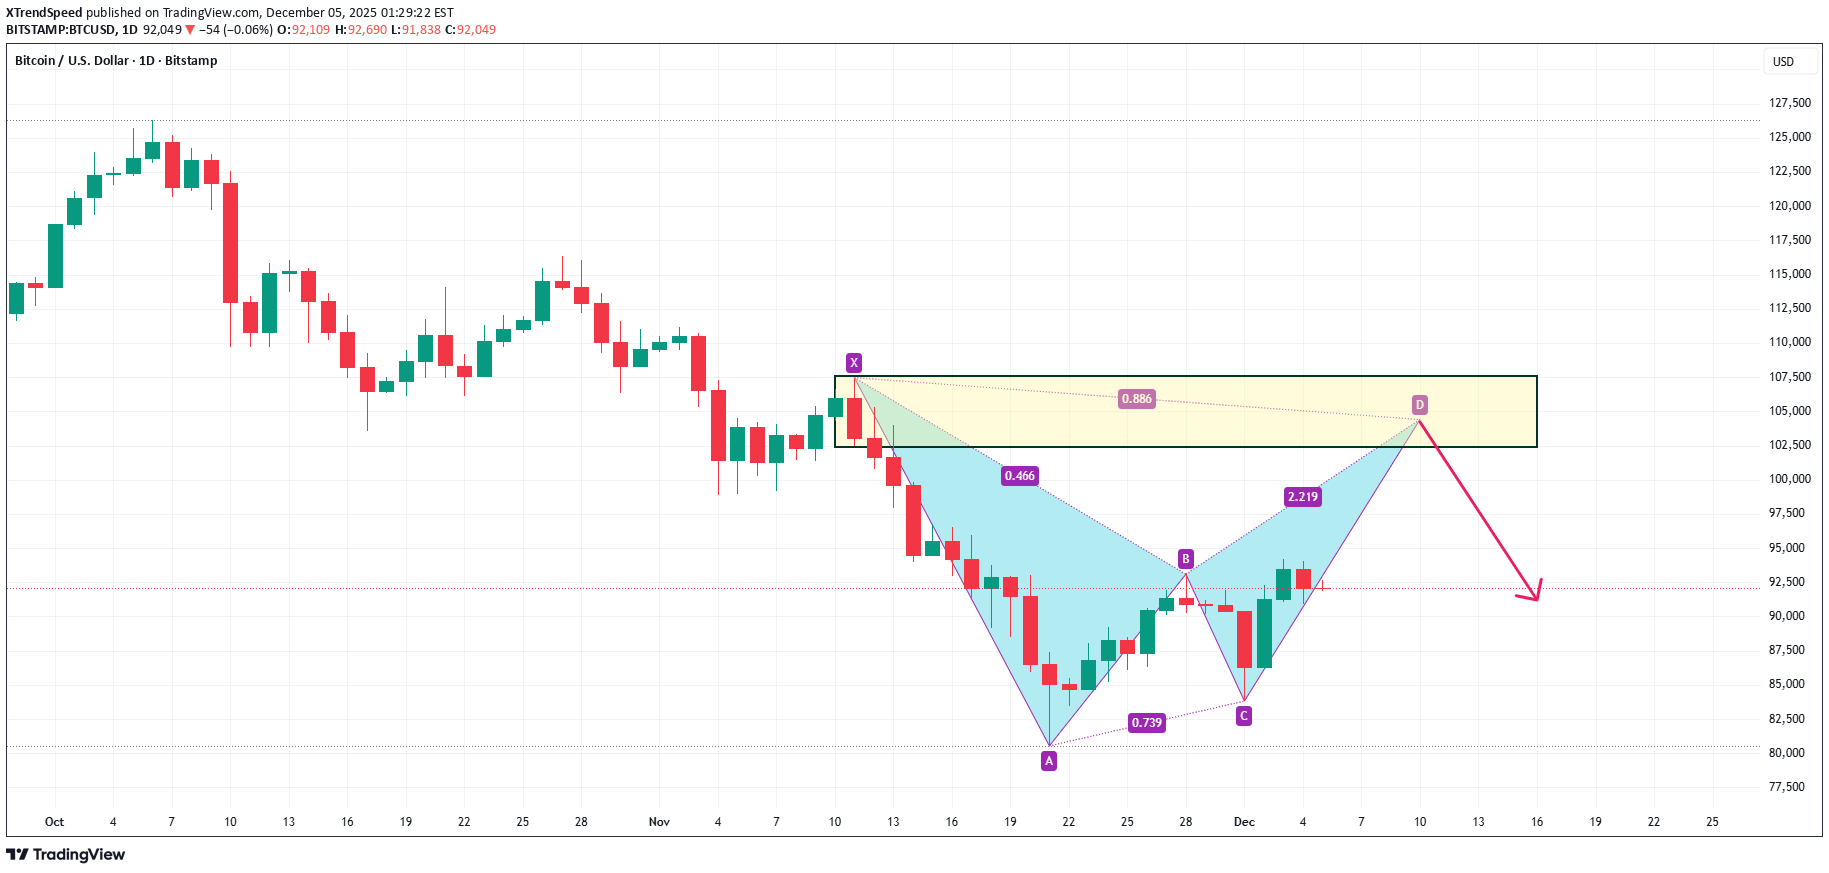
بیت کوین به کجا میرود؟ فرصت فروش طلایی در ۹۱۶۴۰!
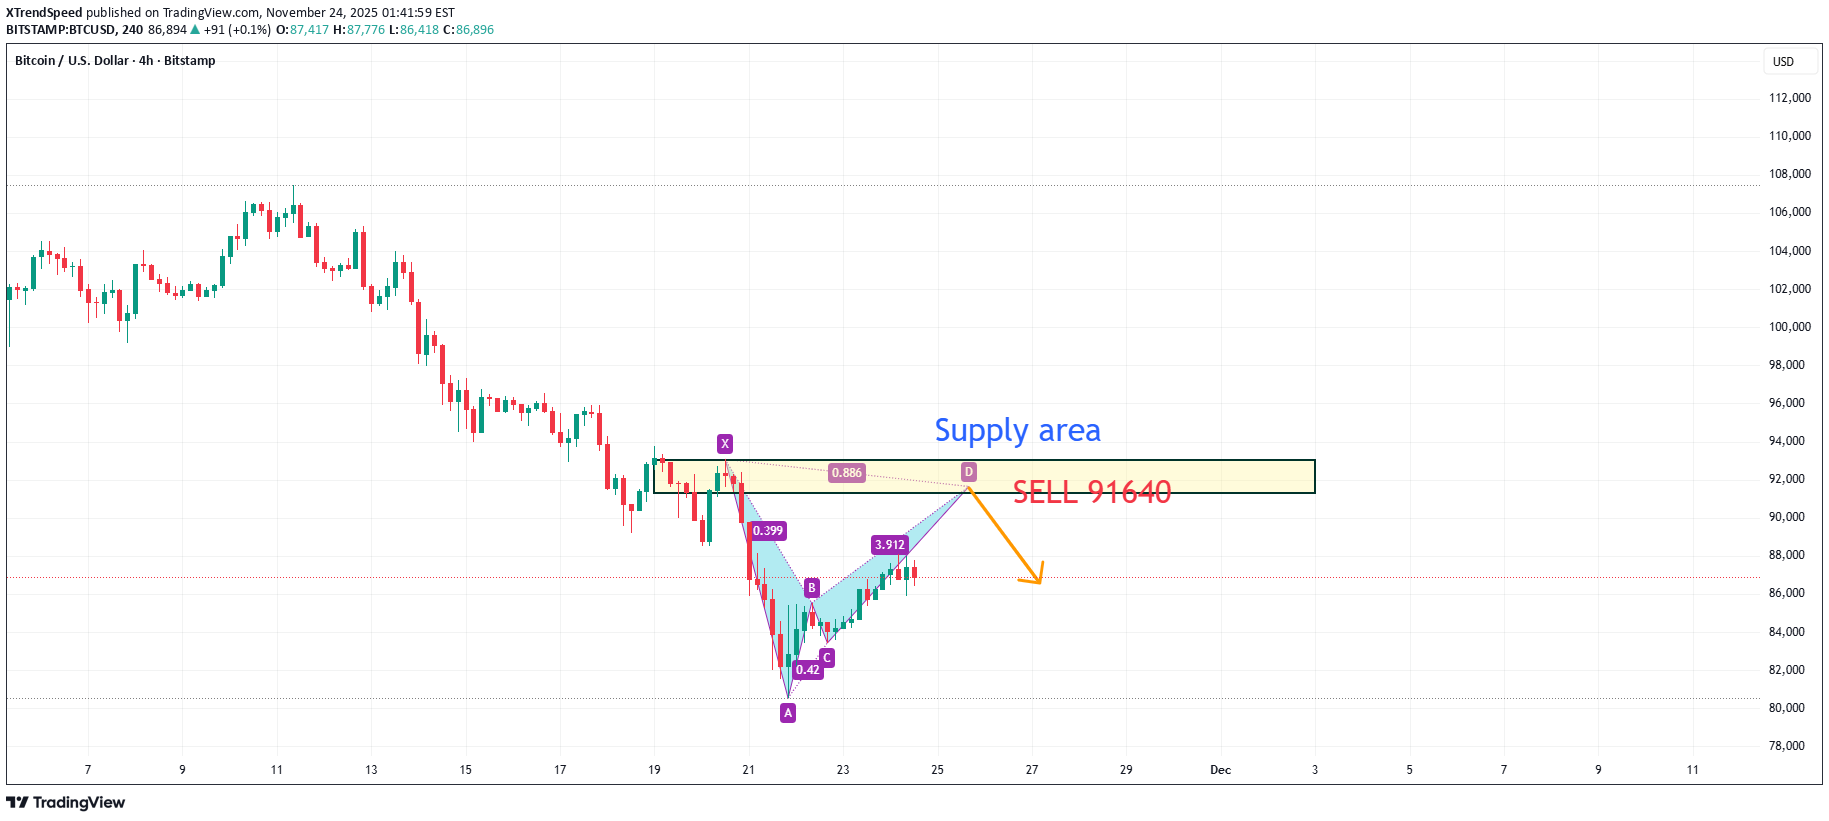
On the 4-hour chart, BTCUSD rebounded after a sharp drop. Currently, attention should be paid to the resistance around 91640, which is a potential shorting point for a bearish bat pattern, and it is also located within the previous supply zone.
Disclaimer
Any content and materials included in Sahmeto's website and official communication channels are a compilation of personal opinions and analyses and are not binding. They do not constitute any recommendation for buying, selling, entering or exiting the stock market and cryptocurrency market. Also, all news and analyses included in the website and channels are merely republished information from official and unofficial domestic and foreign sources, and it is obvious that users of the said content are responsible for following up and ensuring the authenticity and accuracy of the materials. Therefore, while disclaiming responsibility, it is declared that the responsibility for any decision-making, action, and potential profit and loss in the capital market and cryptocurrency market lies with the trader.