
Wyckognito
@t_Wyckognito

What symbols does the trader recommend buying?
Purchase History
پیام های تریدر
Filter
Wyckognito
آیا اتریوم در حال انباشت بزرگ است؟ نشانههای کلیدی در نمودار 4 ساعته!
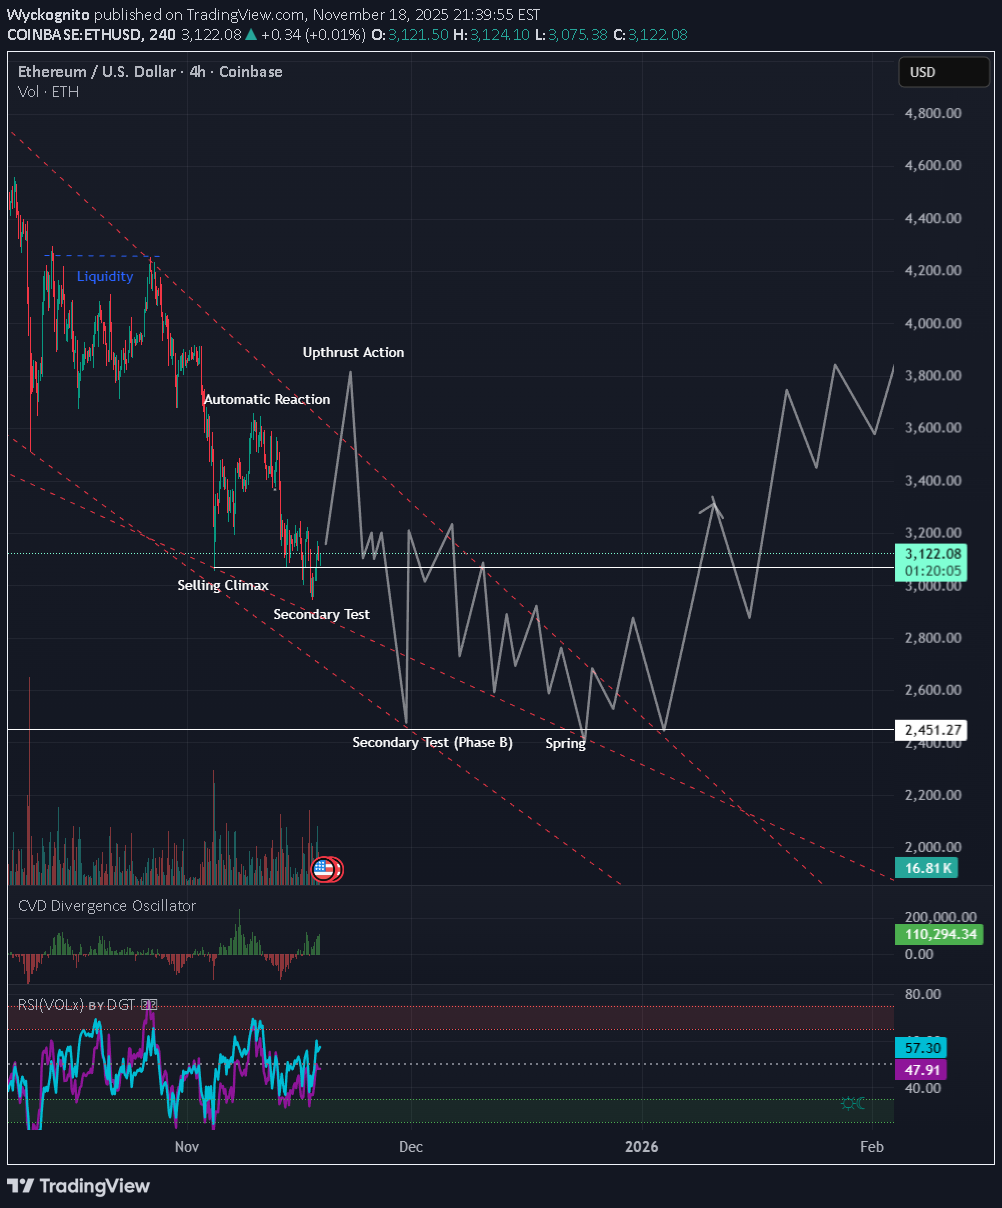
With recent price action, I am seeing what maybe an accumulation happening on the 4 hour chart, flipping my original bias from redistribution. Price is just above a major Preliminary Support level at $2450 and has been forming a large descending channel/wedge. The most recent down swing responded with a sharp wick, which aligns with the Selling Climax. Price then had an Automatic Reaction and since then has returned with a Secondary Test. If this is correct, we may be entering Phase B of accumulation, where we can see an Upthrust move before absorption of seller continues below. Why This Looks Like Accumulation The market is still making lower lows in price, but the internal strength is not confirming those lows. This is typical behavior in Accumulation Phase B/C, where supply exhausts while price drifts downward. Key supporting signals: 1. Delta Behavior Recent down-legs have shown declining sell delta, meaning sellers are pushing price lower but with noticeably less aggression. This weakening of effort vs. result is a classic precursor to a terminal action such as a Spring or major ST. 2. Dual RSI Divergences The RSI indicator here is split into two components: • Purple = Relative Strength of Price • Teal = Relative Strength of Volume Across the most recent lows: • Price made lower lows • RSI-price made slightly higher highs and higher lows • RSI-volume showed a mixed but rising structure, making both higher highs and higher lows on the internal swings This is important because it shows momentum decoupling from price. When both price-strength and volume-strength diverge upward while price drifts downward, it often signals that the market is absorbing supply rather than breaking down structurally. 3. Volume Tapering Each push lower has occurred on gradually diminishing volume, and even the bearish expansions lack the signature spike you typically see in distribution breaks. This behavior aligns with absorption, not aggressive continuation.
Wyckognito
اتریوم در آستانه ریزش بزرگ؟ علامتهای مرموز و حرکت نهایی قبل از سقوط!
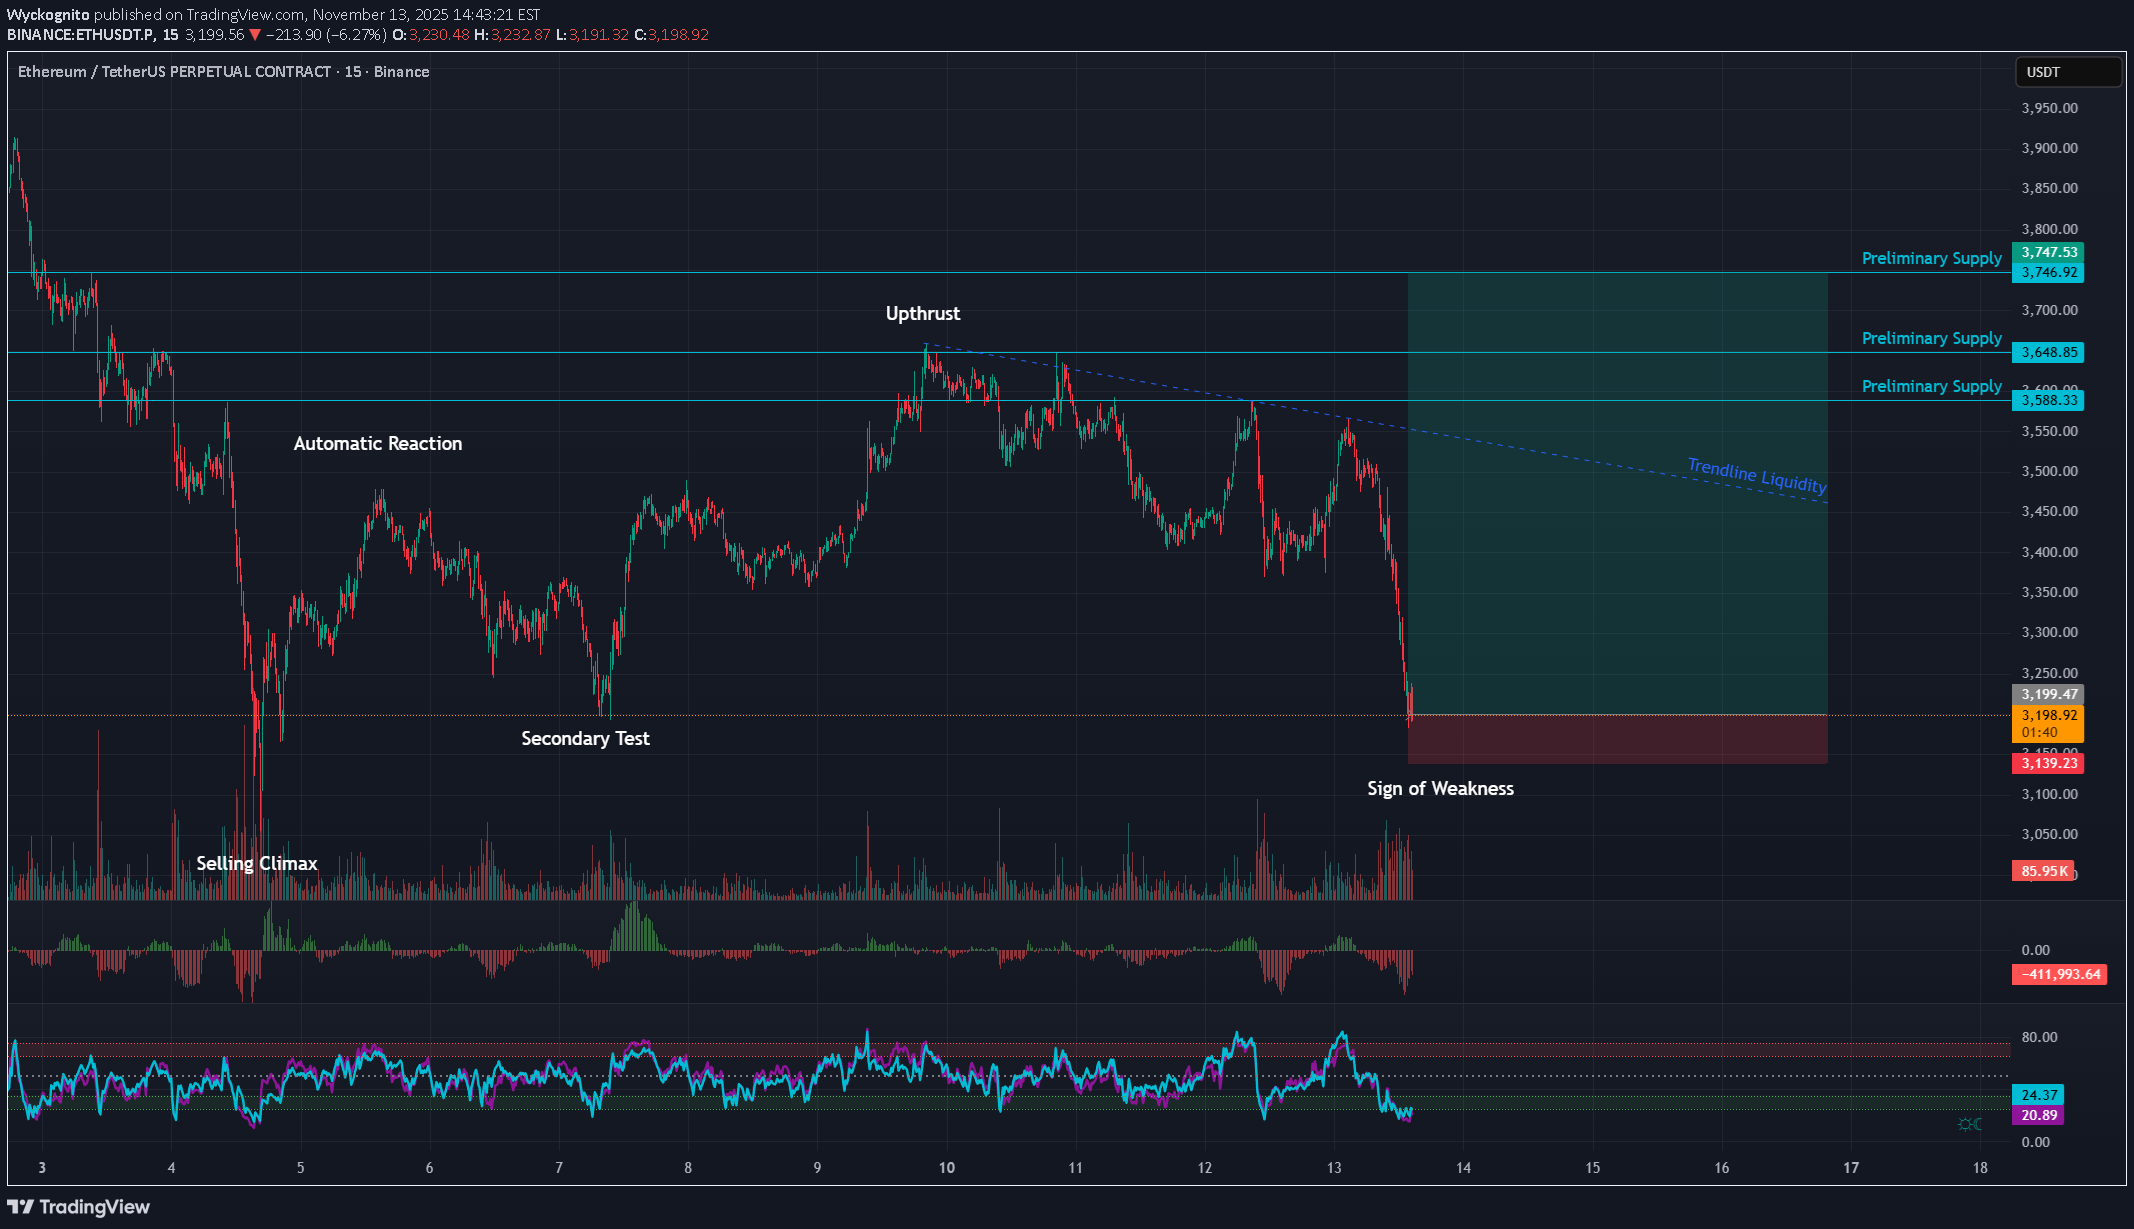
Ethereum is carving out what appears to be a redistribution structure, but the context hints we may still need one more push upward, possibly a Last Point of Supply (LPSY) or even a UTAD (Upthrust After Distribution), before the markdown phase resumes. Wyckoff Structure Overview: Selling Climax (SC) and Automatic Reaction (AR) defined the lower boundary. Secondary Test (ST) confirmed demand depletion. Upthrust (UT) established resistance and began drawing a trendline of liquidity across the highs. The recent Sign of Weakness (SOW) confirms heavy supply entering, but price action is extended and could retrace to relieve pressure. The PSY zone between $3,580–$3,740 remains untested, aligning with both a liquidity pool and potential LPSY/UTAD territory. That’s where we’ll likely see whether this range completes redistribution or transforms into an even broader distribution with a deceptive final trap. Volume and CVD Analysis During the SOW, volume spiked — strong selling pressure confirmed. Yet CVD is diverging, showing aggressive sellers losing momentum while absorption quietly builds. If we see a sharp rebound on weak delta, that will likely be smart money offloading into strength — the signature of an LPSY or UTAD. The Lunar Influence We’re in Lunar Day 23, during the Last Quarter Moon in Virgo — a cosmic rhythm often tied to misleading signals, short-lived reversals, and exaggerated reactions. This phase tends to produce fakeouts that look like Signs of Strength or Signs of Weakness, but are actually exhaustion moves or liquidity grabs before the real continuation. In Wyckoff terms, Lunar Day 23 energy often shows Phase C deception, which could be a UTAD disguised as a breakout or a terminal shakeout before markdown. What to Watch Next Rebound on declining volume → potential LPSY/UTAD forming. Failed rally into the PSY zone with increased spread down-bars → confirmation of redistribution continuing. Strong bullish delta with no follow-through → likely fake strength under Lunar Day 23 conditions.Moving into Lunar Day 26 and 27 with a waning crescent in Libra. This stretch usually brings a calmer, more balanced tone in the market — less aggression, more weighing and measuring. Perfect environment for markets to stabilize after a shakeout. If ETH is going to confirm the Spring and start shaping Phase D, this window tends to support those slow, steady higher-low builds rather than big impulsive moves.Buy Trade is still active but I have posted a new idea after seeing recent price action.
Wyckognito
US500 | Potential Wyckoff Reaccumulation Unfolding
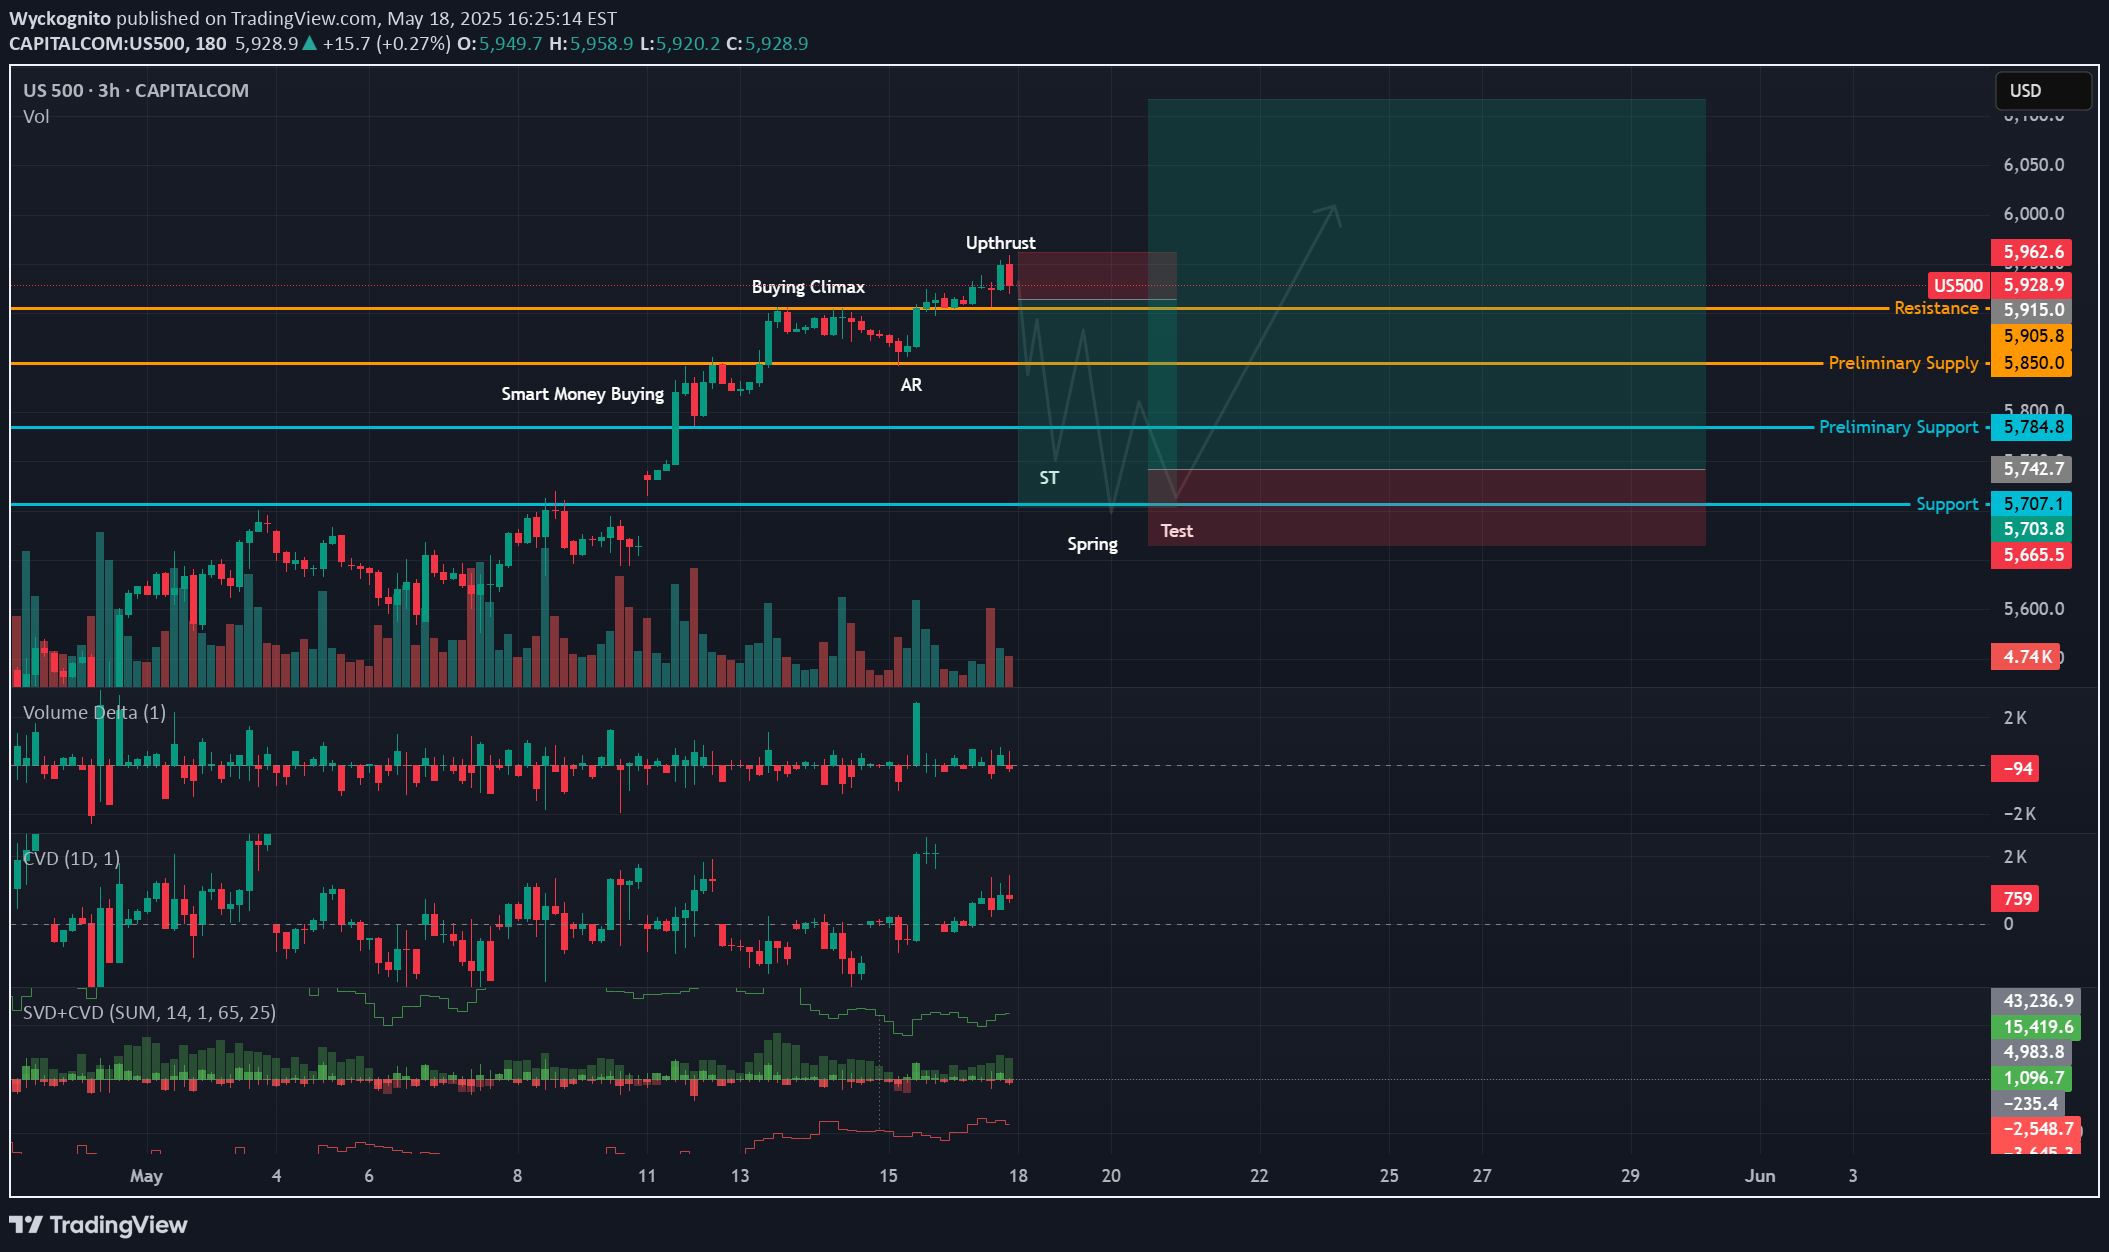
The US500 appears to be working through a classic Wyckoff reaccumulation phase following a strong rally during price mark-up. After a swift move upward, price formed what looks like a Buying Climax , followed by an Automatic Reaction (AR) and now an Upthrust at the recent highs. So far, volume and delta behavior are aligning well with this. During the upthrust , we saw increased volume, but delta turned negative, indicating selling pressure into strength. This was also accompanied by a CVD divergence, showing that although price pushed to new highs, the underlying buying wasn't supporting the move just yet. That often hints distribution by strong hands as late buyers step, likely fuel by the good ol' Trump Pump. With that in mind, a pullback into the lower range is expected to create the Secondary Test (ST) . This could lead to a possible Spring , a shakeout below recent support (around the 5700–5720 zone) meant to trap sellers. Ideally, this would be followed by a Test , where price returns to the Spring zone on lower volume and stronger delta/CVD confirmation, signaling demand returning and absorption of supply. But this is all to be determined. This doesn't have to play out exactly as I mapped. But if we see something similar play out, it would lead to higher prices and confirmation of the mark-up phase. Until then, patience is key, this phase of the structure is about traps and tests, not breakouts.Price recently pushed above the prior upthrust level, creating what appears to be a second Upthrust Action (UTA) or a bull trap, a classic Wyckoff behavior in Reaccumulation Schematic #2. This move lacked strong volume or delta follow through and quickly pulled back, creating a likely fakeout. However, if price can hold this level it would make it a Sign of Strength, which means price would continue up. So far volume and delta are not support this as a SOS. Interestingly, a fakeout or bull trap aligns with Lunar Day 22, which often brings volatility, false breakouts, and energetic reversals — especially as the Moon transitions out of Mars and Venus phases. Going forward, we could see price drift back below the Automatic Reaction (AR) level, forming a creek and potentially setting up a spring or spring + test to trap short.Price looks to be accepting at the higher level. This would make upthrust #2 a Sign of Strength. Meaning we should not see the retracement back below the AR. I am expecting a strong bullish continuation to the upper channel trendline. It is now Lunar day 23, this is a high risk, higher energy day. A good day to use momentum and fade extreme moves. Buying climaxes, selling climaxes, and the end of Phase D in wyckoff patterns tend to happen on this day. The current Sign of Strength is midpoint of Phase D in Wyckoff Reaccumulation, and a upward breakout typically follows.I know I've flipped my sentiment a few times already but I think my eyes were deceiving me and wanting this to be bullish. I am now seeing that price is distributing, but in a very deceptive way. Reasons for flipping bearish: 1. Volume Delta: Recent bars show weak or negative volume delta (buyers getting absorbed or sellers taking control). This is happening at or near the highs, which is a key sign of buyer exhaustion. 2. CVD (Cumulative Volume Delta): CVD is trending lower even while price made higher highs (divergence). This implies, aggressive buyers are entering but not moving price up, absorption by large sellers. 3. SVD+CVD (Smart Volume Delta): I am seeing conflicting signs (green and red bars), but the net movement shows negative cumulative flow in recent bars, reinforcing the idea that buying is being met with strong selling. Other things to note. I also redrew my trendlines more accurately, showing price pushing above the upper trendline and struggling to stay above. The up move after the upthrust isn't showing much conviction or effort from buyers, signaling momentum is weakening.Failed Bull flag and Confirming Bearish Momentum -Relative Strength of Volume and Relative Strength of Price both trending down -Volume declining on last rally -CVD negative -No aggressive buying effort on TestLooks good to sell. Be on the lookout for a possible bounce off the PSY levelHold on shorts, looks like it wants to move higher into the liquidity zone before breaking down
Wyckognito
ETH Showing Weakness in Wyckoff Distribution
Looks like we may see a nice pull back this weekend. Price has failed to break the labeled Buying Climax and is showing signs of a reversal. Retracement could be back to the last point of support around $1655. Here it can accumulate and continue its up move. I have posted a Idea targeting $2700, I still think this could be in play
Wyckognito
ETH Distribution Playing Out After Clean Accumulation Target Hit
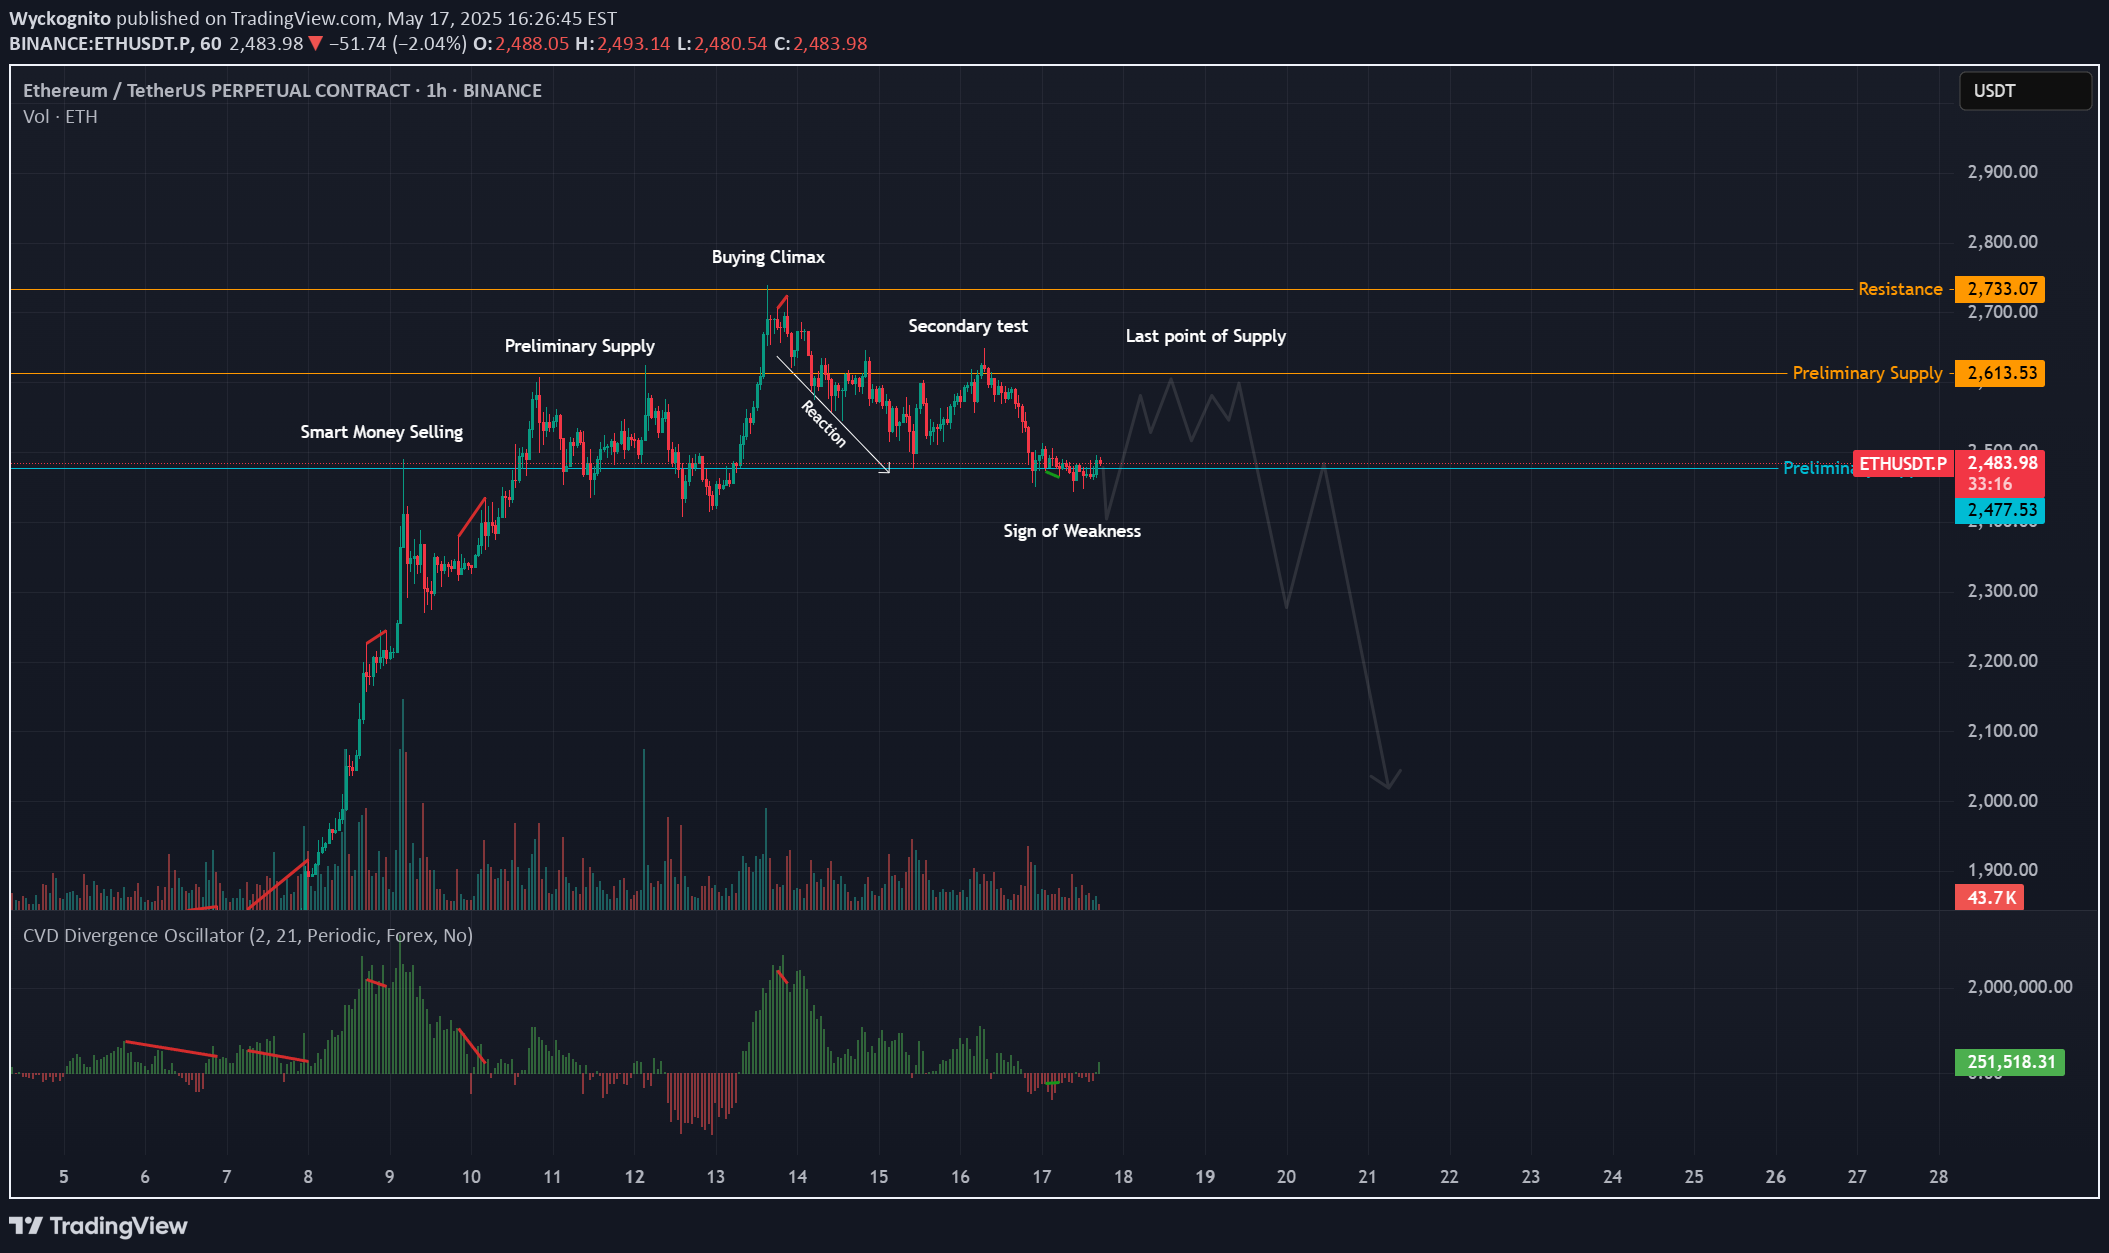
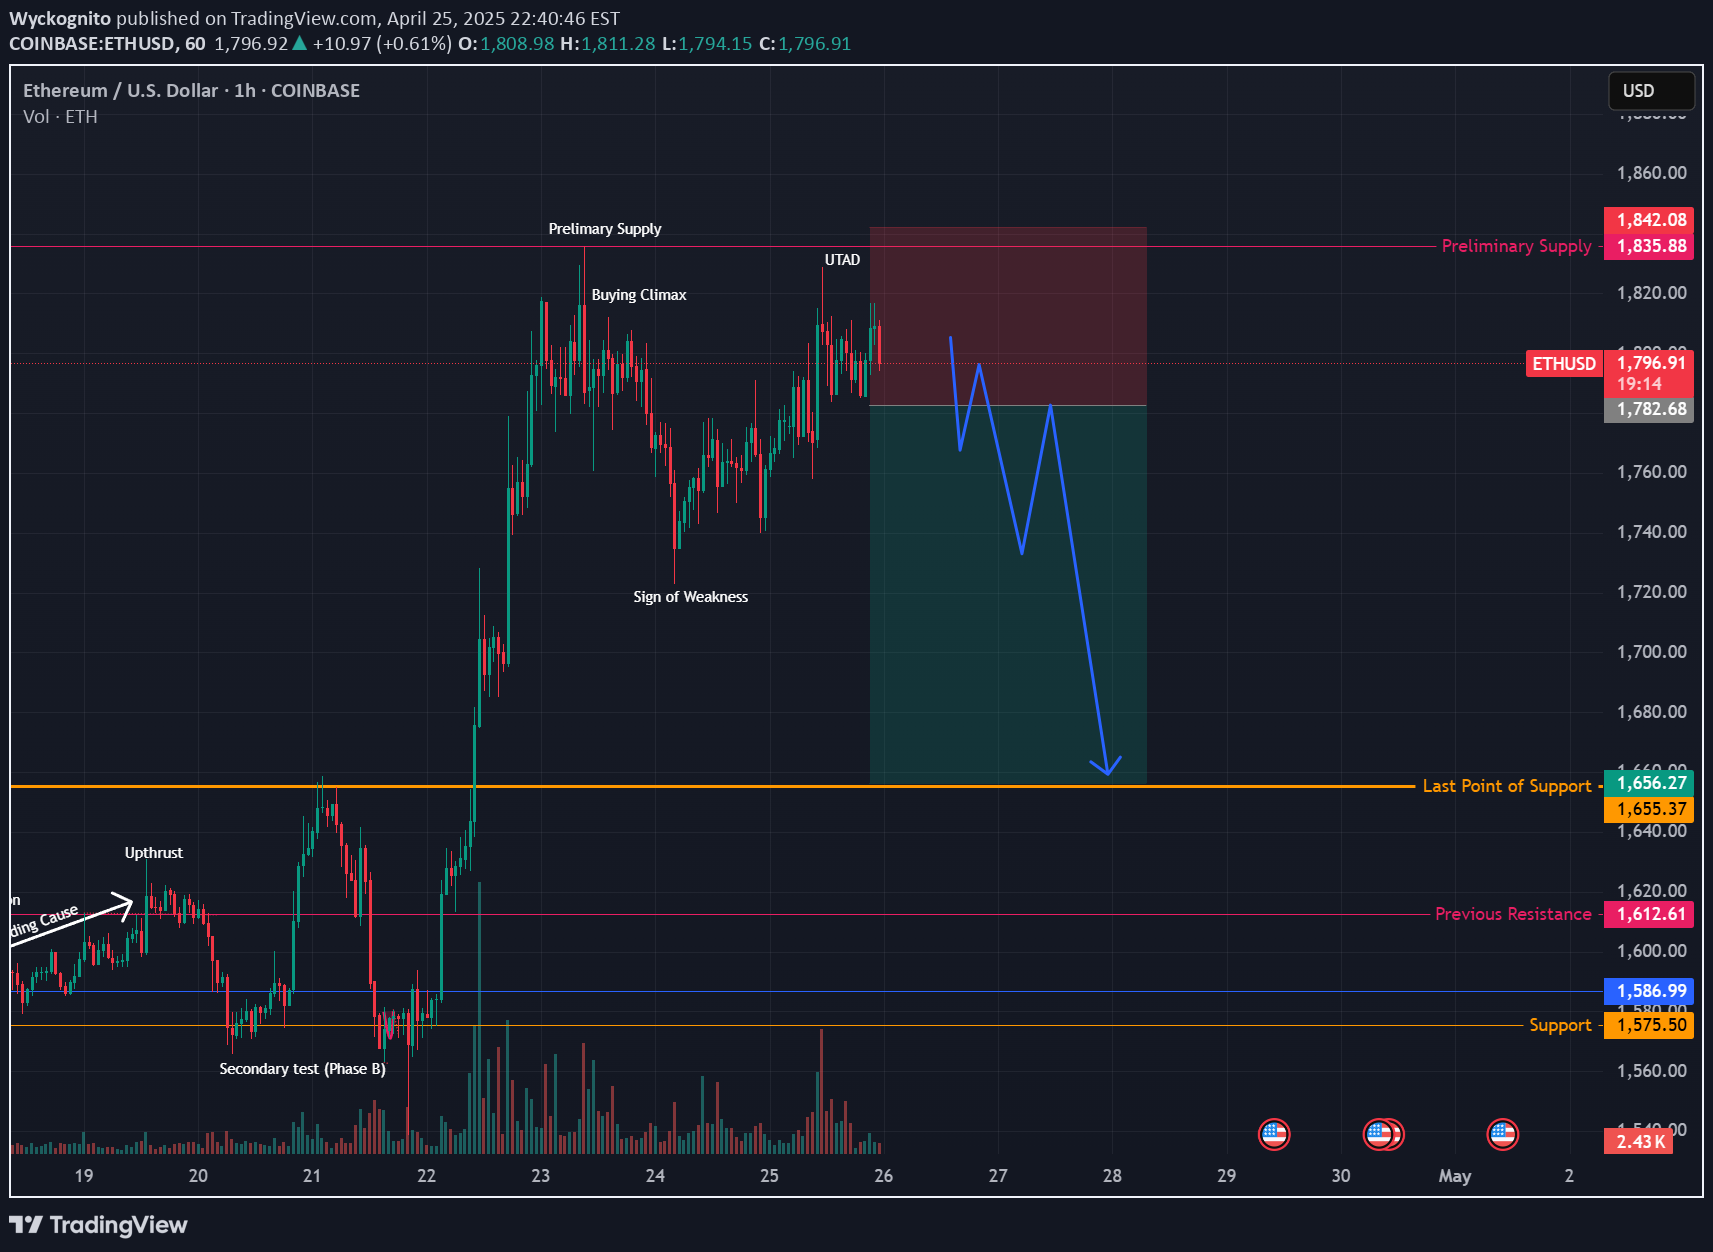
This is a follow-up to my last ETH idea, where I called for accumulation and a breakout from the falling wedge — price hit the exact target I mapped out, and since then, the behavior has shifted.We are now seeing the classic signs of distribution forming. It began with smart money stepping in selling into strength, which led into preliminary supply. That was followed by a strong climatic volume push into a buying climax, the heavy volume came in right at the top, and since then, we’ve seen a reaction down, a weak bounce (secondary test), and now a potential sign of weakness.The delta has been confirming the distribution as well. It showed bearish divergence at the buying climax, showing aggressive selling happening even as price pushed up. Now with this move down, we’re seeing increasing negative delta confirming supply is in control. Volume is also heavier on the drops, confirming distribution rather than re-accumulation.After a sign of weakness like this, we usually get one more push up into a last point of supply — a weaker rally that gets sold into before the real markdown begins. Be aware of a possible trap move above the secondary test or buying climax, but the structure suggests the highs are likely in for now.Whether this plays out clean or gets messy with one more fakeout, the context has seemd to shift. Smart money appears to be offloading, and delta continues to confirm it. Bias flips bearish until proven otherwise.Overall, I believe the recent up move was a stop hunt and ETH has much more downside ahead.Since my initial post at the first Sign of Weakness, price action has continued to align with classic wyckoff distribution behavior.-After the Last Point of Supply (LPSY) and a breakdown into the Sign of Weakness (SOW #2), we've seen a sharp rally back up — but it appears to be forming a LPSY #2, right into the prior breakdown zone. I've identified a possible redistribution pattern as well. (yellow). With it being Lunar Day 22, a day associated with realizations and culmination, the energy fits the narrative of a final trap or distribution event before further downside.Price seems to be holding at the upthrust, suggesting it could be a sign of strength in accumulation not a redistribution. If so, a possible UTAD (upthrust after distribution) could be forming on the larger pattern to trap buyer. be on the look out for a quick move above the secondary test or buying climax
Wyckognito
ETH Wykoff Accumulation and Massive Falling Wedge
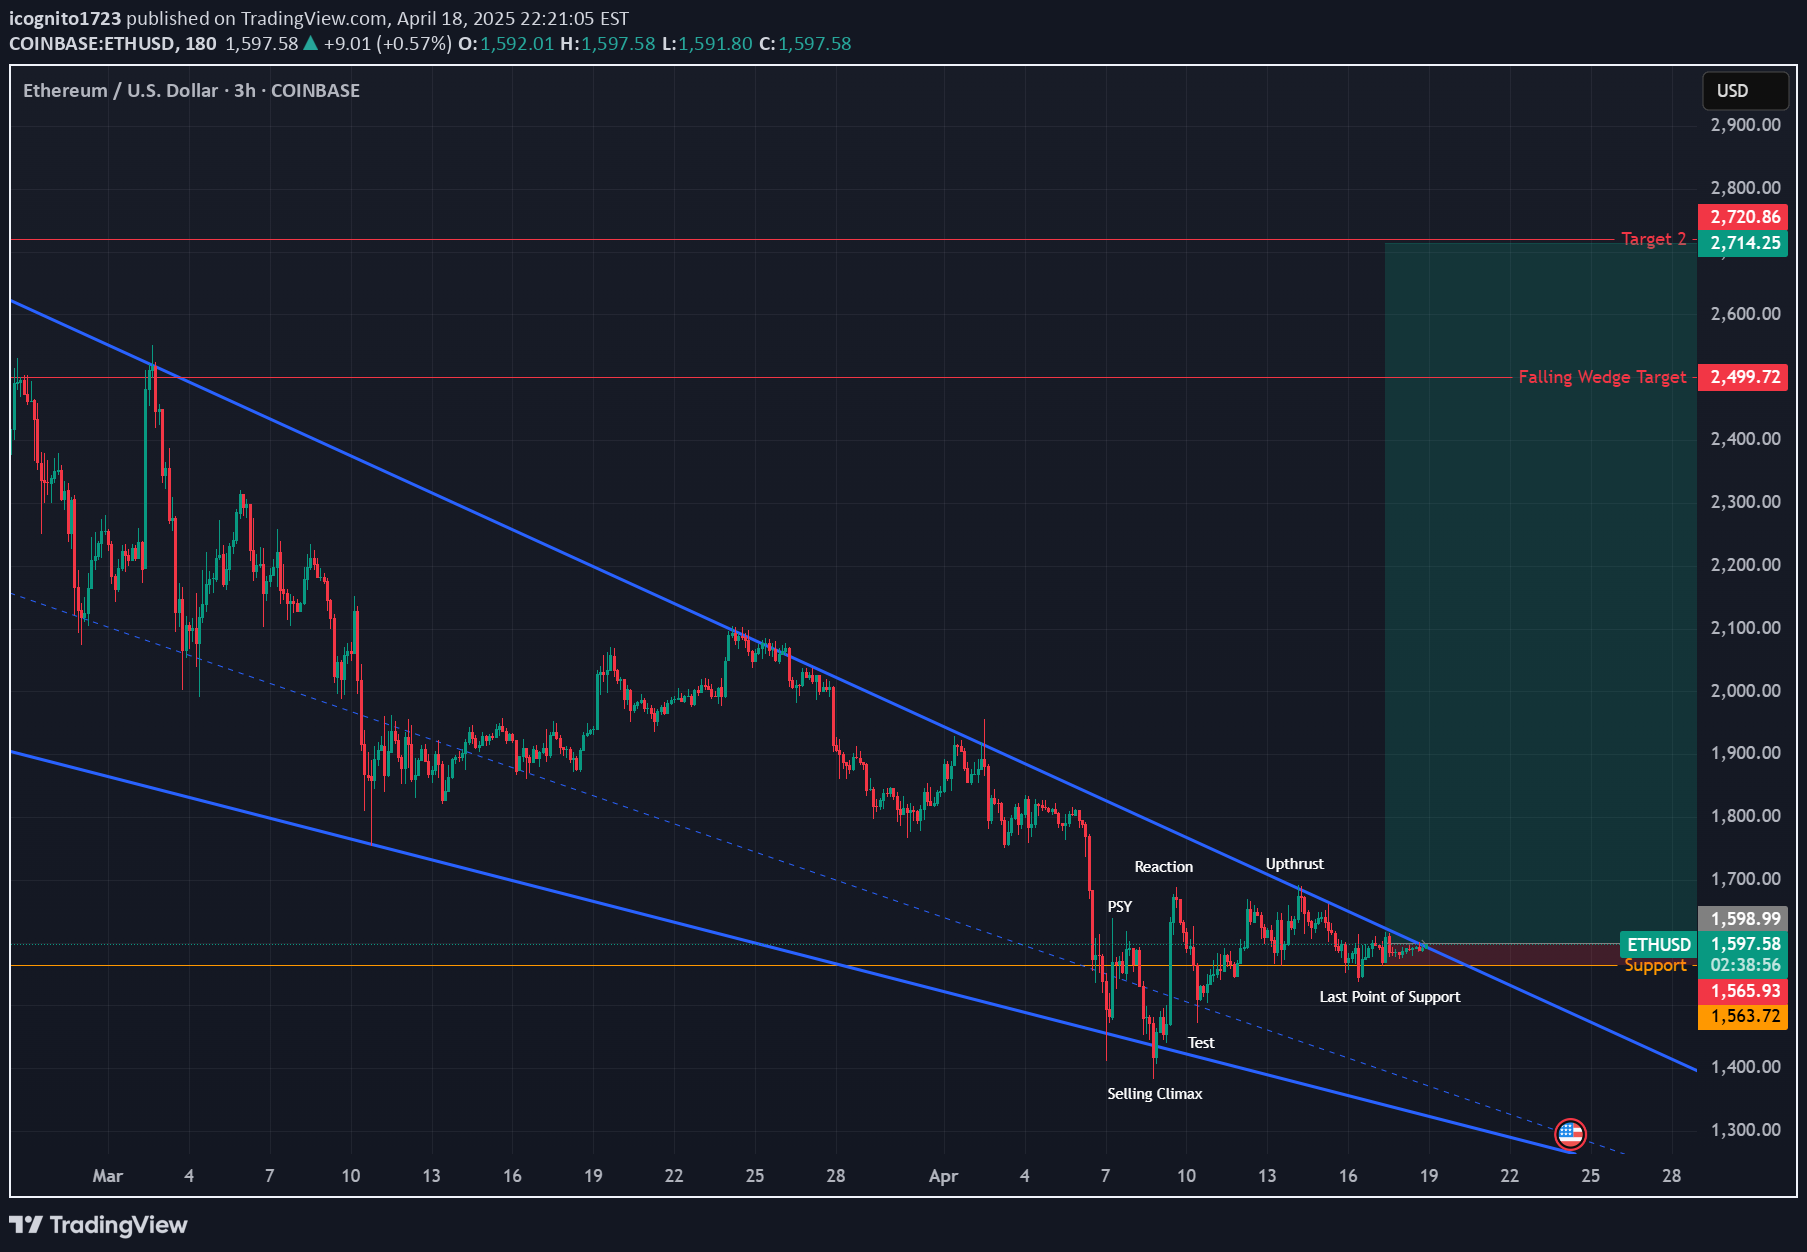
We could be seeing a big up move here this weekend. Wyckoff accumulation is almost complete, if support holds we should see a breakout of the falling wedge. However, I think this will be a huge trap to shake out sellers, so be looking to take profits.My current outlook on the 15 minute timeframe. I have identified what seems to be another accumulation. If the current support holds, price could be ready to push past Saturdays high. There is a possibility support doesn't hold and the price breaks down to make a spring or price could continue to redistribution. However, on the 1 min price action near the support is showing signs of accumulation as well.Nice move past previous high! Looks like it's ready to attack the next level of resistance 1688Price has successfully broke resistance at 1688 and is now using it as support. I have identified a possible reaccumulation pattern on the 1minchart with possible incoming spring that could drop to the last point of support.
Disclaimer
Any content and materials included in Sahmeto's website and official communication channels are a compilation of personal opinions and analyses and are not binding. They do not constitute any recommendation for buying, selling, entering or exiting the stock market and cryptocurrency market. Also, all news and analyses included in the website and channels are merely republished information from official and unofficial domestic and foreign sources, and it is obvious that users of the said content are responsible for following up and ensuring the authenticity and accuracy of the materials. Therefore, while disclaiming responsibility, it is declared that the responsibility for any decision-making, action, and potential profit and loss in the capital market and cryptocurrency market lies with the trader.