WazDaz
@t_WazDaz
What symbols does the trader recommend buying?
Purchase History
پیام های تریدر
Filter
Signal Type
WazDaz

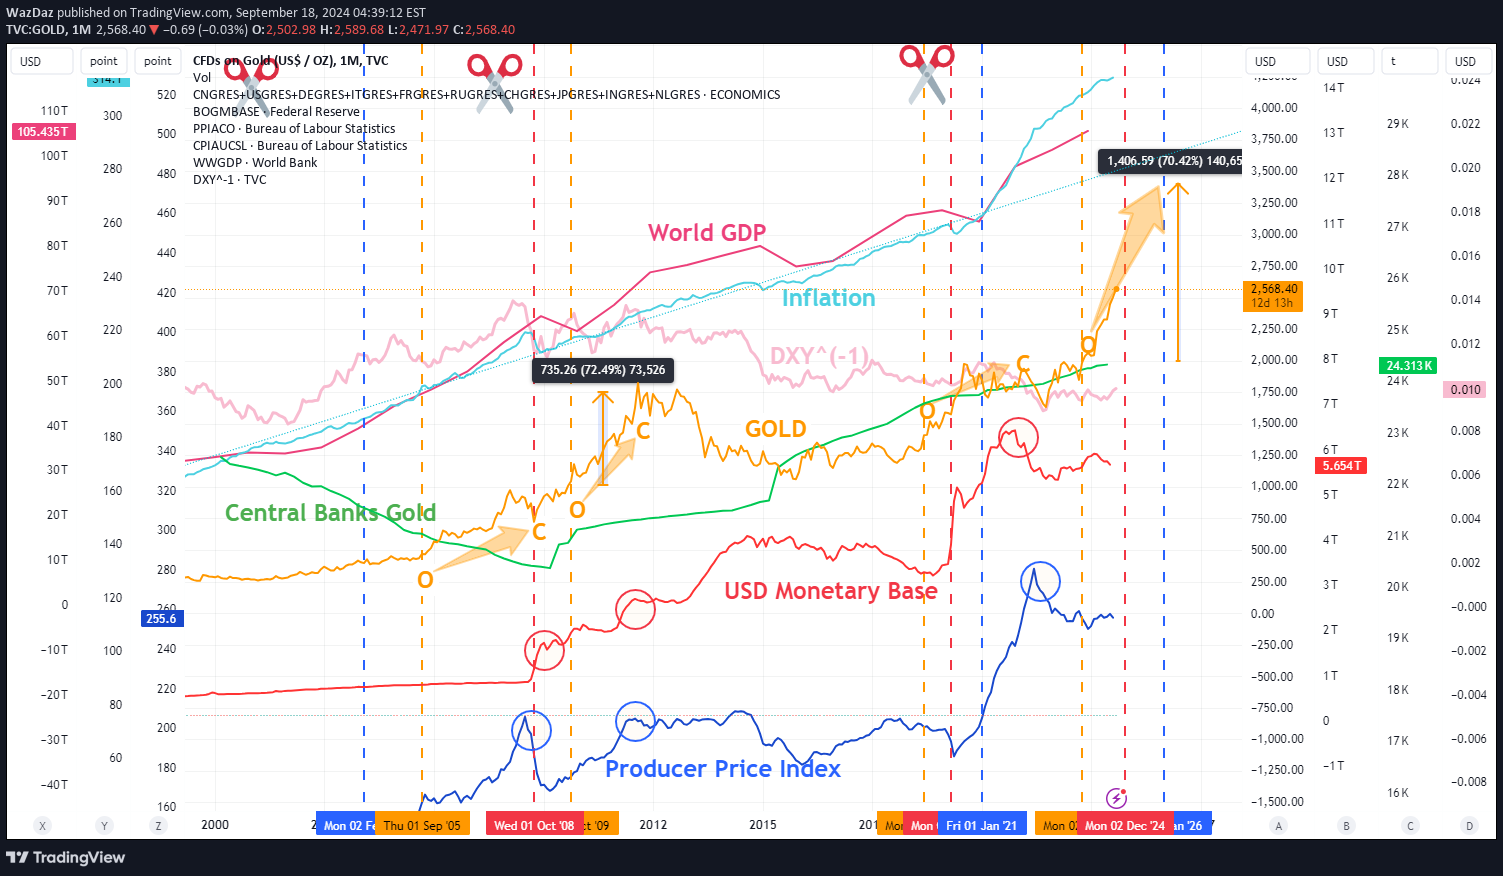
A graph of things relating to gold. I say "relating to" because on many occasions gold moves first and then overshoots. Therefore gold breakout can trigger an open gold trade and tops in 'things' can inform closing the gold trade (I'm talking 1 to 3 year timescales).
WazDaz

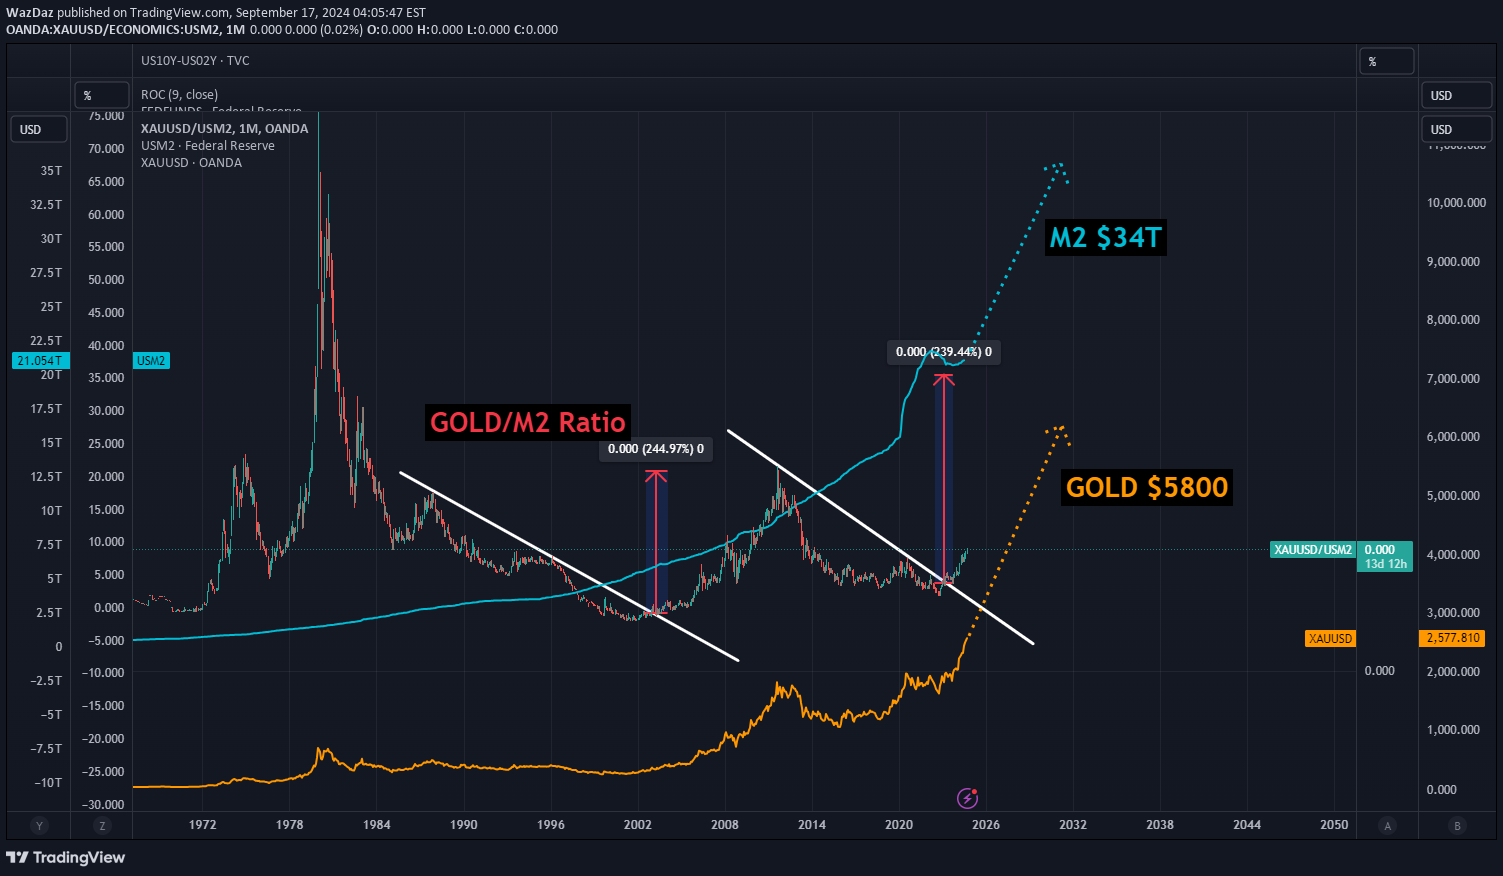
Here I compare the US10Y-US02Y with Fed Funds Rate (and cutting Periods) with Rate of Change in the Money Supply (M2) relative to gold price (post yr 2000). In the last three rate cutting periods US10Y-US02Y increases, Rate of Change in the Money Supply (M2) increases and Gold increases. Next I consider the relationship between M2 and Gold using the Gold/M2 ratio. The last time this ratio broke to the upside in 2003 it rose >200%. M2 moved from 5.959T to 9.508T. The ratio broke up in 2023 at M2 21.151T. If history repeats and M2 increases by a similar scale as the 2003 to 2011 period (8 years), M2 could be 33.748T by 2031. The ratio at its last peak (2011) was 1.7^(-10) and applying this to be 33.748T by 2031 I arrive at a possible gold target of $5770.
Disclaimer
Any content and materials included in Sahmeto's website and official communication channels are a compilation of personal opinions and analyses and are not binding. They do not constitute any recommendation for buying, selling, entering or exiting the stock market and cryptocurrency market. Also, all news and analyses included in the website and channels are merely republished information from official and unofficial domestic and foreign sources, and it is obvious that users of the said content are responsible for following up and ensuring the authenticity and accuracy of the materials. Therefore, while disclaiming responsibility, it is declared that the responsibility for any decision-making, action, and potential profit and loss in the capital market and cryptocurrency market lies with the trader.