
Wavetrendtrading
@t_Wavetrendtrading

What symbols does the trader recommend buying?
Purchase History
پیام های تریدر
Filter
Wavetrendtrading
HBARUSDT
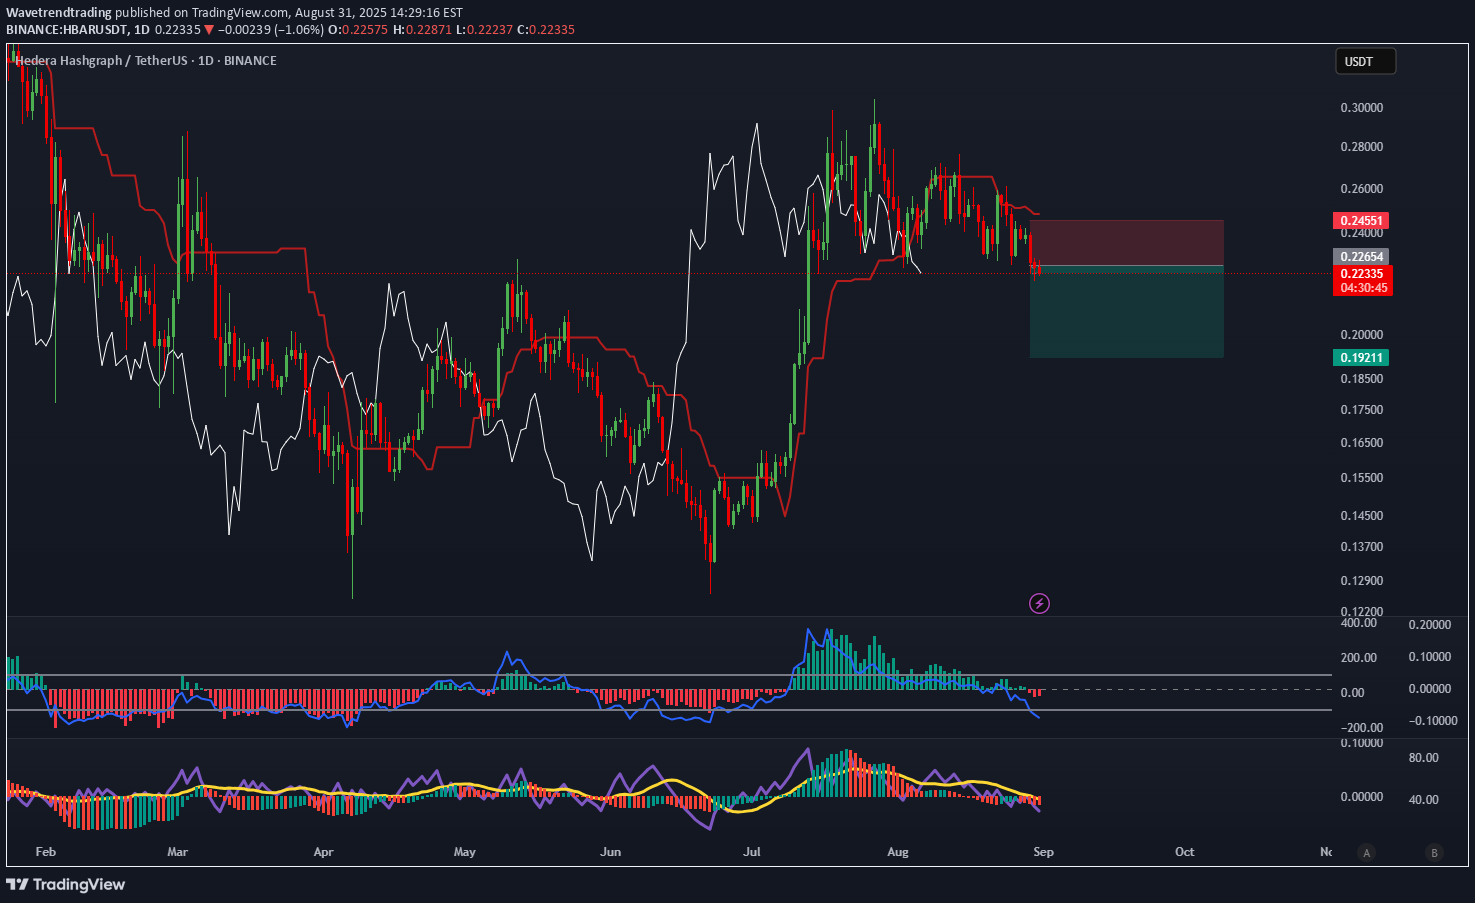
HBARUSDT – Bears in control. 🔵 CCI below –100, 🔴 RVI bearish cross, 🟠 AO red under zero. Ichimoku Lagging Span sits below Kijun and price → confirming bearish structure. 👉 Looking for continuation lower. ⚠️ Not financial advice.
Wavetrendtrading
XRPUSDT
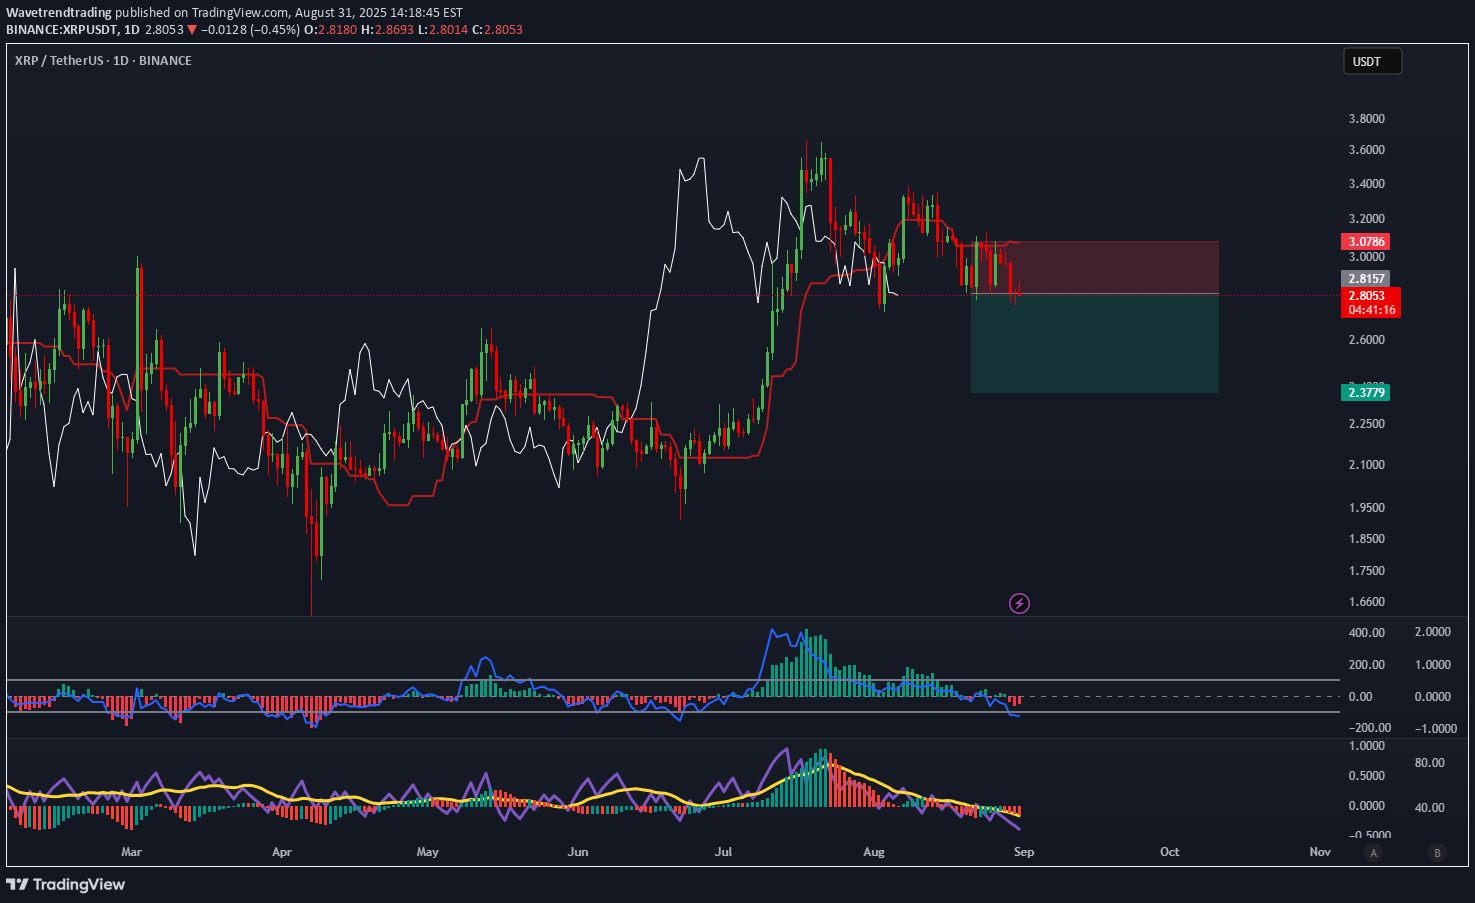
I’m short on XRPUSDT — price and Lagging Span are both below the Kijun, keeping bias bearish. CCI(50) + Bears Power confirm downside stretch and seller control, while RVI + Awesome Oscillator line up with conviction and continuation. 👉 Targeting the 2.37 zone, stops above 3.08. ⚠️ Not financial advice, just my trade plan.
Wavetrendtrading
TONUSDT
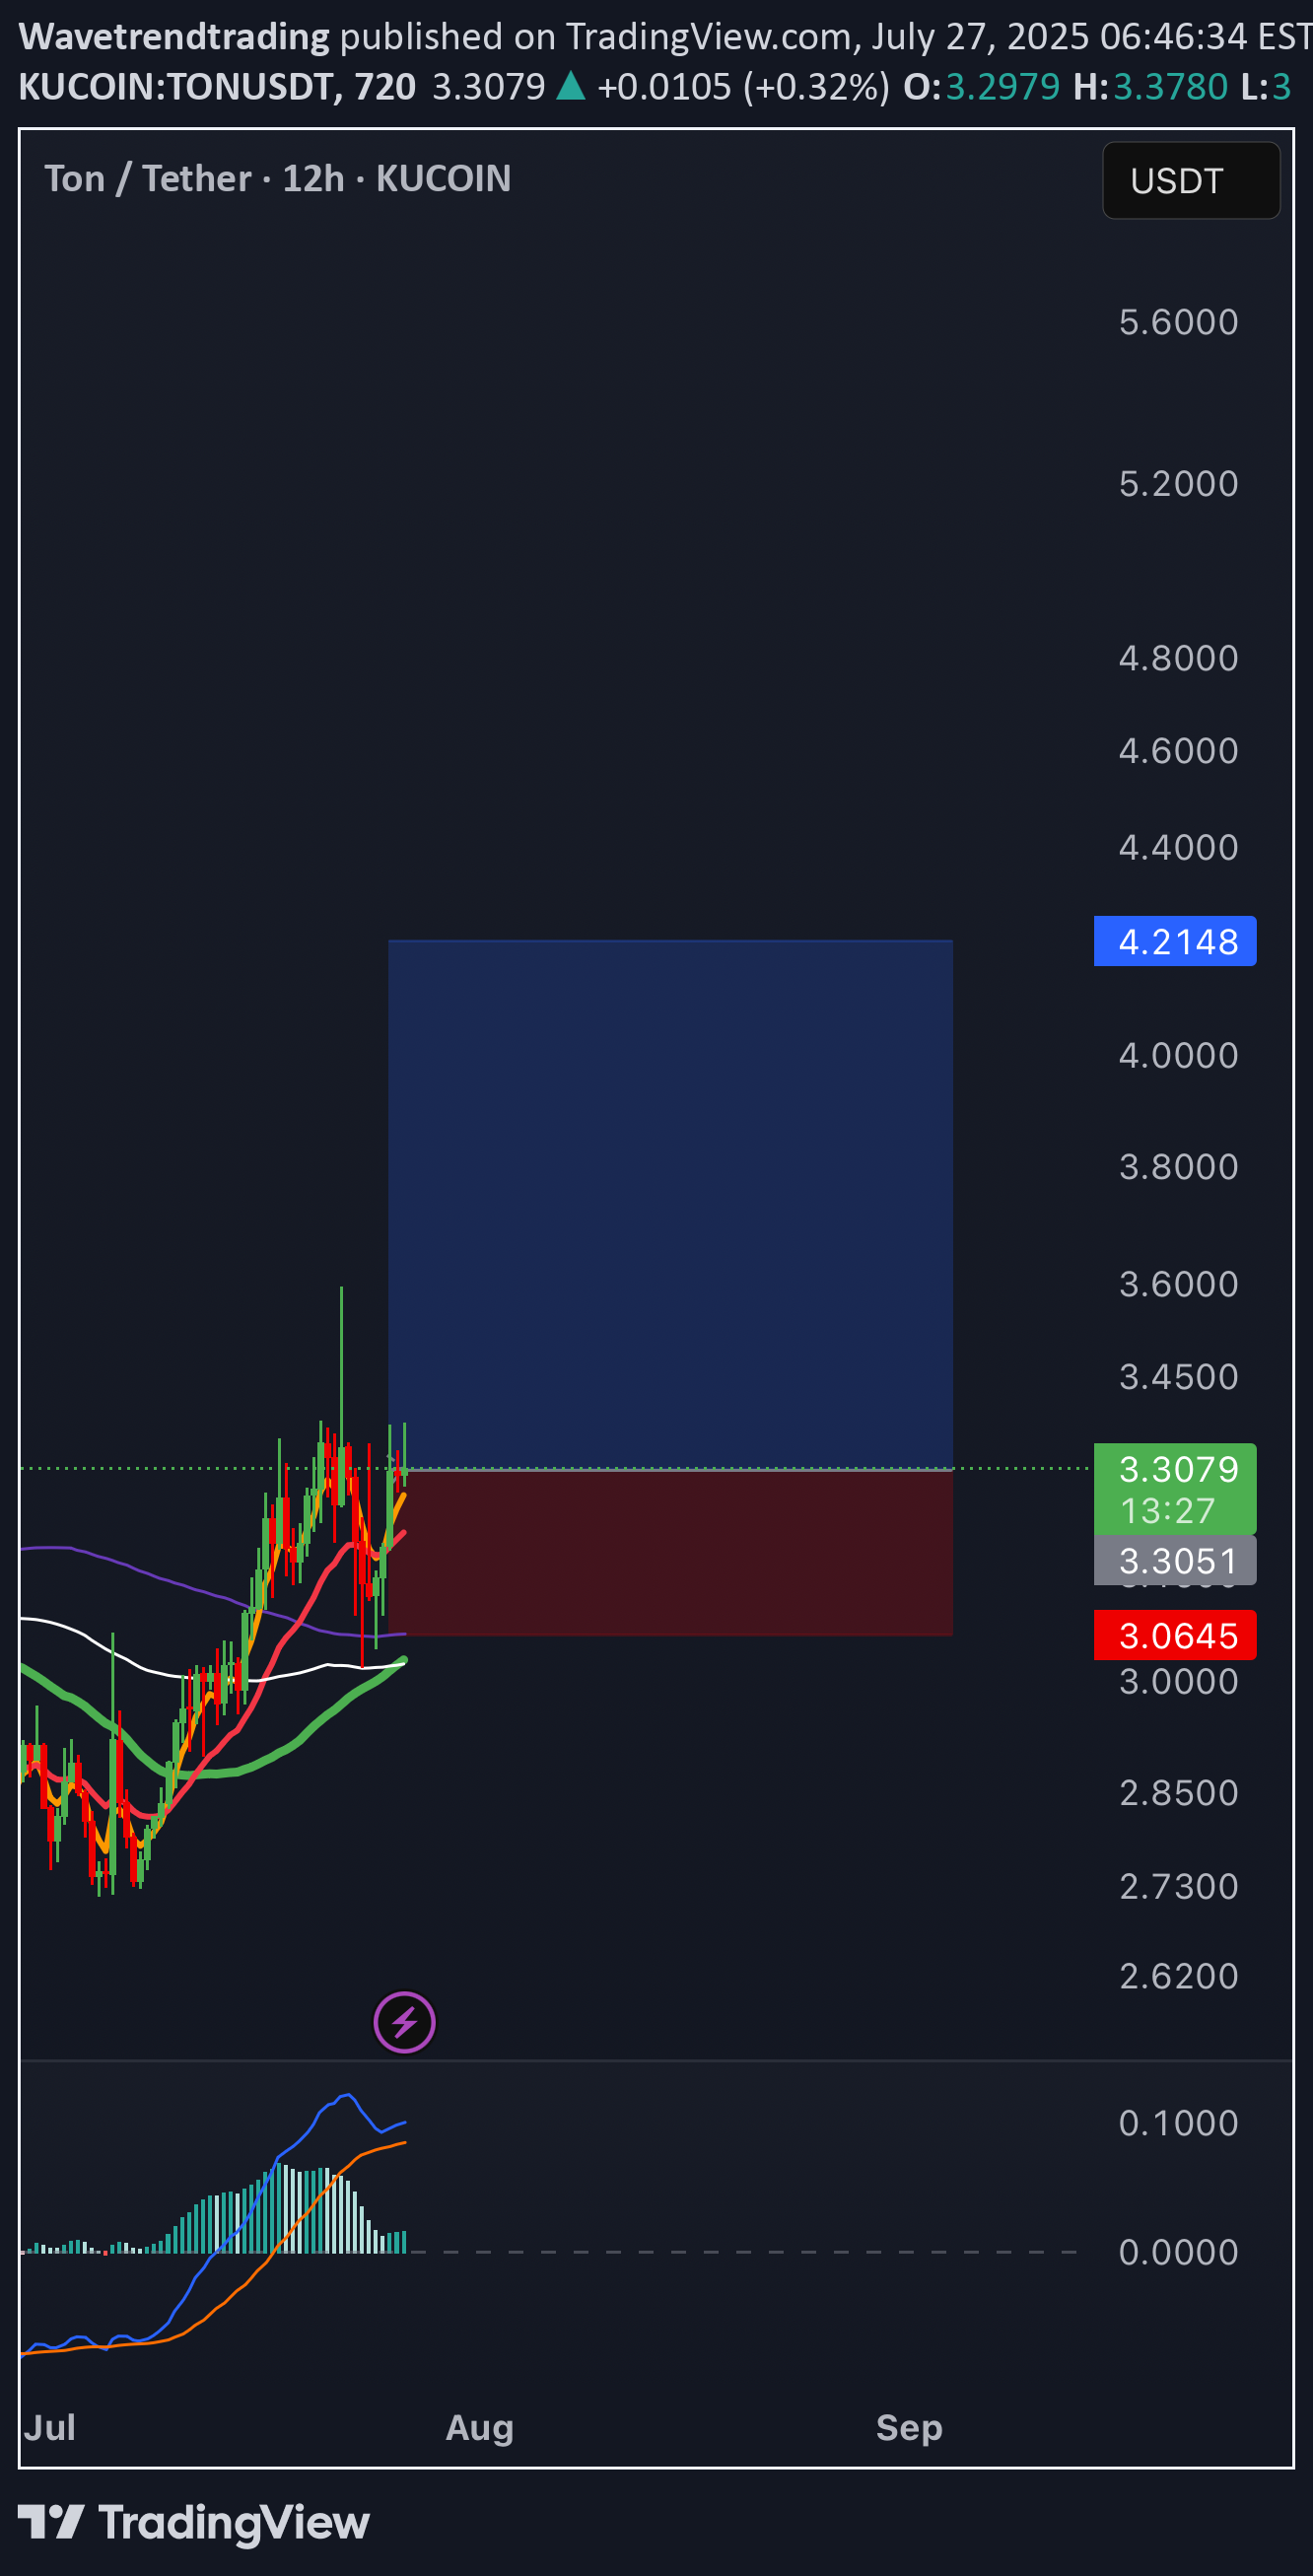
TON is respecting a rising trendline while holding strong above the key SMA stack. The recent pullback found support right at the 55 SMA, showing potential for bullish continuation. Technical Overview •Price trending above the 55/110/220 SMA stack — all sloping upward •Bounce from 110 & 220 SMA confirms bullish control •MACD (20, 50, 21) turning up with histogram above 0 •Volume (TC) shows renewed buyer activity Setup Summary •Bias: Bullish continuation •Entry: From 55 SMA support •Target Zone: 3.77 – 4.20 •Invalidation: Break below 220 SMA or trendline •Trade Style: Swing (1–2 week hold) Tactical Takeaway Clean structure, stacked moving averages, and momentum alignment. No hype — just tactical execution.
Wavetrendtrading
ATOMUSDT

🔻 ATOM/USD – 55 SMA Rejection + Bear Power Pressure Timeframe: H4 Bias: Bearish Entry Type: Confluence Rejection + Momentum Confirmation 🔍 Trade Idea Price has rejected cleanly off the 55 SMA, failing to break through previous structure highs while remaining well below the 800 EMA. The market printed lower highs in a consolidation block before breaking down, suggesting a liquidity sweep followed by seller control. Williams %R is printing below -80, exhibiting bearish crossover behavior, and Bear Power remains negative, indicating continued downward strength. 📍 Technical Confluence 55 SMA sloping downward with direct price rejection Price remains below the 800 EMA (bearish bias confirmed) Bear Power histogram remains red, confirming pressure from sellers Williams %R (100 + 50) both breaking through -80, validating downside momentum TP levels aligned with BB(400) zone support (TP2/TP3) 📉 Execution Plan Entry: $4.26 Stop Loss: $4.70 (above the previous structure rejection & SAR reversal) TP1: $4.00 TP2: $3.70 TP3: $3.54 (aligned with Bollinger Band 400 deviation zone)
Wavetrendtrading
EOSUSDT

EOS/USD Bearish Continuation Setup – 800 EMA Rejection with Structural Confluence 📍 Entry Type: Swing Trade (H4 Chart) 🔻 Position: Short 🛑 Stop Loss: 0.7280 (Above 800 EMA & last impulse high) 🎯 Take Profit: 0.4250 (Prior SAR zone + structure intersection) ⚖️ R:R Ratio: ~3.5:1 📉 Technical Breakdown: Price has cleanly rejected the 800 EMA (black) and is now below both the 55 SMA (red) and 200 EMA (green). The 55 SMA slope has flipped downward — your system’s primary signal for trend confirmation. Bear Power (100) remains negative, reinforcing downside pressure and momentum. Williams %R (50 & 100) just broke below the -80 line again, signaling renewed bearish intent after a brief overbought condition. Parabolic SAR remains firmly above the price, tracking the downtrend. The price is also hovering under a key horizontal resistance level (previous support flip), adding structure-based confluence. ⚠️ Risk Management: Stop is set just above the 800 EMA to account for institutional stop runs or spike traps. TP is aligned with historical structure, a former SAR shift, and psychological round-number support near 0.4250.
Wavetrendtrading
SUIUSDT

SUI/USD Swing Short Setup – Bearish Rejection at 800 EMA 📍 Entry Type: Swing Trade (H12 Chart) 🔻 Position: Short 🎯 Take Profit: 1.04 (Key intersection support zone) 🛑 Stop Loss: 2.45 (Above 800 EMA for structure protection) ⚖️ R:R Ratio: ~3.5:1 📈 Technical Breakdown: Price has retraced into the 800 EMA from below, forming a clean lower high. 55 SMA is sloping downward, confirming a bearish structure and trend direction. Bear Power (100) remains negative, signaling sustained bearish momentum. Williams %R (50 & 100) is rejecting from overbought territory, aligning with downside pressure. The Parabolic SAR has flipped bearish after the retracement, providing additional confirmation. Confluence from multi-timeframe resistance and institutional EMA rejection supports the short bias.
Wavetrendtrading
SUIUSDT

The Chikou Span closed below the Kumo Cloud, confirming a full bearish trend shift, while Williams %R remained in the oversold zone (-80 to -100), signaling strong downside momentum. At the same time, Money Flow Index (MFI) was negative, indicating institutional selling pressure rather than a potential bear trap. With all three confirmations aligned, I entered a short trade, placing my stop-loss just above the Kijun-Sen and Kumo to protect against invalidation. My take-profit target is set at the next major support level, ensuring I capitalize on the momentum while managing risk effectively. 🚀📉
Wavetrendtrading
LINKUSDT

The price has made a decisive move below the 1-day Ichimoku Cloud, signaling a clear shift toward bearish momentum. While the lagging span (Chikou Span) has broken below the price, it has yet to confirm a clean break below the Kumo. This setup represents an early entry to capitalize on potential downside momentum, anticipating that price could accelerate lower. Should the lagging span confirm a clean break below the cloud, I will look to scale into my position, reinforcing the trade with higher conviction as bearish momentum solidifies.
Wavetrendtrading
JASMYUSDT

The price has decisively broken below the 2-day Ichimoku Cloud, signaling a shift to bearish momentum. The Senkou Span A (leading span A) is sloping downward, indicating future bearish sentiment and reinforcing the current trend. The Williams %R is in oversold territory but has yet to show any signs of reversal, suggesting continued bearish pressure. The MFI indicates outflows dominating inflows, confirming that selling pressure is strong and consistent.
Wavetrendtrading
LINKUSDT

The current price is trading below the baseline and key technical indicators such as RSI and Williams %R, signaling a potential shift towards bearish control over the price movement.For earlier entries and more trading opportunities follow; t.me/+cs1G0uryZB02ODAx
Disclaimer
Any content and materials included in Sahmeto's website and official communication channels are a compilation of personal opinions and analyses and are not binding. They do not constitute any recommendation for buying, selling, entering or exiting the stock market and cryptocurrency market. Also, all news and analyses included in the website and channels are merely republished information from official and unofficial domestic and foreign sources, and it is obvious that users of the said content are responsible for following up and ensuring the authenticity and accuracy of the materials. Therefore, while disclaiming responsibility, it is declared that the responsibility for any decision-making, action, and potential profit and loss in the capital market and cryptocurrency market lies with the trader.