
Ugo69
@t_Ugo69

What symbols does the trader recommend buying?
Purchase History
پیام های تریدر
Filter
Ugo69
SOL SHORT TERM
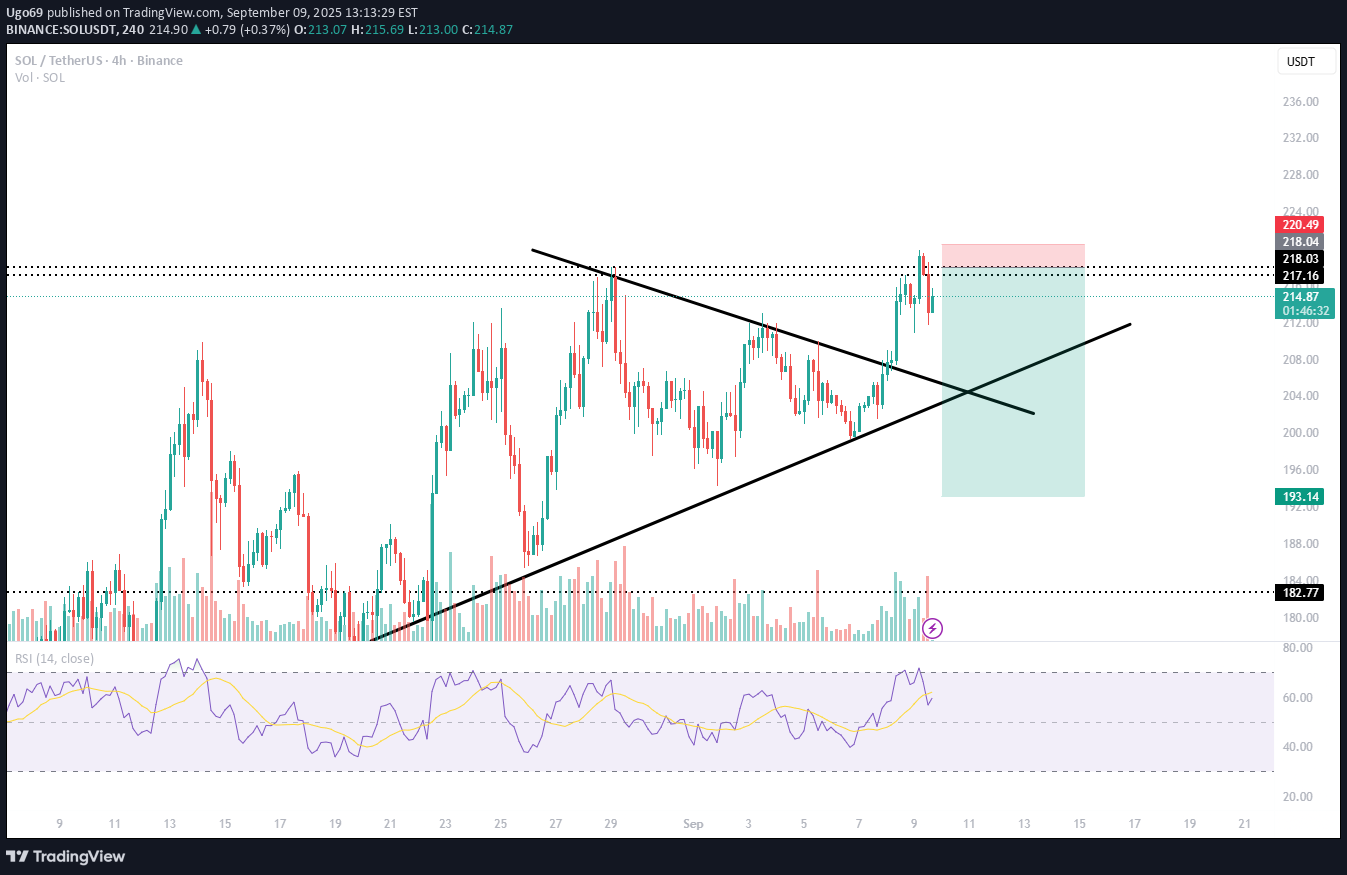
Resistance rejected again... guess what? Resistance to support... of course we're going back down.
Ugo69
short btc
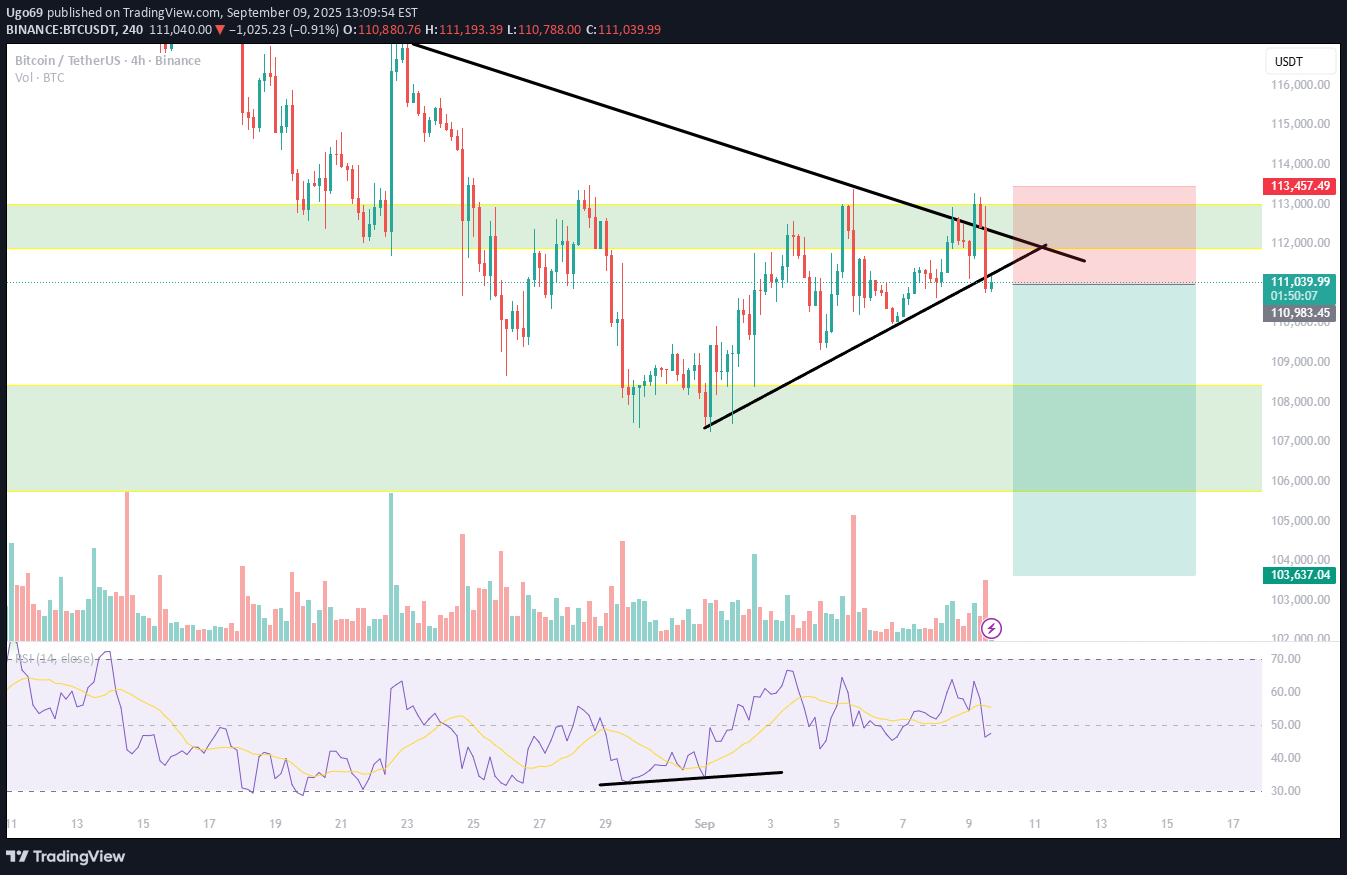
I expect... why? Because it's the month of ghosts and we haven't even broken through the $112,000 barrier... resistance rejected and we're going down, simple as that.
Ugo69
sol idea
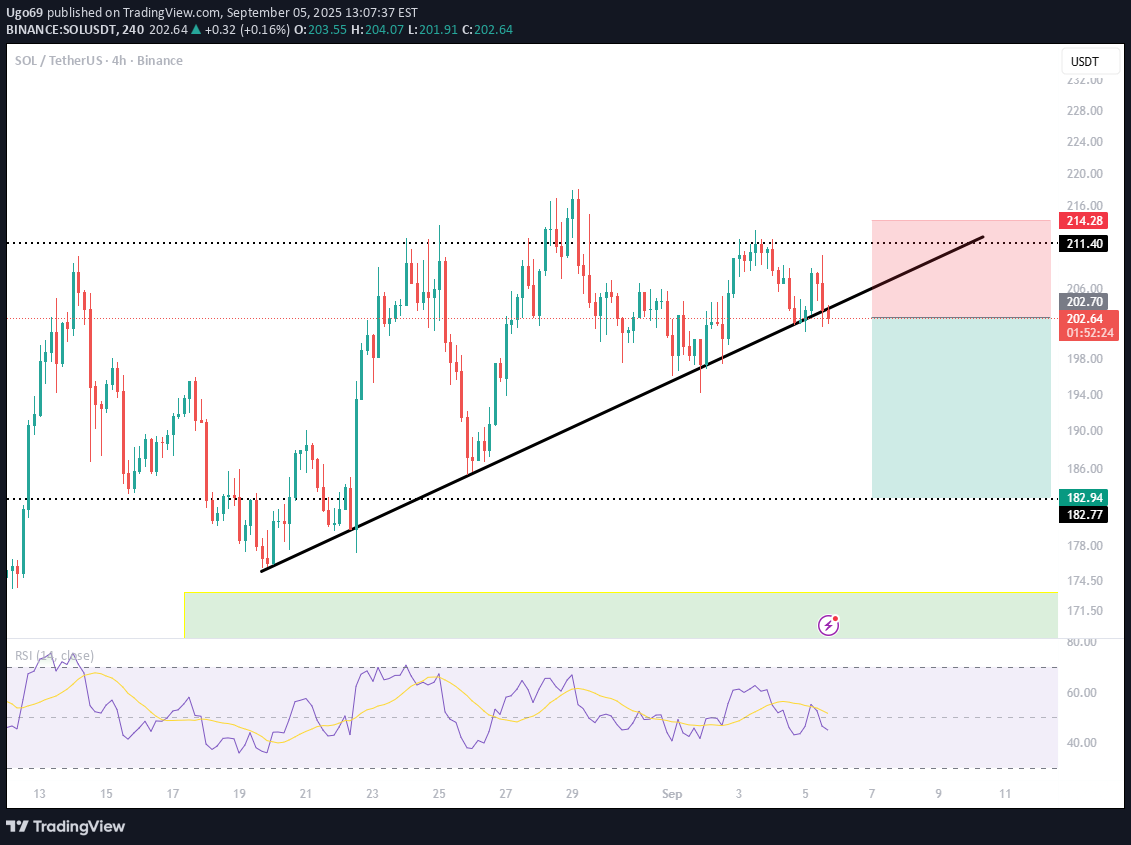
I like this chart. We can see HL and maybe LH? A trend reversal? We'll see.
Ugo69
sei pump incoming
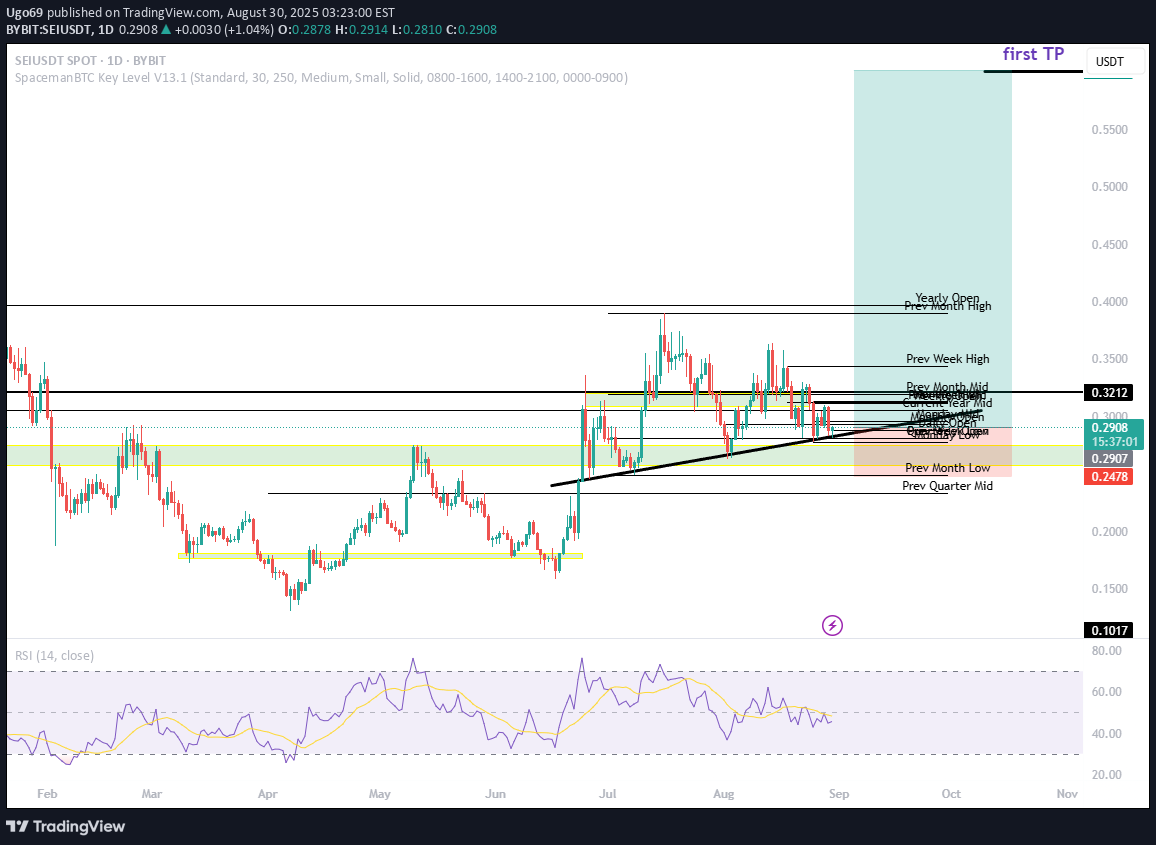
I believe it will be a good rally... It looks so great on the daily chart... I'm spot long and expecting $0.4 +.
Ugo69
small long

I like this level here... RSI bullish, double bottom... Next stop 4500?
Ugo69
eth short?

Even though Ethereum is so strong, I would like to see it reach $4,500 again and then go up to $7,000. If not, I am willing to lose a little capital.
Ugo69
ethereum very bullish

Ethereum is finally starting to show its worth. It has received so much hate, but it will skyrocket again. Get ready.
Ugo69
bullish divergence double RSI + double

Watching a classic Daily Double Bottom forming with confirmation from RSI. W pattern on price + RSI alignment makes this setup worth watching. double bottom + double RSI bottom is very strong = bullish divergence
Ugo69
Ethereum action

I would believe that... we took liquidity from August 11.8... right at Monday's low... and I think we're going for 5k +... but I'll be careful at 5k because it's such a psychological price... watch out for that. good luck my people
Ugo69
SEI PUMP incoming

Disclaimer
Any content and materials included in Sahmeto's website and official communication channels are a compilation of personal opinions and analyses and are not binding. They do not constitute any recommendation for buying, selling, entering or exiting the stock market and cryptocurrency market. Also, all news and analyses included in the website and channels are merely republished information from official and unofficial domestic and foreign sources, and it is obvious that users of the said content are responsible for following up and ensuring the authenticity and accuracy of the materials. Therefore, while disclaiming responsibility, it is declared that the responsibility for any decision-making, action, and potential profit and loss in the capital market and cryptocurrency market lies with the trader.