
UNRPP
@t_UNRPP

What symbols does the trader recommend buying?
Purchase History
پیام های تریدر
Filter
Signal Type
UNRPP
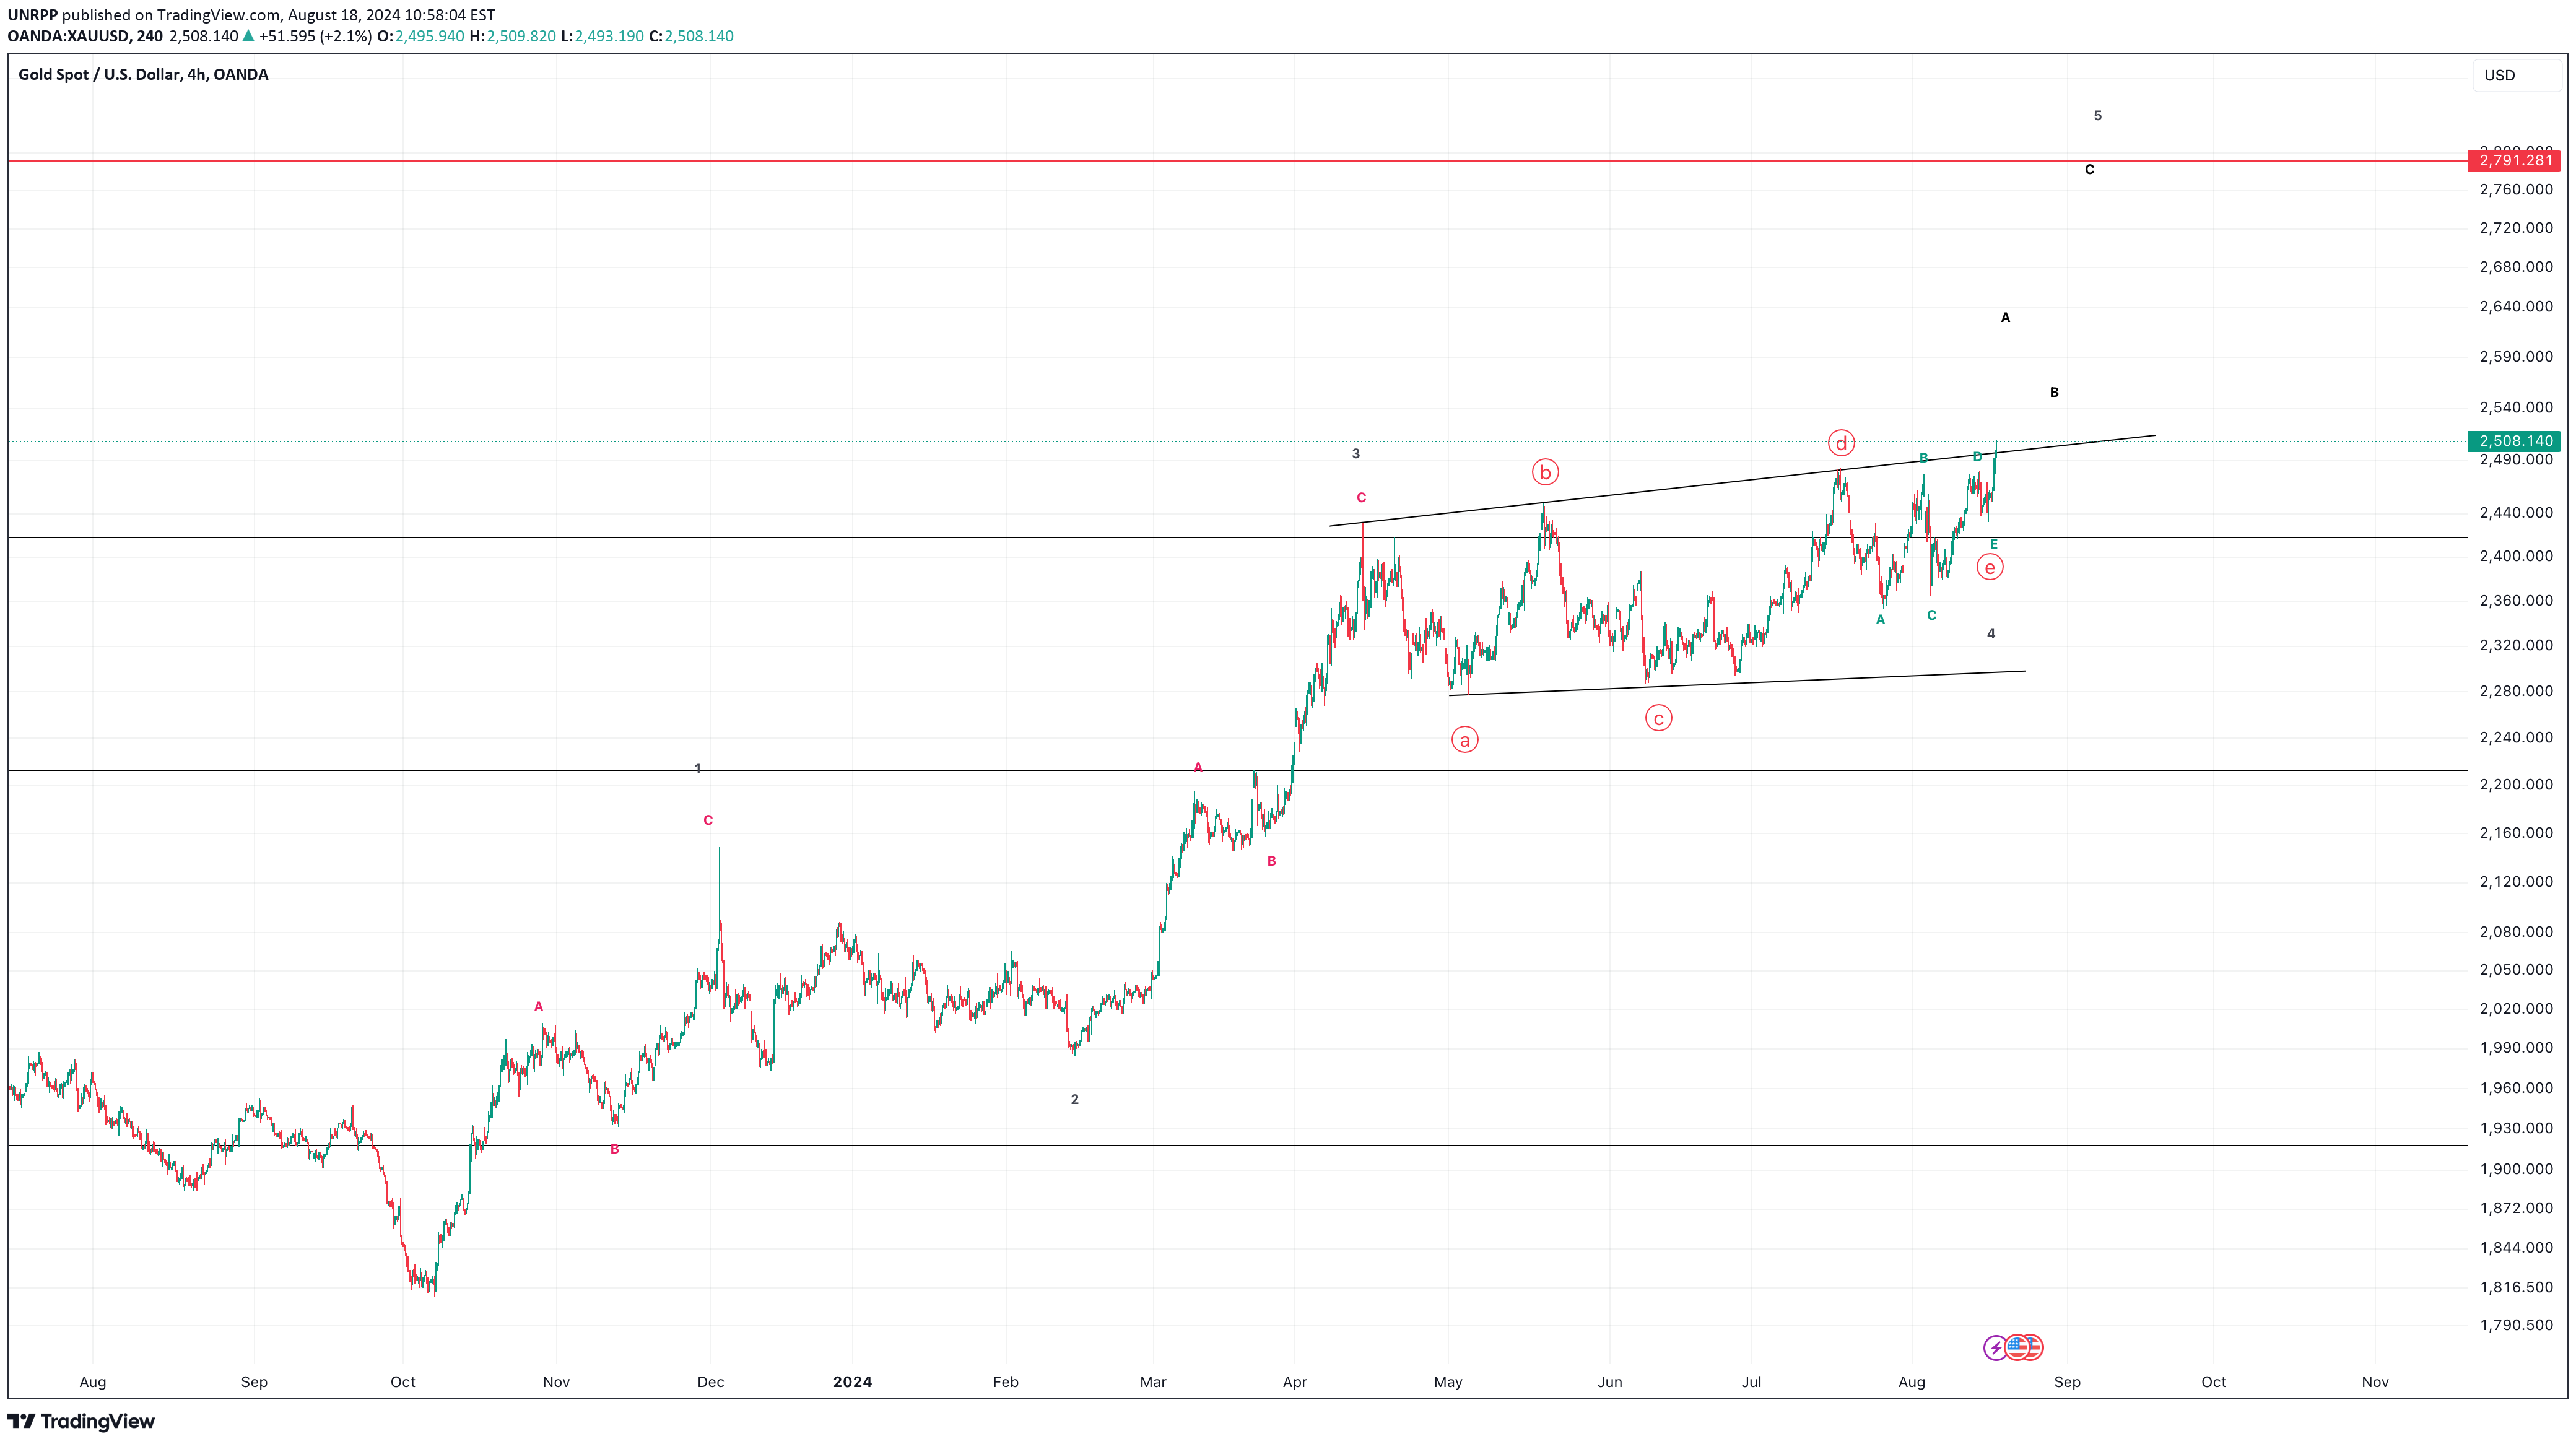
Last week gold completed its 4th wave expanded triangle which E wave forming a complex "abcde" as depicted in the picture. This is valid according to wave theory that E wave of triangle or Y wave of complex correction could extend into another set of "abcde" pattern, each leg containing 3 waves. Price move to new all time high confirms the completion of expanded triangle and now it should move t 2800 where it is 1.618 fib from previous 2011 high. As I said before in previous idea, as long as price is above 1.382 fib around 242x, it should find its way to 1.618 fib. Invalidation point: 2450 1st Target: 2530-2550 2nd Target: 2650-2670 Last Target: 2790-2810 See also my previous idea below.Now the SL have been moved to 2497
UNRPP
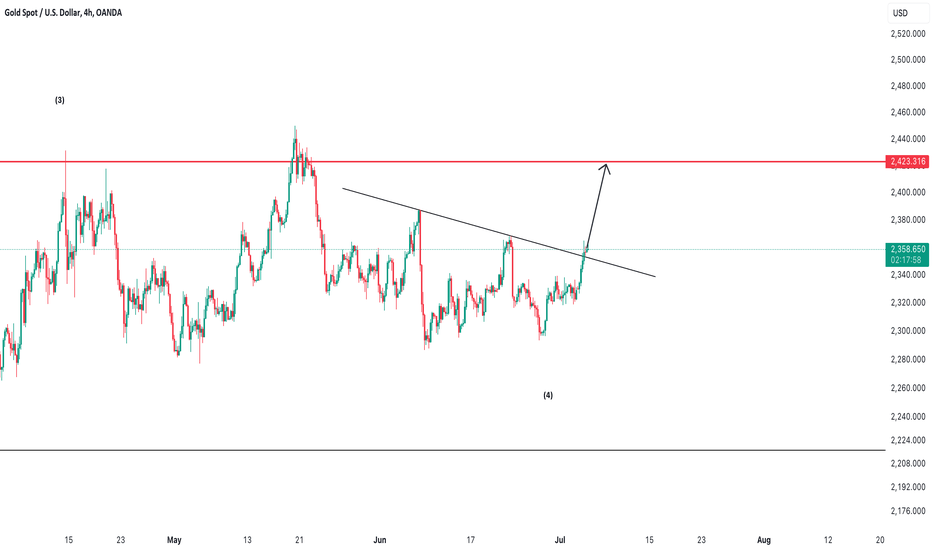
This look like inverse head and shoulder pattern which is already broken out to the upside Short term target is around 80 usd which give target around previous high at 2420 This is short term trade idea; See my detailed analysis on gold below in the related idea section :)Target hit nicely.
UNRPP
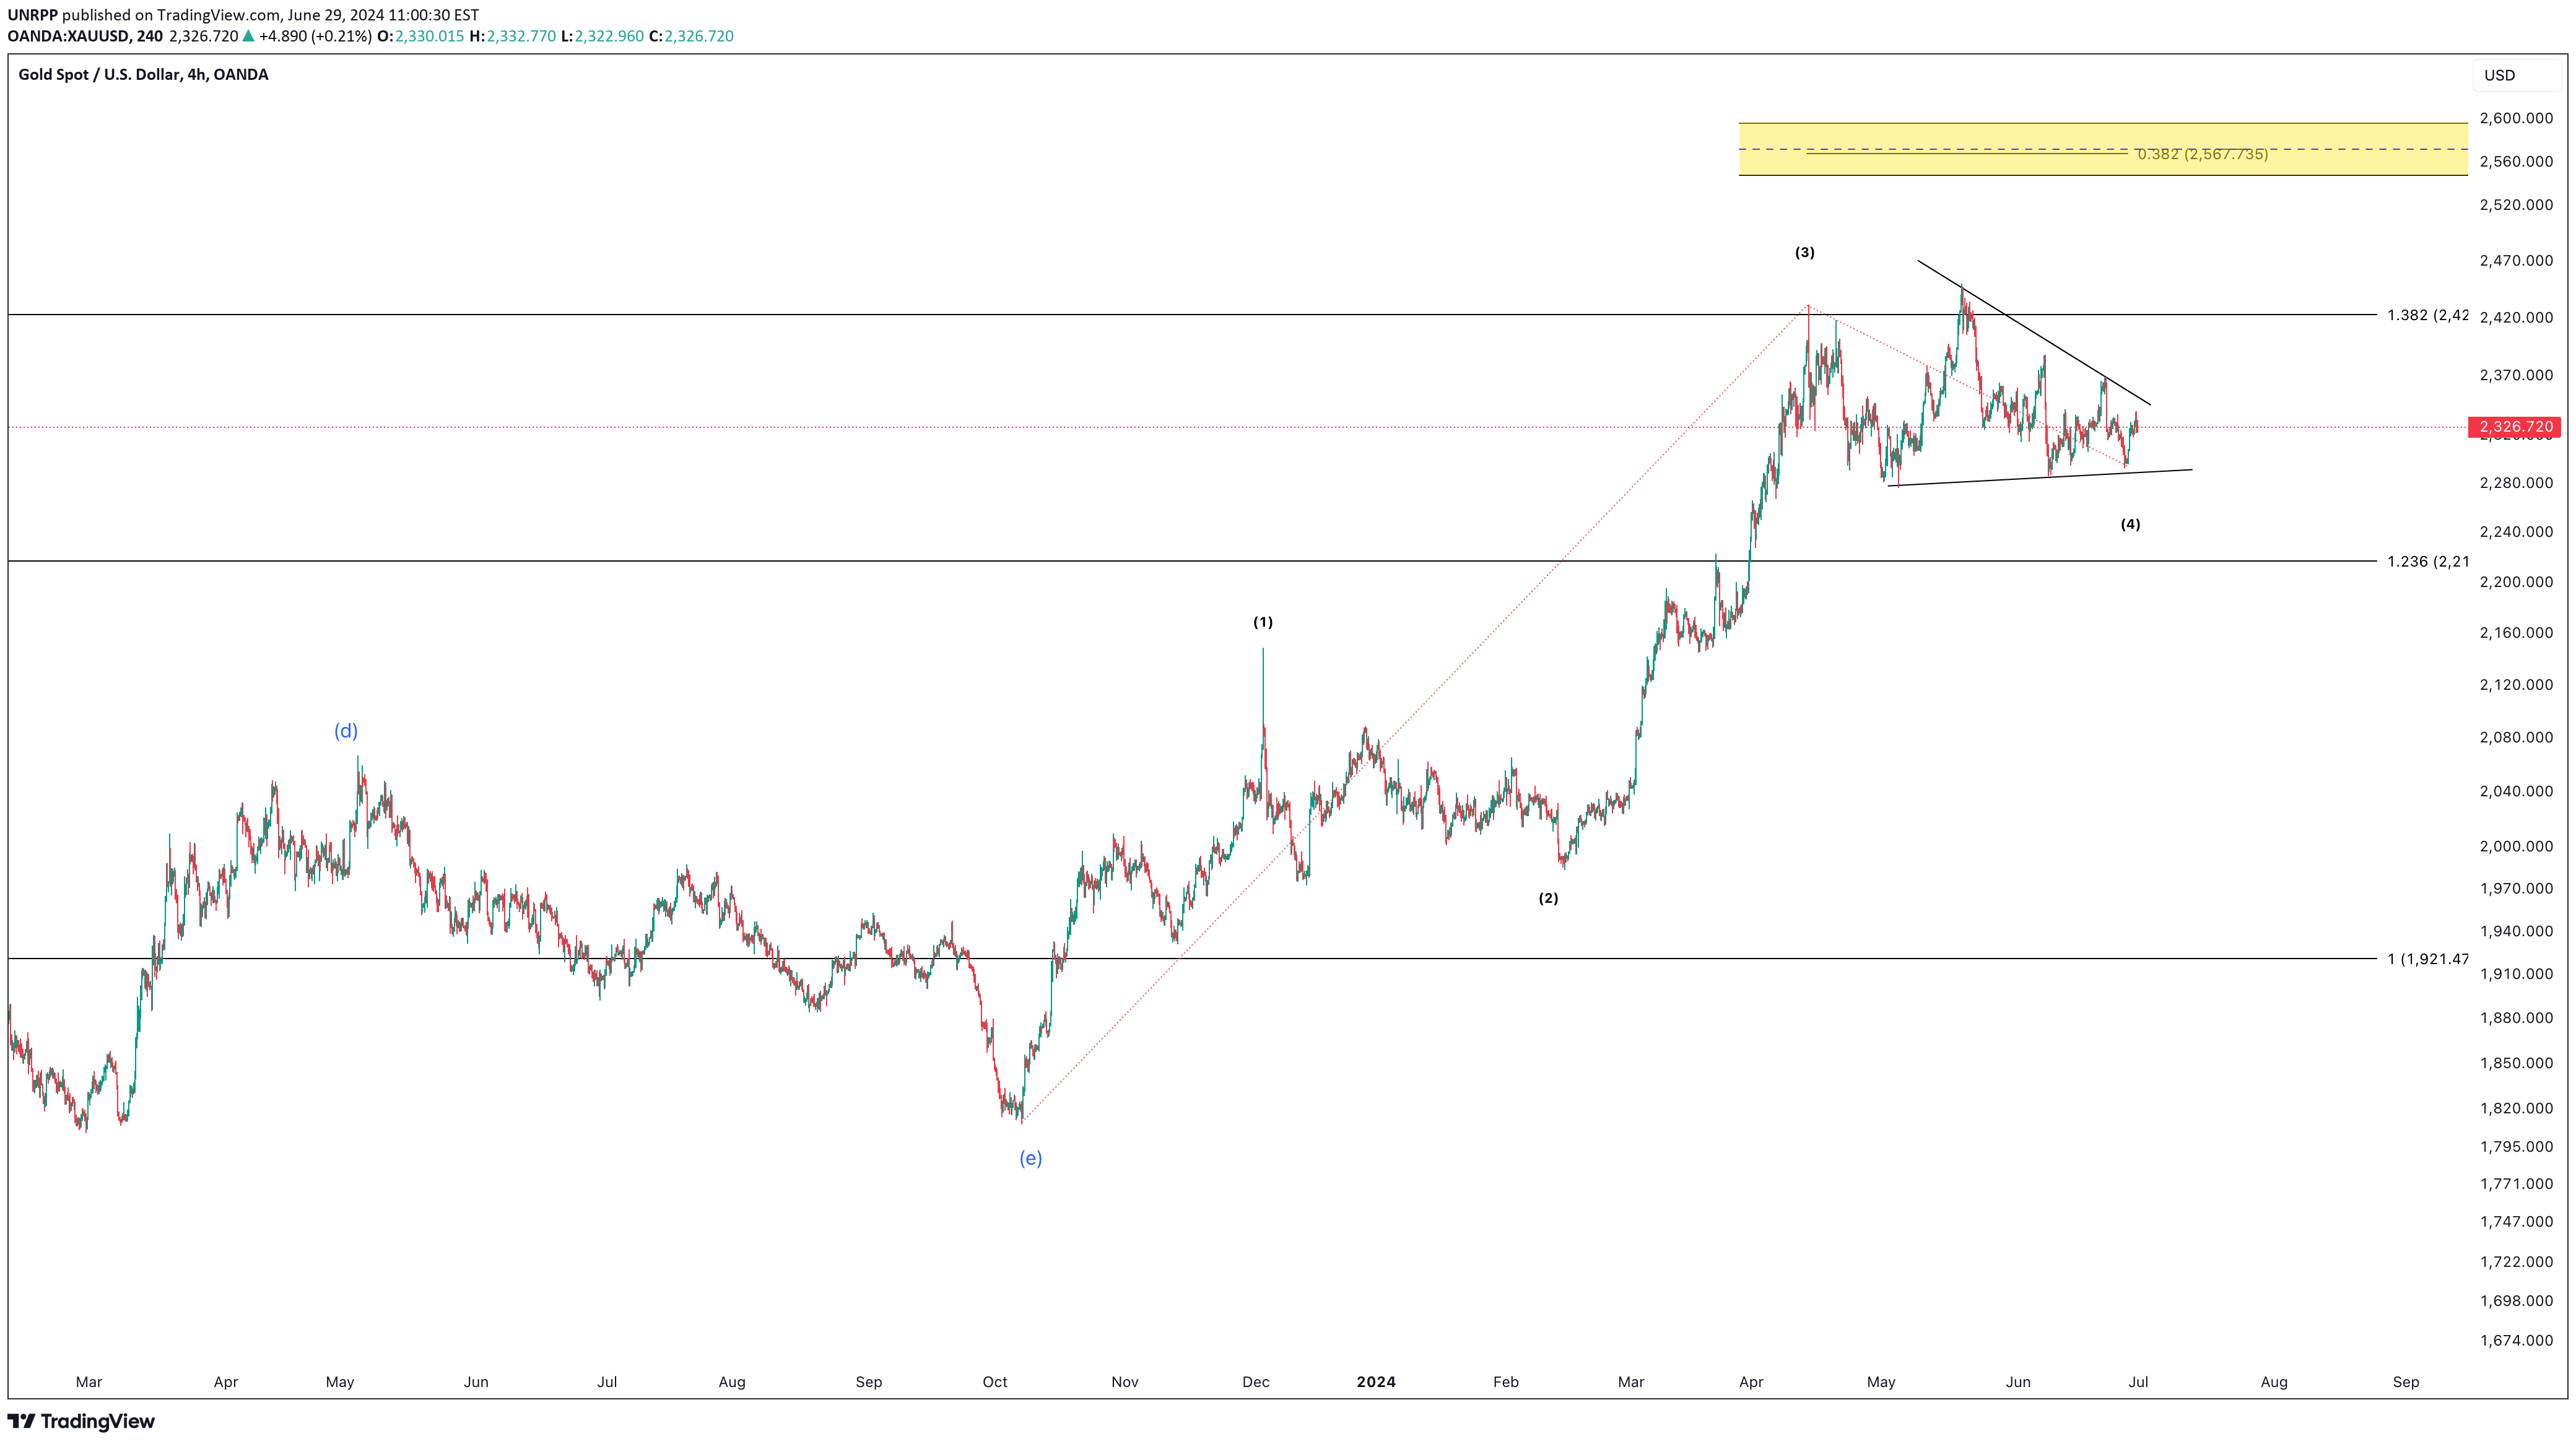
After surpassing its previous ATH of 2011, gold has been in an uptrend. Normally in technical analysis, if price breaks out of its base, especially large base like we have seen in gold, there is a saying "the larger the base, the higher in space". But, how high? Price target with Fibonacci level Typically the target set by using fibonacci projection would yield the target at the following level: 1.618 2.618 and 4.236 Since price wouldn't move in straight line, one should expect resistance along the way. Between the previous all-time-high (fib level 1.00) and 1.618, the significant resistance level can be expected at 1.236 and 1.382 level (happened so many time for each instrument in any timeframe) Looking at chart right now, gold met its resistance right at 1.382 level around ~2420. Deep correction vs sideway correction When met with resistance, the instrument either resolves it through 1) price (fast, deep price correction) or 2. time (frustrated sideway correction) So, theoretically speaking, gold should be heading to at least 1.618 fib target of 2011 ATH at ~2800 usd eventually. Elliott wave perspective I won't go into the very detailed wave count, only recent price action during covid. From here, if the uptrend is valid, there should be 5 wave up. Now, I counted 3 waves up and then gold hit 1.382 level at 2420. Since then, it as been moving sideway. From the chart you can see that the 2nd wave corrected for 72 days, and now assuming we are in the triangle 4th wave, we price has been correcting for 76 days. According to the wave theory, 1) Triangle can occur as 4th wave 2) Wave of the same degree should be similar in size (time it takes in correction) The correction may be over and the 5th wave is underway with price target around 2,750 - 2,800 Other consideration: Expect some selling pressure at ~2550 since we have some fibonacci confluence zone around that level Short term invalidation point is if price break below 2290There is a resistance of fib level 2.00 around 2325. If price can decisively close above 2325 I think gold will continue its uptrend.Price action looks promising... Let's see how it turns outWave 2 is finally over, imo should move up nowThe correction should be almost over now, confirm when price go above 2336 or below 2318Nice! Expect the resistance around 1370sI’m adjusting the wave count. I think this looks more promising. I’m looking to go long again if price stabilize around 233xSo, the D wave is probably a flat 3-3-5. and now this should be the last corrective wave EThe large resistance should be around 2530-2550
UNRPP
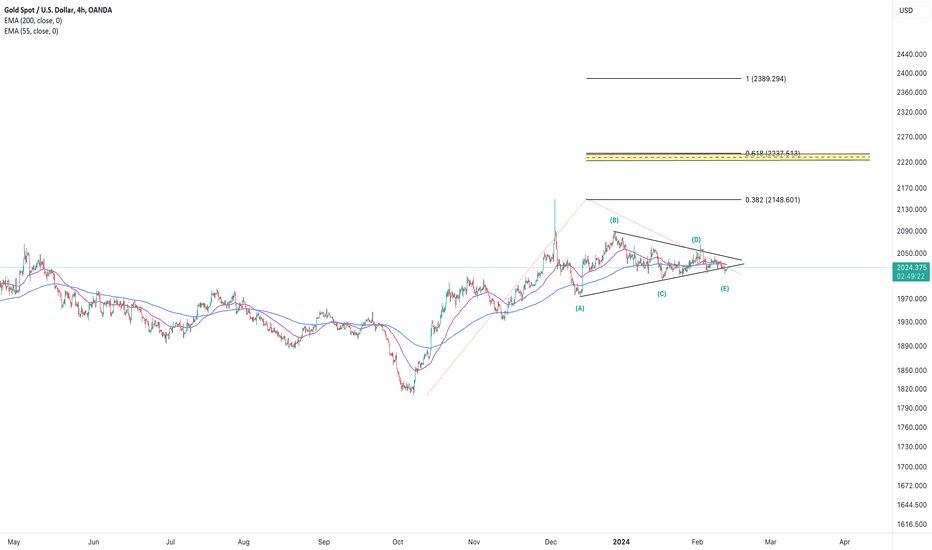
After the all-time-high in december, i've been following the price and it is possible that each leg has 3 wave count. Last night, price broke down to 2012 level. This could be an undershoot of E wave of triangle with E wave forming complex correction pattern If the price does not go under 2012 this could be a start of the next move up to 2200-2300 area
Disclaimer
Any content and materials included in Sahmeto's website and official communication channels are a compilation of personal opinions and analyses and are not binding. They do not constitute any recommendation for buying, selling, entering or exiting the stock market and cryptocurrency market. Also, all news and analyses included in the website and channels are merely republished information from official and unofficial domestic and foreign sources, and it is obvious that users of the said content are responsible for following up and ensuring the authenticity and accuracy of the materials. Therefore, while disclaiming responsibility, it is declared that the responsibility for any decision-making, action, and potential profit and loss in the capital market and cryptocurrency market lies with the trader.