
TrendDiva
@t_TrendDiva

What symbols does the trader recommend buying?
Purchase History
پیام های تریدر
Filter
Signal Type
TrendDiva
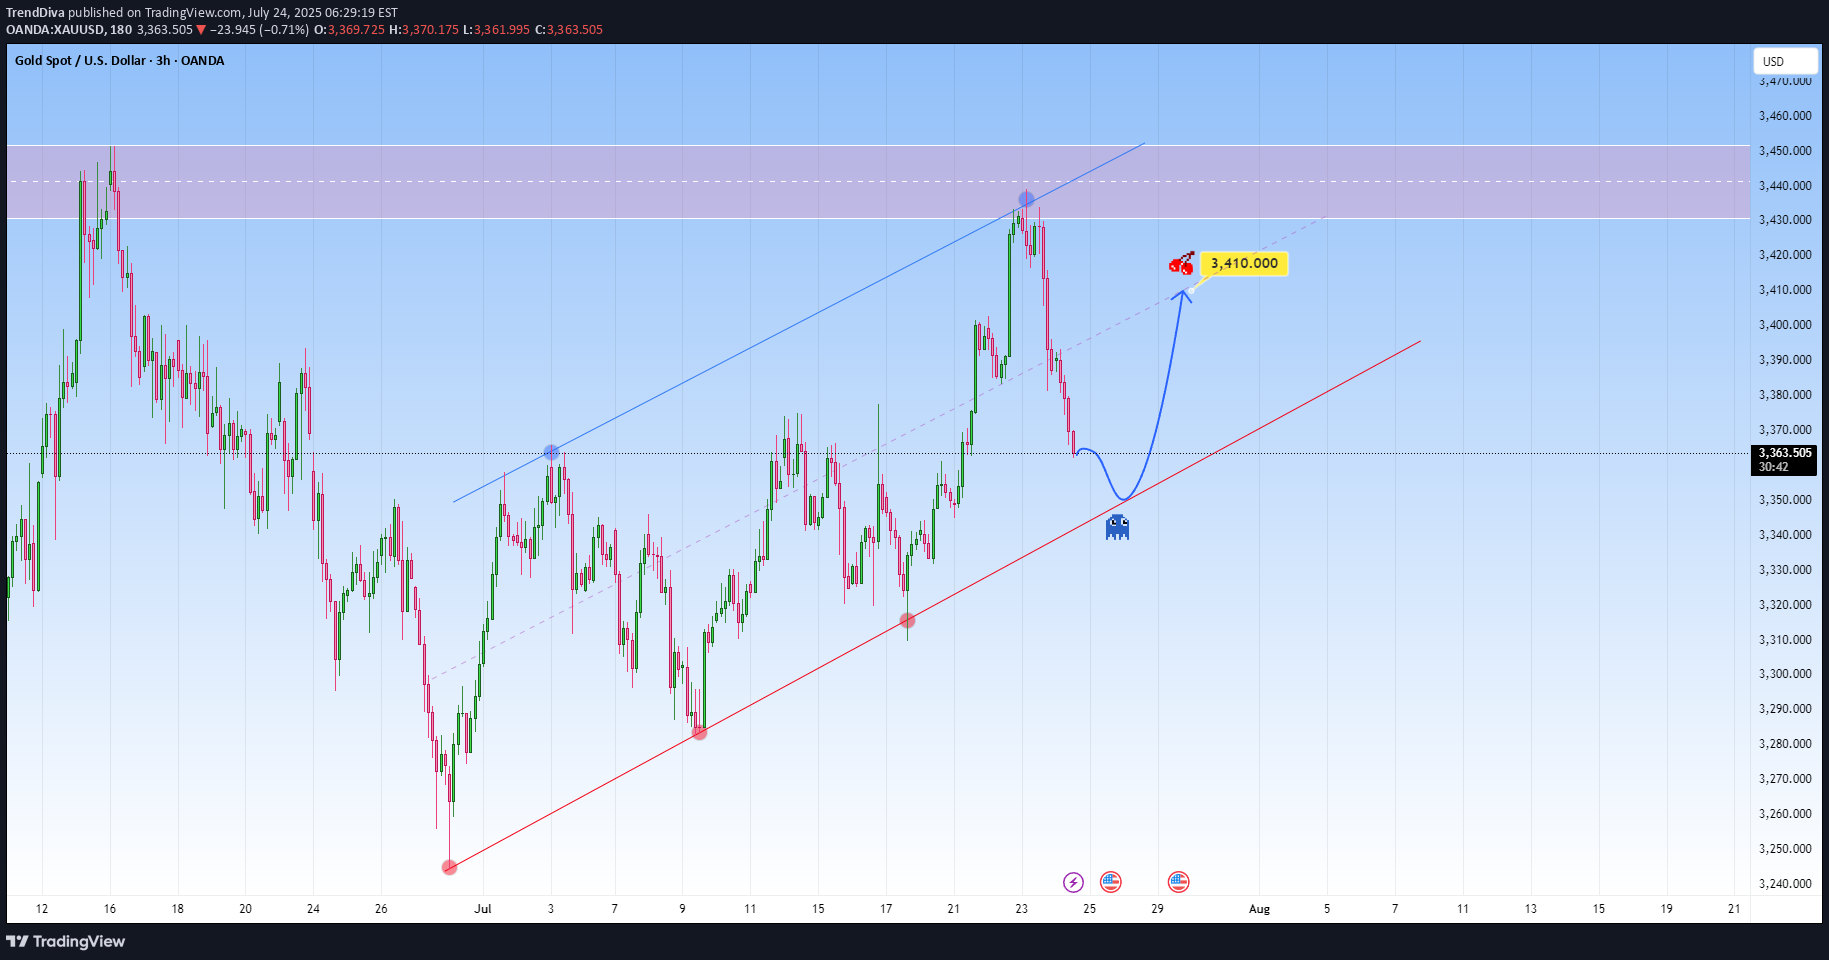
From a technical perspective Gold is climbing in a parallel channel, clearly bullish with a rhythm that’s hard to ignore. Price just bounced off the resistance with force, a classic overextension flush. And the market is now approaching the lower boundary of this projected channel. This confluence of technical support is likely to attract renewed buying interest. I expect it to bounce back toward 3,410, somewhere around the middle of the channel. The move up may not be determined right away. It could be consolitaing, fake dips first, or sudden acceleration.Watching the level around 3.325 for any bullish confirmation, will see from there
TrendDiva
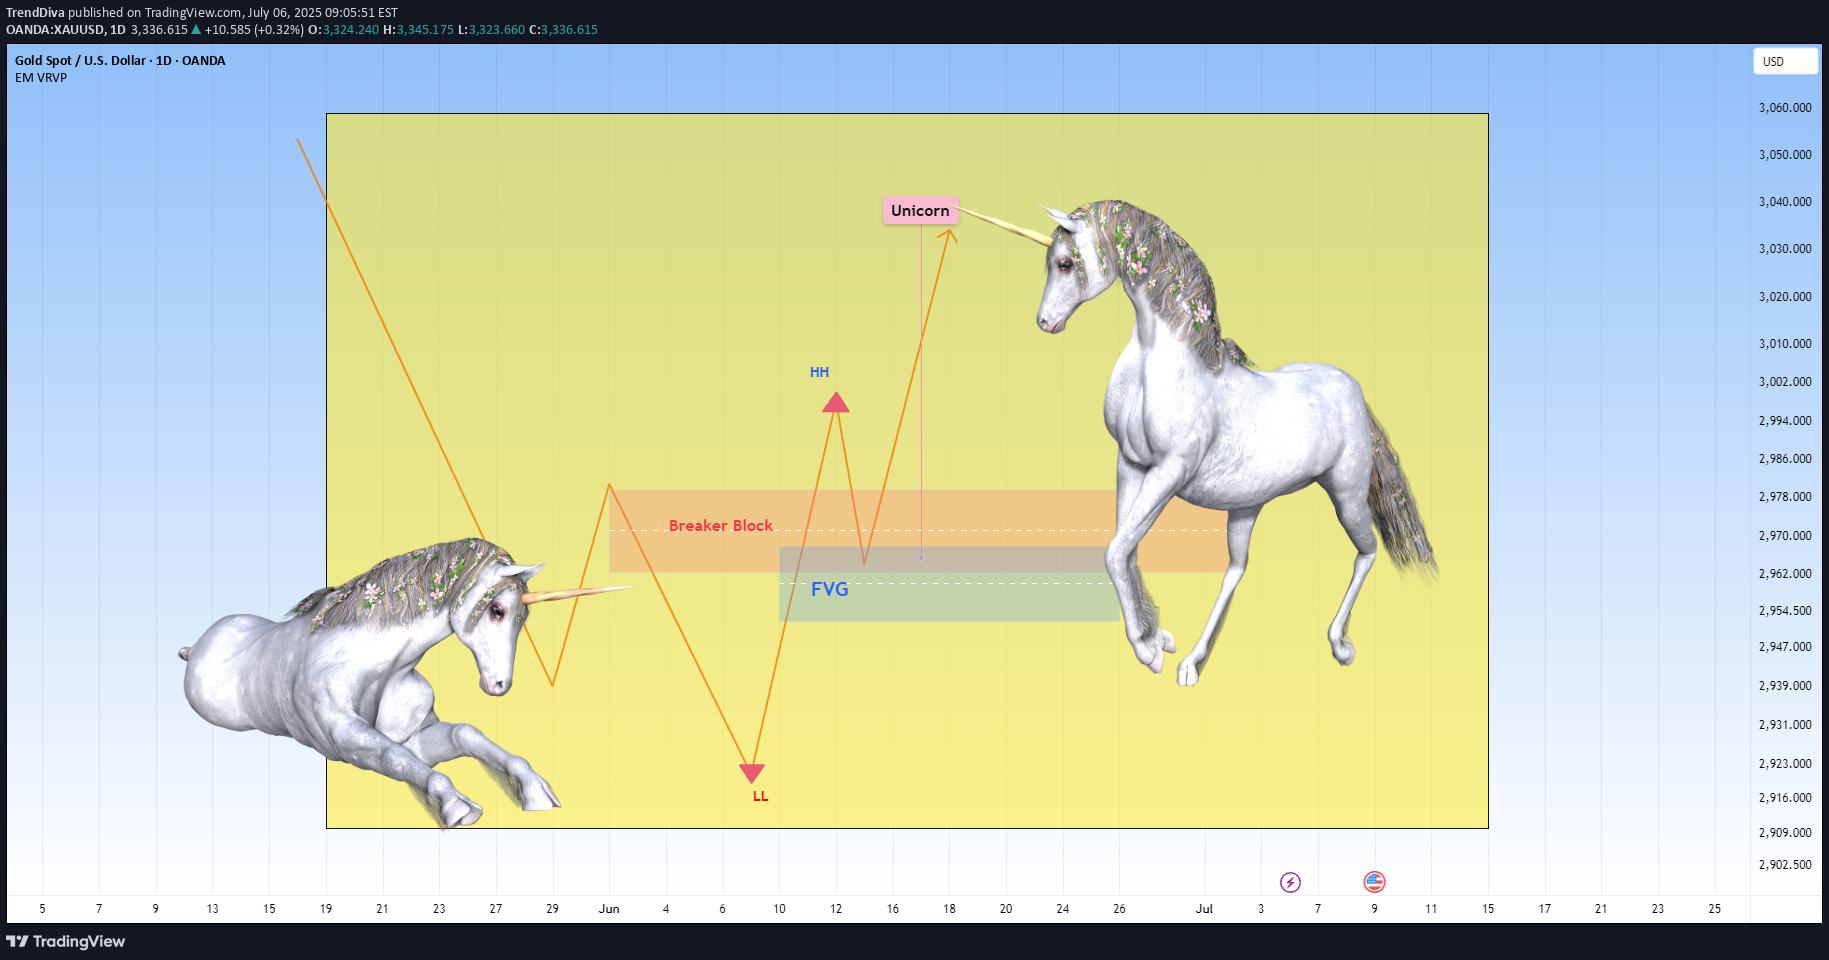
🦄 The ICT Unicorn: The Most Powerful Setup in ICTAmong all the concepts of ICT, the Unicorn setup stands out as the ultimate precision entry model, it’s confluence perfected. Why? Because it merges two of the most potent ideas in ICT theory: Breaker Blocks and Fair Value Gaps into a single zone. This combination creates the most high-probability, sniper-level setup in the entire ICT playbook. Why It’s the Best you think? Most ICT setups (like simple FVGs, order blocks, or liquidity sweeps) offer high-probability trades on their own, but the Unicorn setup stacks the odds in your favor by combining multiple layers of confirmation. This makes it the most disciplined and rewarding entry model for traders who rely on market structure.Core Concepts ExplainedA breaker block is a former order block that gets invalidated when price breaks structure, then acts as support or resistance upon a retest. It’s a sign of a shift in market intent, from bullish to bearish or vice versa.A fair value gap (FVG) is a three-candle pattern where a sudden price move creates an imbalance, a "gap" between the wicks of the first and third candle. Price often retraces into that gap before continuing its trend.When these two concepts overlap, a breaker block and a fair value gap in the same zone, it forms the “unicorn” setup. It suggests a strong level where liquidity has been taken and institutions may re-enter.How the Setup WorksFirst, you identify a market structure shift, like a break in a previous high or low. Then look for the breaker block left behind by that move. Within that block, check if there’s a fair value gap (the imbalance zone). When price retraces back into that confluence zone, wait for a reaction, often a strong reversal or continuation.Entry is usually taken when price shows rejection within the zone on a lower timeframe. Your stop-loss goes just beyond the breaker block, and your target can be the next high/low or a logical liquidity pool.Example of a bearish Unicorn Model:Best Conditions to Use ItThis setup works best when used in line with the higher timeframe trend. Many traders analyze structure on the 1-hour or 4-hour chart, then drop to 5-minute or 15-minute charts to enter. It’s commonly used in forex and indices but also works well in crypto or commodities.Avoid using it during news events though. Like all ICT concepts, it requires patience and practice to identify clean setups and avoid forcing trades.Example spotted on a Gold setup:ICT Unicorn Model was first introduced in 2022, primarily applied to the Nasdaq 100 (NQ) and S&P 500 (ES). What stood out immediately was its precision, the kind of clean structure and consistency you don’t often find in most strategies.As it was tested further, it was clear this wasn’t just for indices. The model transitioned beautifully into forex, especially on major pairs like GBP/USD and EUR/USD, delivering sharp entries as well.I also tested it on metals like gold (XAU/USD) and silver (XAG/USD), as well as the Dollar Index (DXY), and the results spoke for themselves. Even in crypto, where volatility is the norm, the Unicorn setup held its ground.It’s rare to find a trading model that adapts across markets this well. Final ThoughtsThe ICT Unicorn is all about confluence and precision. You’re not trading every breaker or every FVG, only the ones that align, especially with a clean shift in structure. When used with proper risk management, it can be a high-probability setup in your playbook.The unicorn model met with market indecision in the GOLD market, patience required until more certainty.
TrendDiva
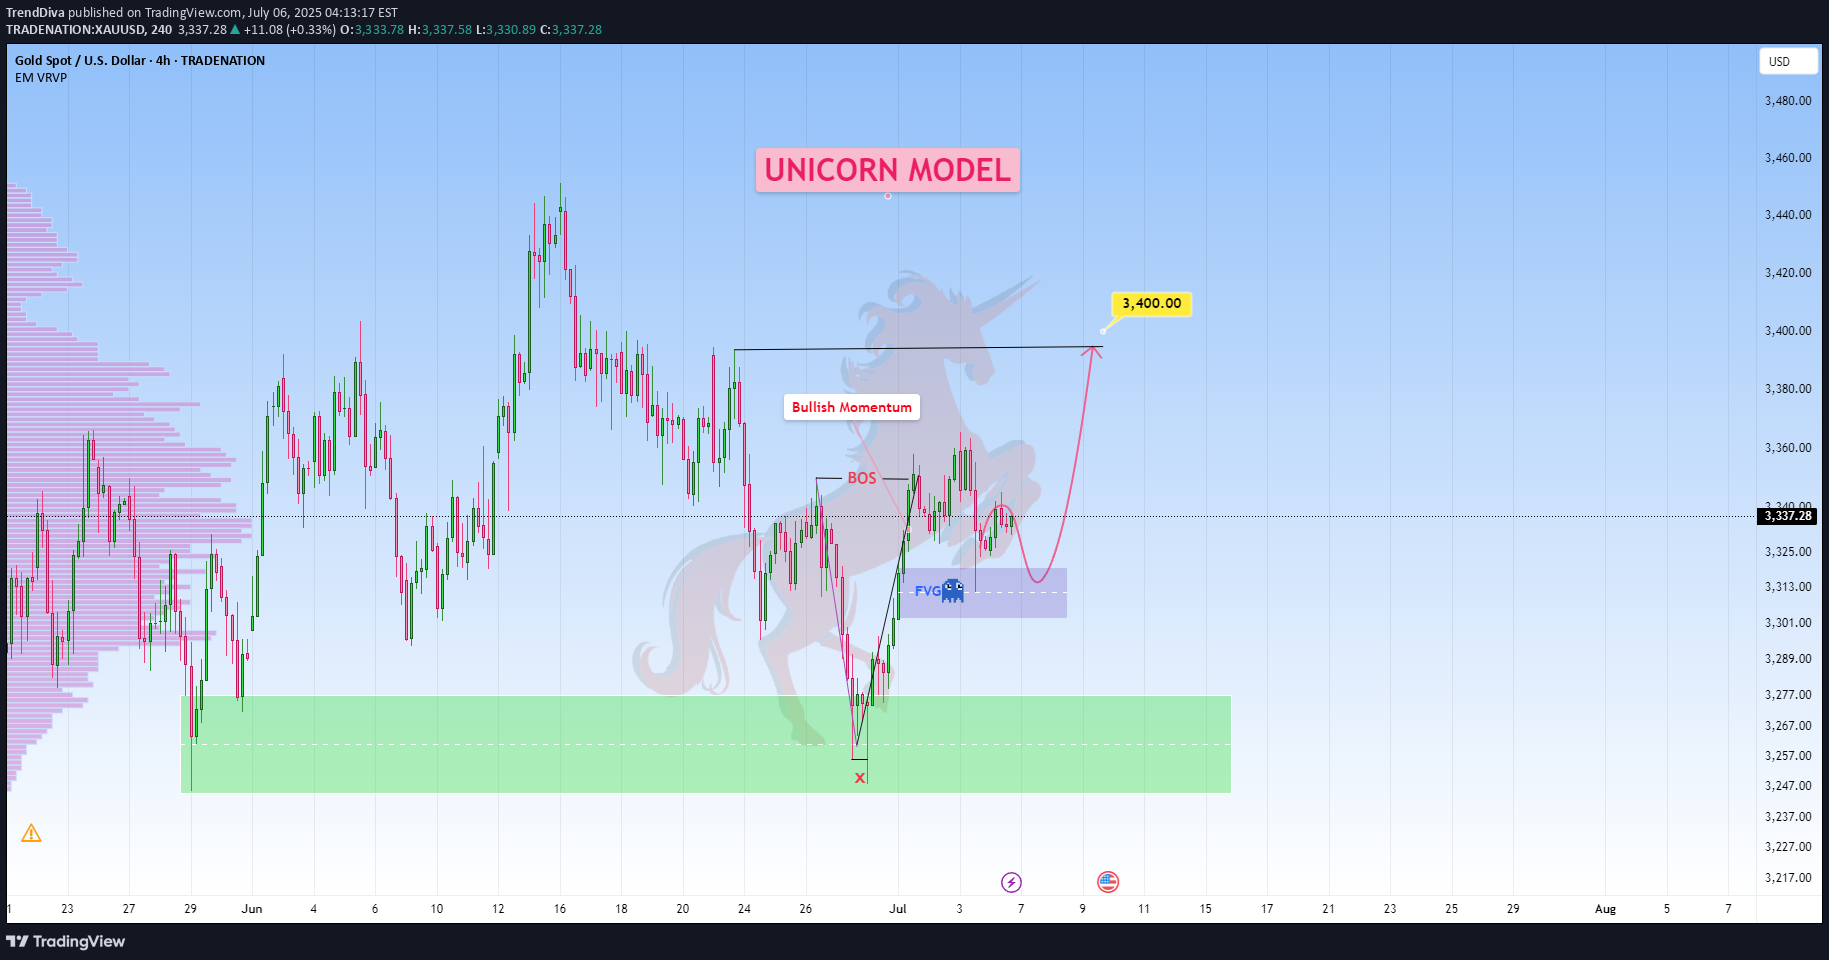
The Unicorn model is considered by many traders to be one of the most refined and effective concepts within the ICT framework concepts because it brings together several core ideas into one powerful, repeatable setup. But what makes it so highly regarded as one of the best?It’s the ability to stack multiple high-probability conditions: liquidity grabs, market structure shifts, fair value gaps, and optimal trade entry zones.Unlike isolated concepts, the Unicorn model doesn’t rely on just one factor. It uses the synergy between time and price → waiting for manipulation first, then entering during the retracement into a fair value gap or order block.This not only increases accuracy but allows for tight stops and high reward-to-risk ratios. Many traders rely on it exclusively because it’s both structured and versatile, making it easier to apply consistently across various market conditions.How does this work: You’ll see the price breaks a swing high, reverses, and creates a Breaker Block (failed order block) with a Fair Value Gap. These overlap to form the “Unicorn zone” → After that, price drops sharply, breaking the previous structure, indicating a shift in market direction → Price retraces, entering the overlapping zone → Traders look for rejections (candlestick patterns, wick spikes) as the entry signal→ With entry near the zone, the stop-loss is placed just beyond the Breaker Block or FVG.Targets can be the next liquidity levels (e.g., recent lows). Many traders use 2:1 or 3:1 R:R, though targets can be higher.In other words as a standalone strategy, the Unicorn model is highly effective, if, and only if, you have the correct daily bias. With a clear directional outlook, it becomes a complete and reliable setup.Which in our case, on Gold it aligns perfectly.Just sharing my thoughts for the charts, this isn’t financial advice. Always confirm your setups and manage your risk properly.Disclosure: I am part of Trade Nation's Influencer program and receive a monthly fee for using their TradingView charts in my analysis.The setup got invalidated, GOLD seems to be turning more bearish
TrendDiva
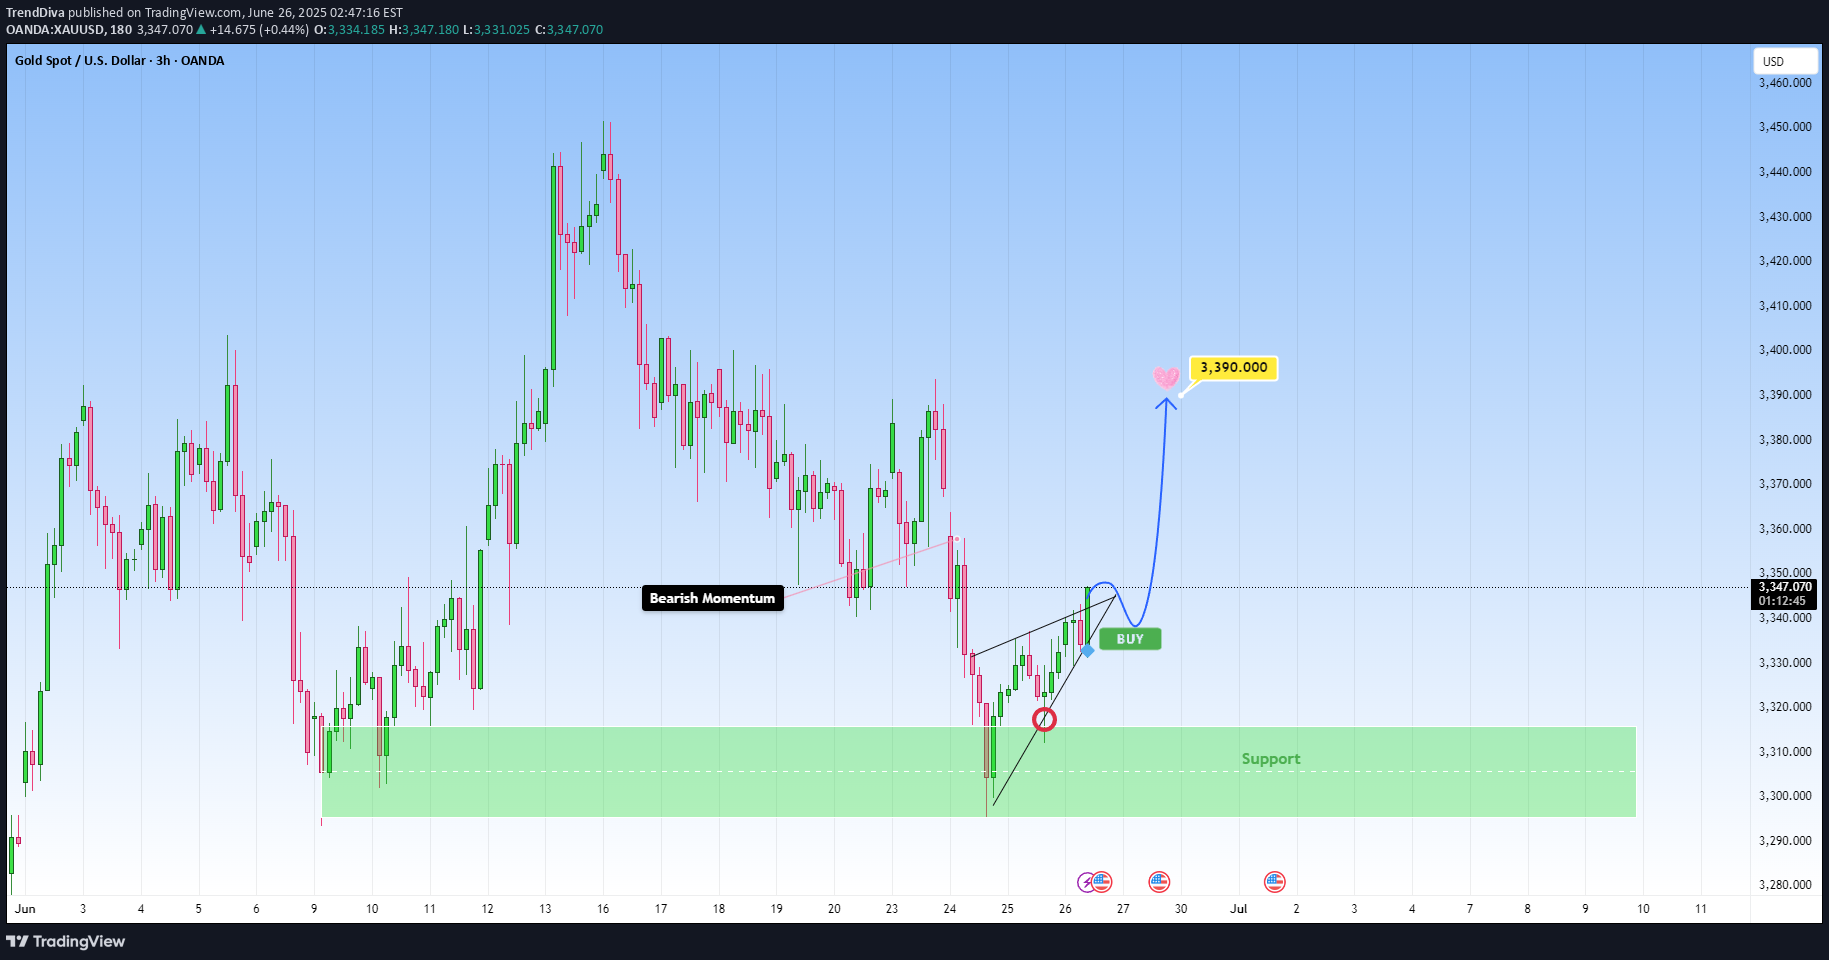
The recent bearish momentum on GOLD has met a good support zone and at present we started to see early signs of bullish interest returning, right after we got a beautiful rejection from the zone.Currently I’m expecting for the price to bounce to the target near 3,390. If this bullish push continues with strong volume and momentum, I’ll be locking in that bias and planning my entry accordingly. I could get involved right here for a more aggressive entry. It’s a bit riskier, but if the structure confirms, I’m more than happy to take the shot, as sometimes the best trades come when you trust your setup. This is not financial advice.The idea got invalidated, Gold hints for more downside
TrendDiva
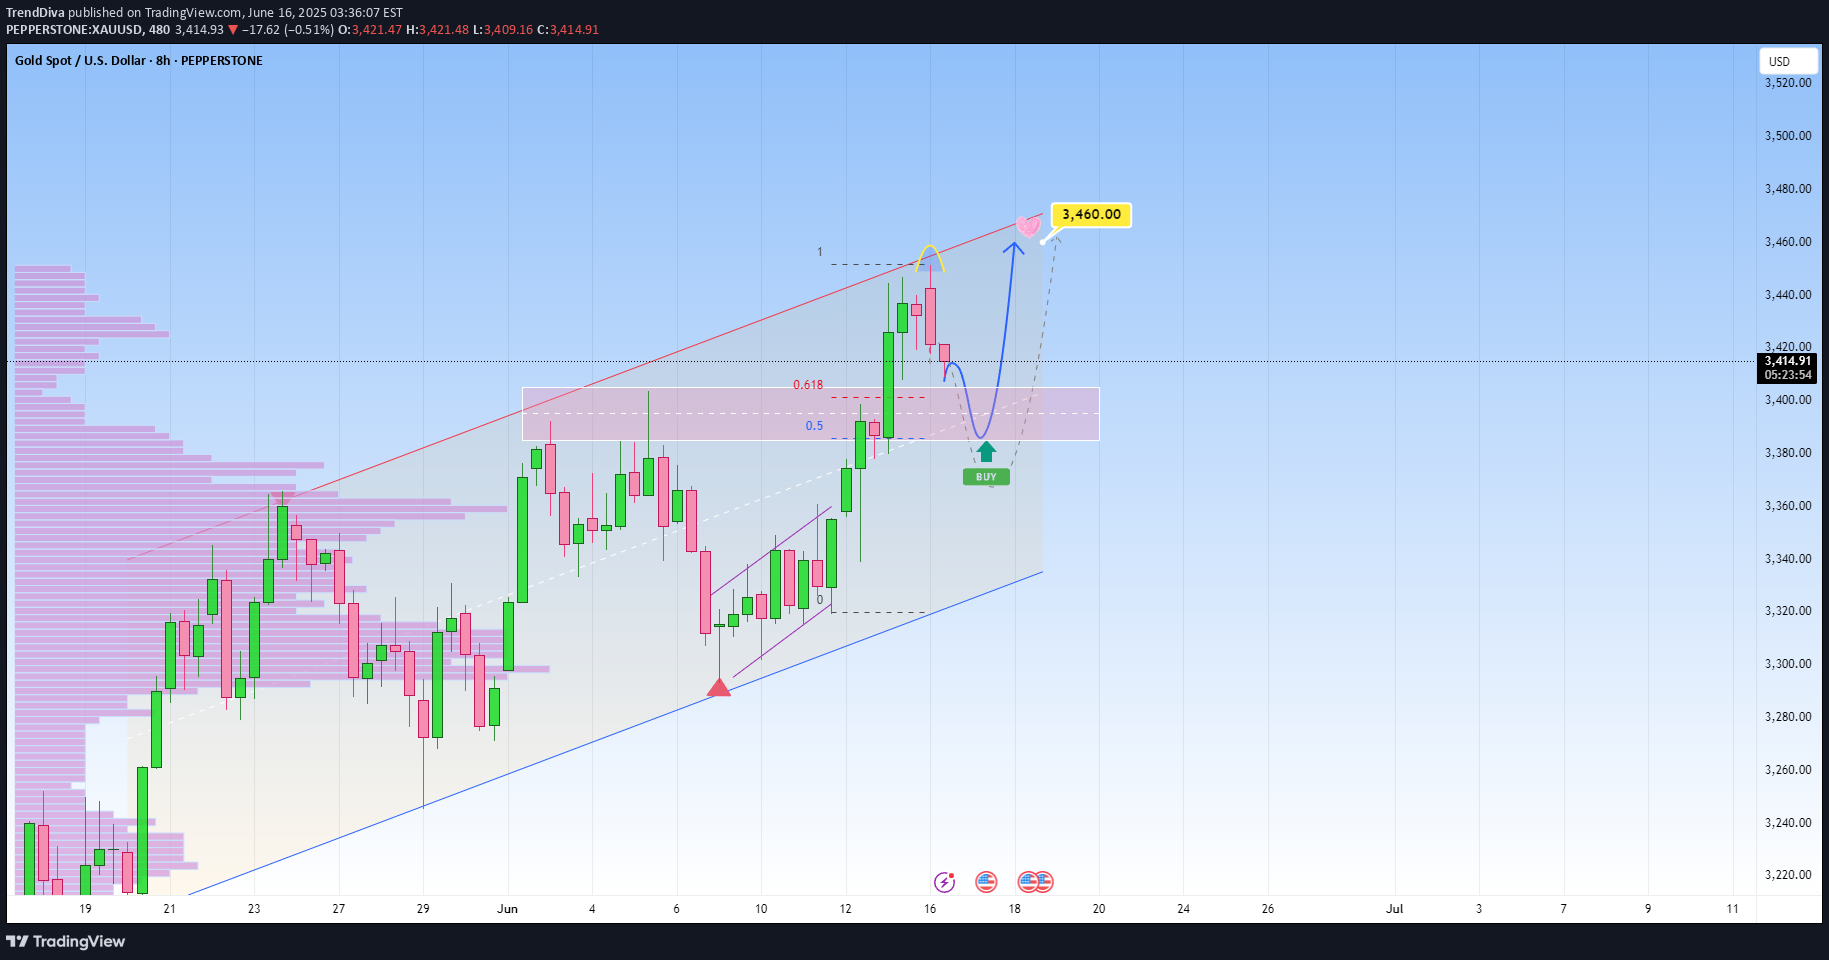
Gold is the focus, plain and simple. We’re in an ascending channel, and price is respecting that structure with precision, higher highs, and no major signs of exhaustion yet.Recently a clear resistance level was just taken out, and now I am watching for the classic retest. That breakout? A big deal, and a strong clue as well. If that zone holds as support, that’s a green light for a potential upmove toward 3,460 which matches the top of the channel.But if it fails, we could expect a slight pullback, it might mean we could be in for a healthy dip before the next move.Bottom line: follow the structure, and don’t force trades here without confirmation first
TrendDiva
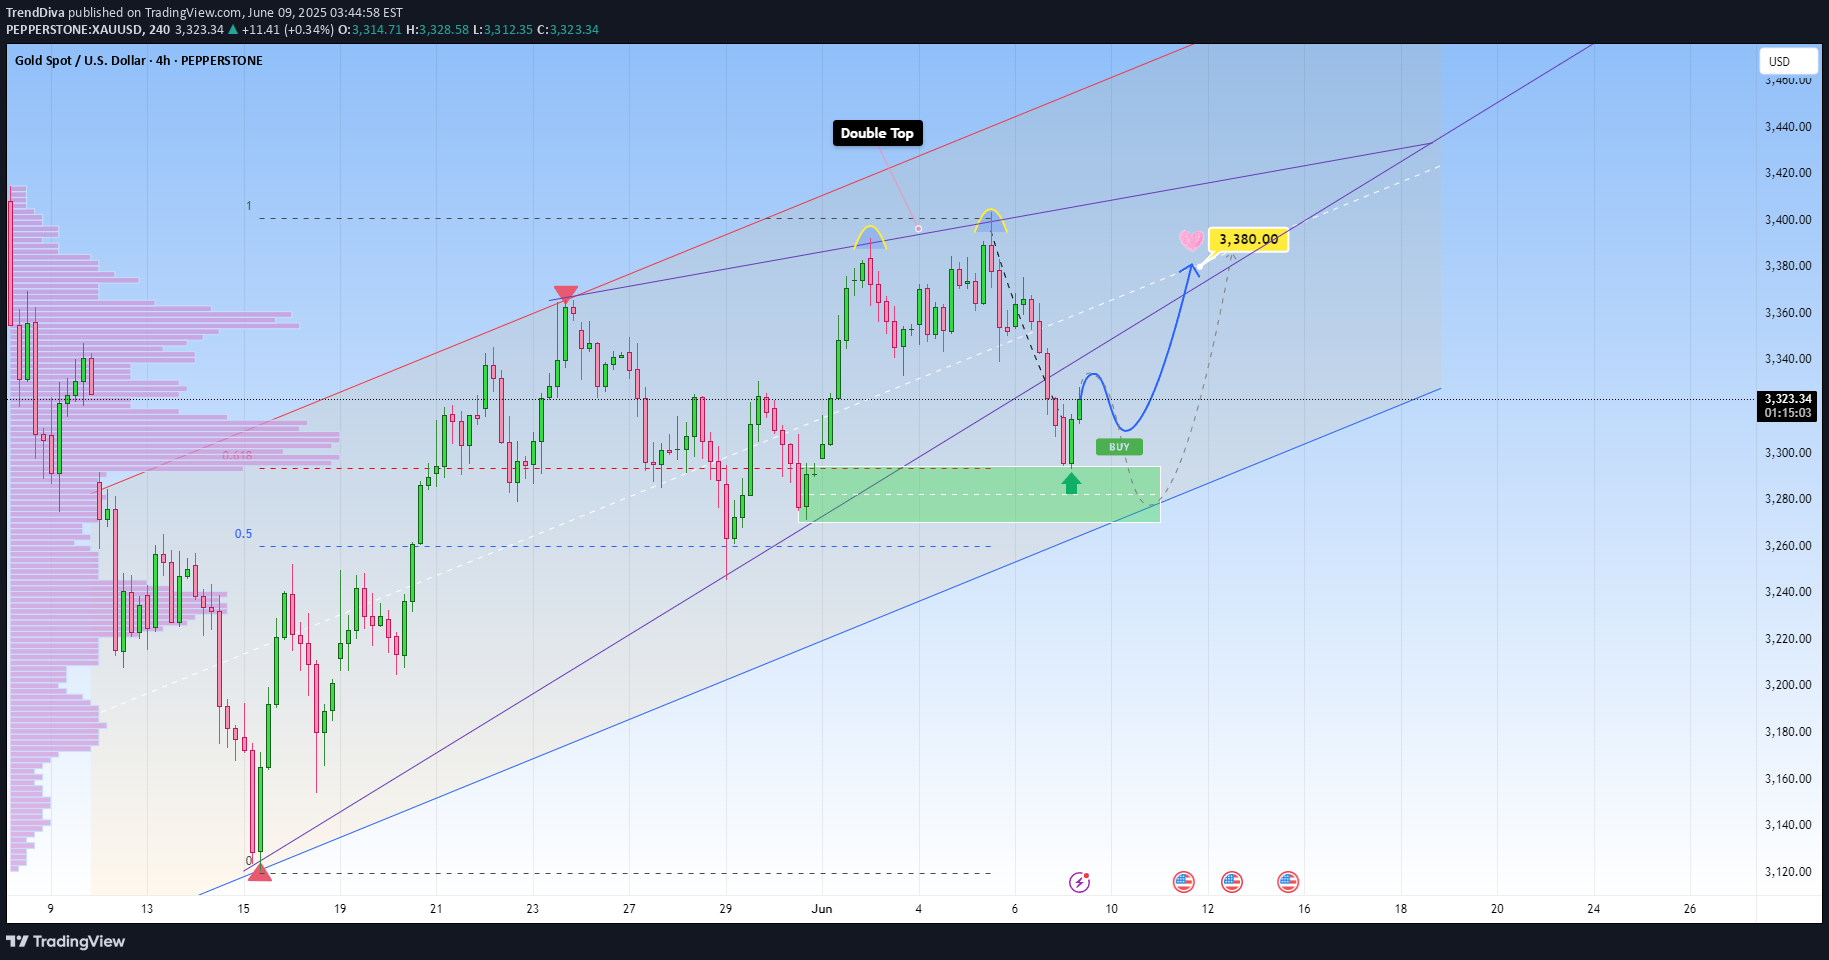
XAUUSD is still climbing steadily within its upward parallel channel, respecting structure beautifully as we’re now seeing early signs of bullish interest returning, right after we got a nice rejection from the support zone.Currently I’m watching this bounce to have a target near 3,380, somewhere around the middle line of the ascending channel. If this bullish push continues with strong volume and momentum, I’ll be locking in that bias and planning my entry accordingly. Patience first, I always wait for price to prove itself before getting involved. This could be a beautiful continuation… Or just one more fakeout before a deeper drop.Gold made 70% of the projected move and is now showing strong momentum, I anticipate it will continue to my target
TrendDiva
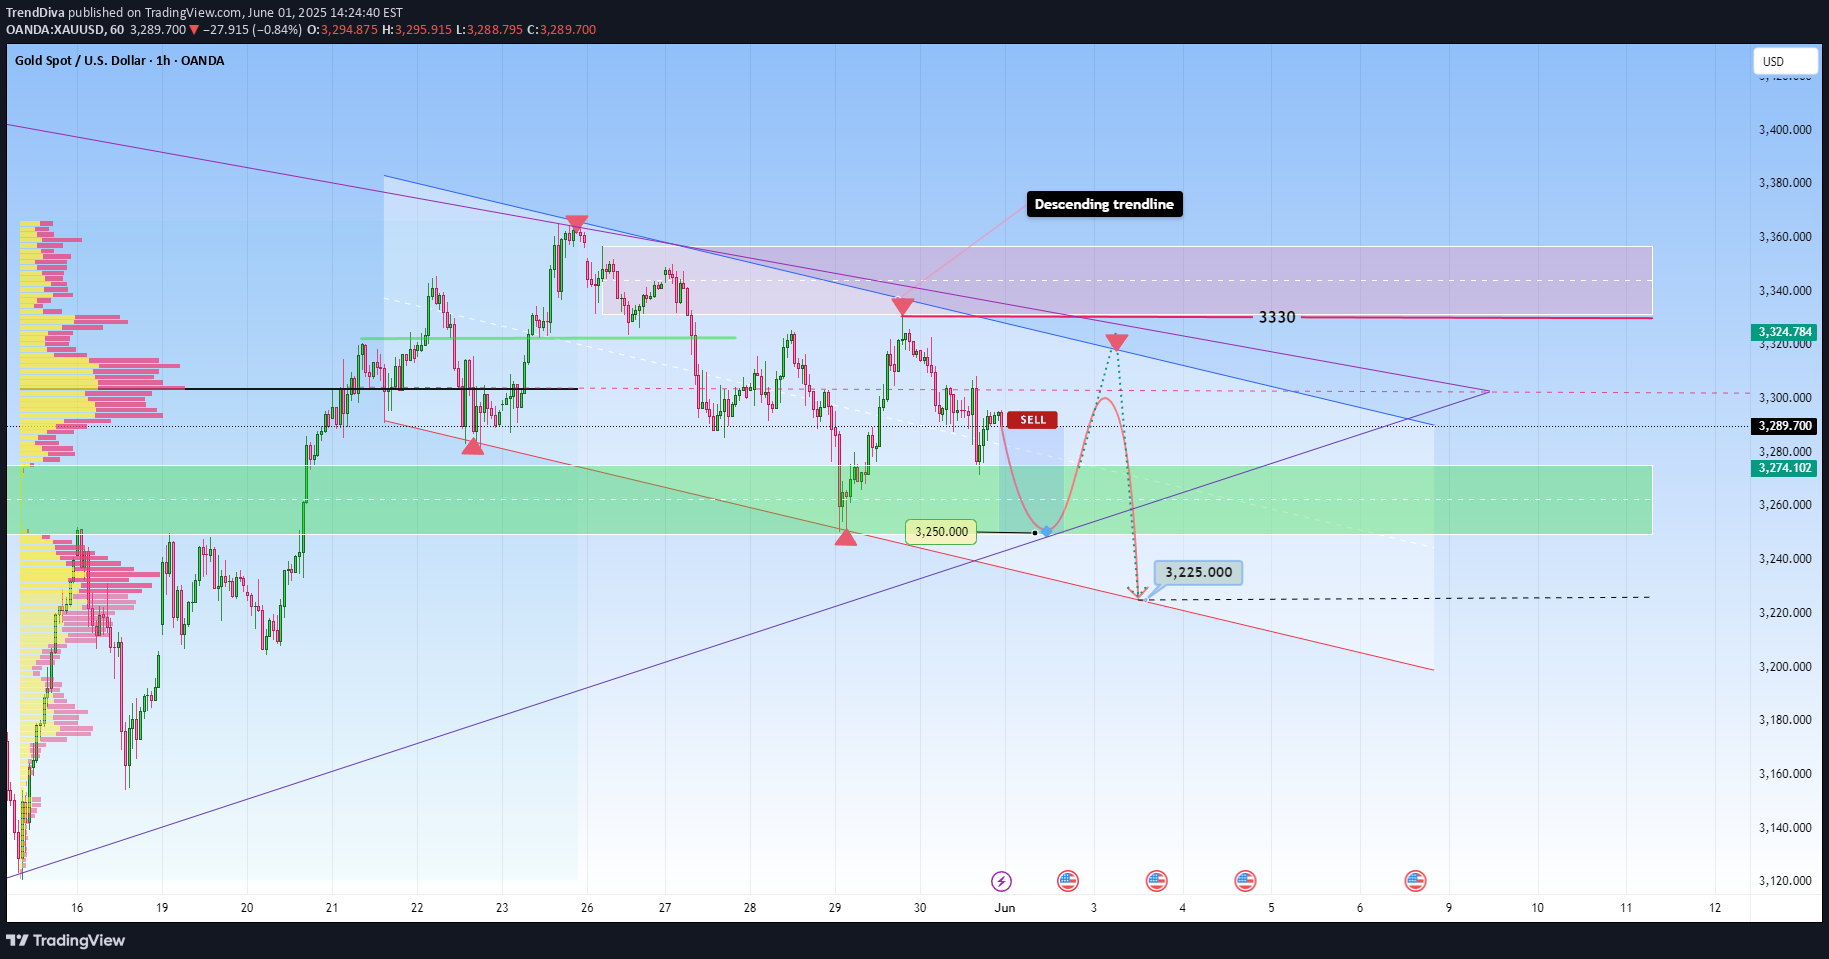
For now, we can see that Gold’s bullish momentum has stalled and since Friday Gold has been under pressure from 3325. Not surprisingly though, the market structure performed as expected this past week.I believe that short-term price action in gold may remain choppy next week due to Trump’s temporary tariff measures so caution is advised.My bias is still the same as before, I think that on Monday the market will open bearish likely pushing price lower initially. As you can see in my previous analysis, the forecasted move played as expected: So this being said I plan to react based on how price behaves at support of 3270-3250 on the lower side in the short term. If price tags the support as shown on my chart, I’ll be watching for a possible rebound toward 3300. This range in particular should not be overlooked. This area aligns with the point of control, and given how price often gravitates back to high-volume zones after sharp moves, a recovery to that level would be a natural reaction.The key point lies in how the market will open and how price will behave, as well as the overall sentiment.Gold's next move won’t be random, there are strong confluences at play that will guide and give us hints, so it’s up to us to stay attentive.If we were to break upside above the $3,330 level, then we can see more bullish outlook nextThe other scenario, to be taking into account would be to start with a strong bullish candle and reach 3330 before a drop.Wishing you a profitable trading weekend ahead. This is just a forecast and should not be considered financial advice.The market opened with an upside gap, but my overall bias is still the same as before, to stall at around 3,330 and fall towards 3,250
TrendDiva
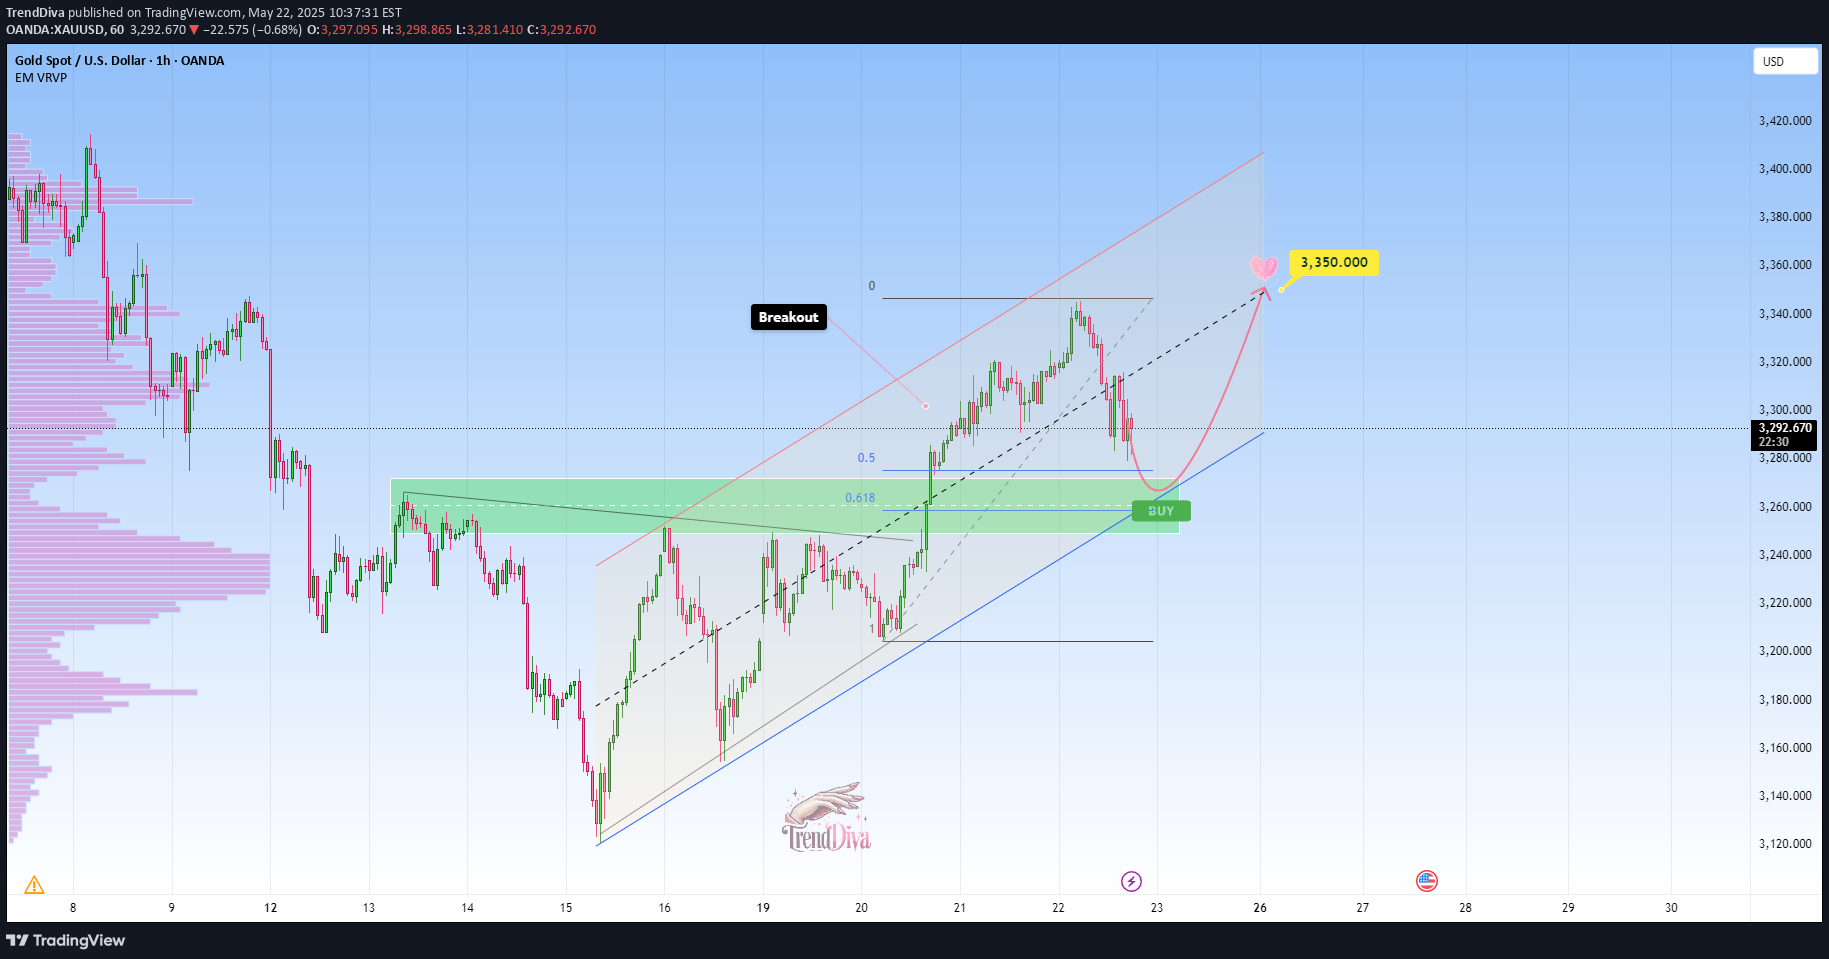
From a recent price action standpoint, the move on Gold may have offered cues of encountering weakness, and could serve as a key trigger for bearish traders. This is why I’m anticipating further short-side follow-through. The negative outlook is not confirmed yet, however a bounce off the trendline could once again attract sellers, for a decent move to 3,240 support zone. This latter zone, could be a key turning point that if broken, would lead to a good opportunities for buyers looking to get involved on the dips, anticipating a potential shift in momentum.But a strong move up and break of trendline at around 3335-3340, would allow Gold to reclaim the 3400 mark and climb even further.On Monday in my last analysis I predicted that the price gold would fall as low as 3290, after which the price has rebounded short term. All this being said, I am closely watching how price will react when it encounters the trendline as shown and I will wait for any confirmation clues. Please note that I will not get involved without proper confirmation
TrendDiva
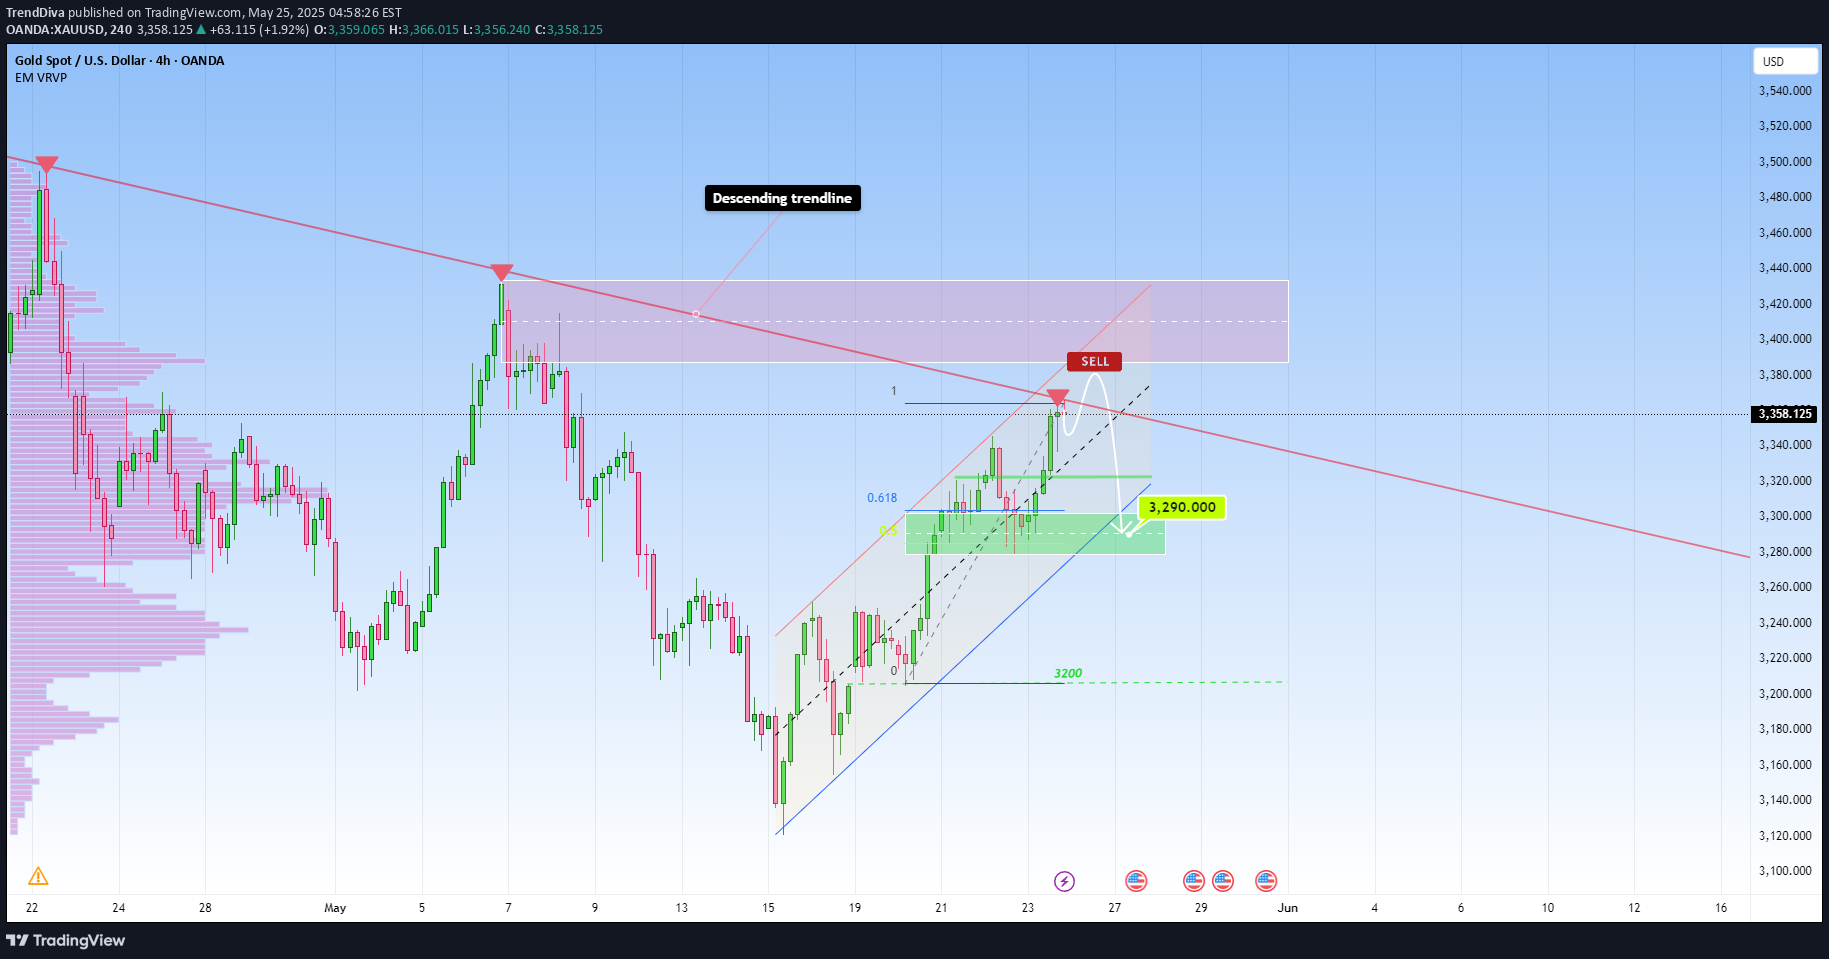
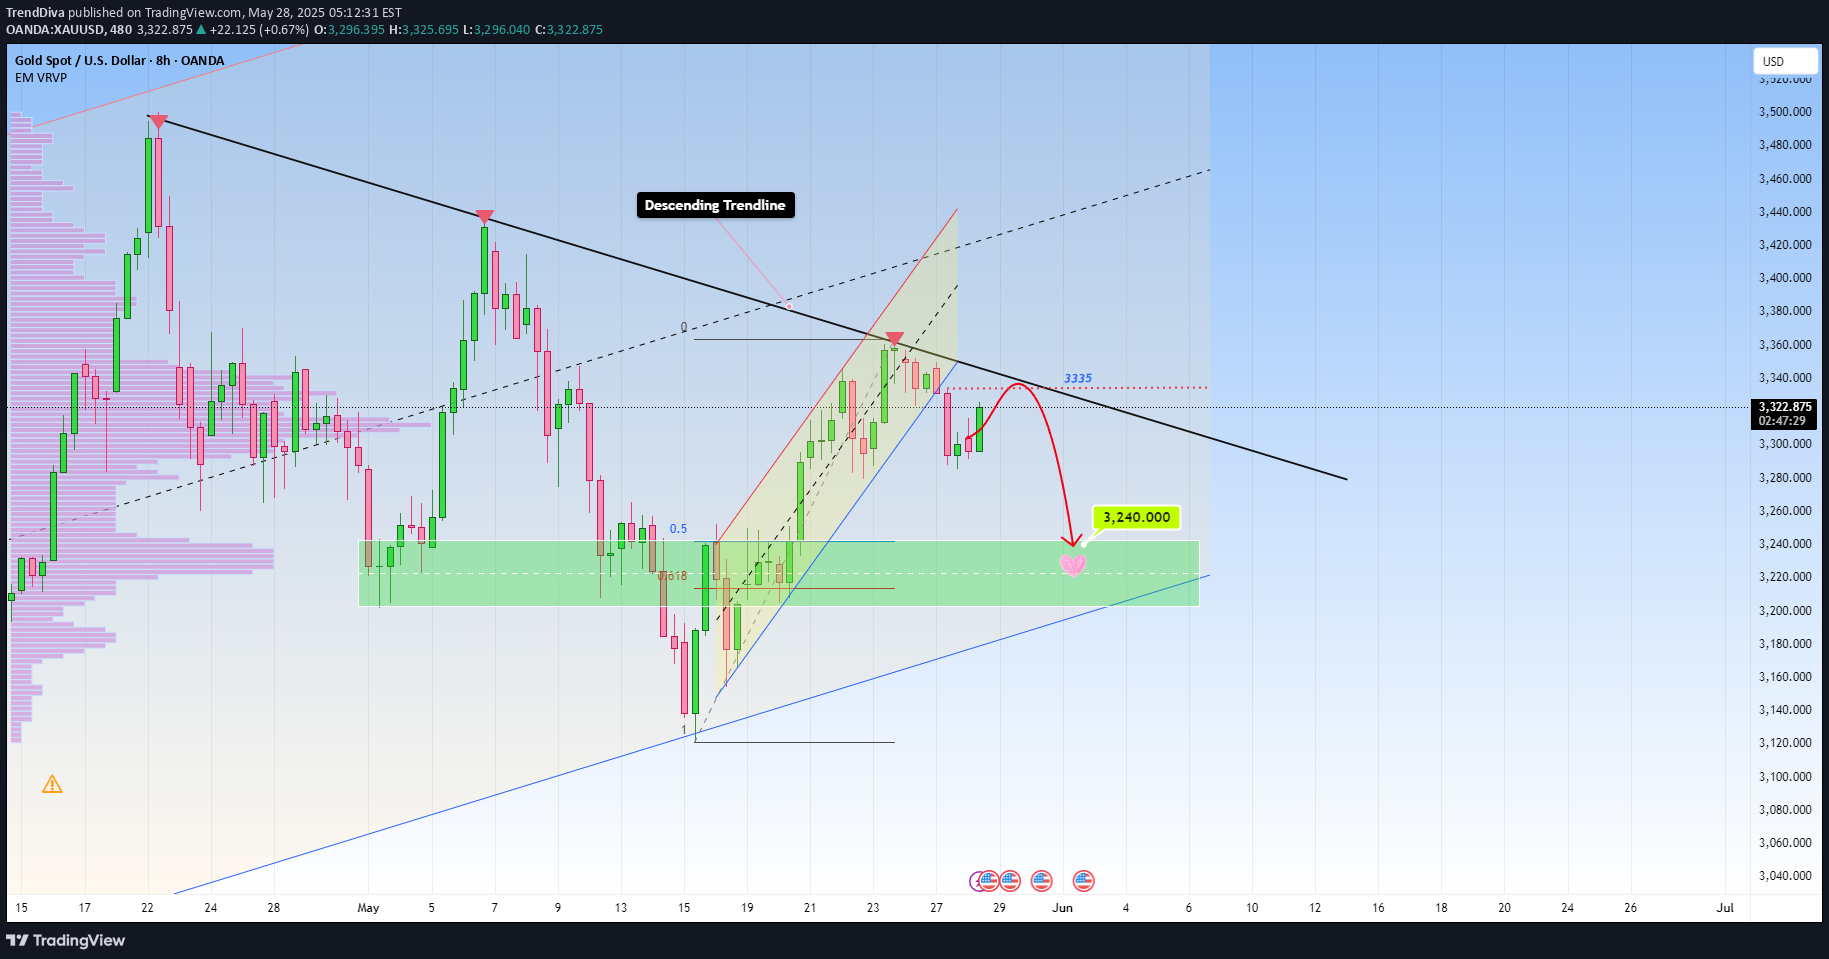
The Gold market has been very strong for some time, but I don’t think this will continue to be the case going forward. As we’ve seen, the price has rallied a bit on Friday with Trump’s EU tariff threats. Market structure starts to hint exhaustion, as such overbought conditions often lead to generous pullbacks, supporting needed corrections.That being said I do think that on Monday we might see a short term pullback. We can see that gold is currently being rejected just above the higher zone of the 4h ascending channel. The zone aligns with a low-volume node as well. Therefore, at this zone around the 3,350, I wouldn't recommend to chase high. Before this zone is clearly broken considering long entries here would be buying blindly. Right now I think you have to look at this as a market that may just simply be a buy on the dip and hold till we get to the $3,500 level again type of situation. The other scenario is that the market will consolidate for a while. If we were to break down below the $3,290 level, then $3,200 is next support. In the long run though the bias remains bullish with potential to challenge the 3,435 and as well as 3,500 in the big picture.But if you're watching for buys:wait to see how price behaves on Mondaywatch for sustained bullish structure before getting involveddon’t chase, wait for a clean break + candle confirmation patternFor sells: Watch for bearish rejection in the next couple of candles (4H or Daily) Don’t enter unless it’s confirmed!Gold is behaving as anticipated, I am expecting it will continue towards my targetBreakdown completed. The price dipped into the zone nicely
TrendDiva
Right now XAUUSD is a classic case of a market trading within an ascending channel, with price action consistently respecting both its upper and lower borders.The price has broken above a clear resistance zone and may pull back for a retest. This area also happens to coincide with the golden pocket of the recent swing and so it deserves special attention. If it holds as support, then that would be a confirmation of the bullish structure with the most likely possibility of a move towards 3,350, the middle side of the channel.As long as the price stays above this support zone, the validity of the bullish setup is still there. If it does not, the short-term bullish outlook would therefore be interrupted and might be followed by further downside pullback. Be sure to use proper risk management always.Gold reached the forecasted move, I think that it could reach the top border of the channel 3,400$ - as predicted in my previous analysis. There is where it could meet a key resistance -
Disclaimer
Any content and materials included in Sahmeto's website and official communication channels are a compilation of personal opinions and analyses and are not binding. They do not constitute any recommendation for buying, selling, entering or exiting the stock market and cryptocurrency market. Also, all news and analyses included in the website and channels are merely republished information from official and unofficial domestic and foreign sources, and it is obvious that users of the said content are responsible for following up and ensuring the authenticity and accuracy of the materials. Therefore, while disclaiming responsibility, it is declared that the responsibility for any decision-making, action, and potential profit and loss in the capital market and cryptocurrency market lies with the trader.