
TradingStar090
@t_TradingStar090

What symbols does the trader recommend buying?
Purchase History
پیام های تریدر
Filter
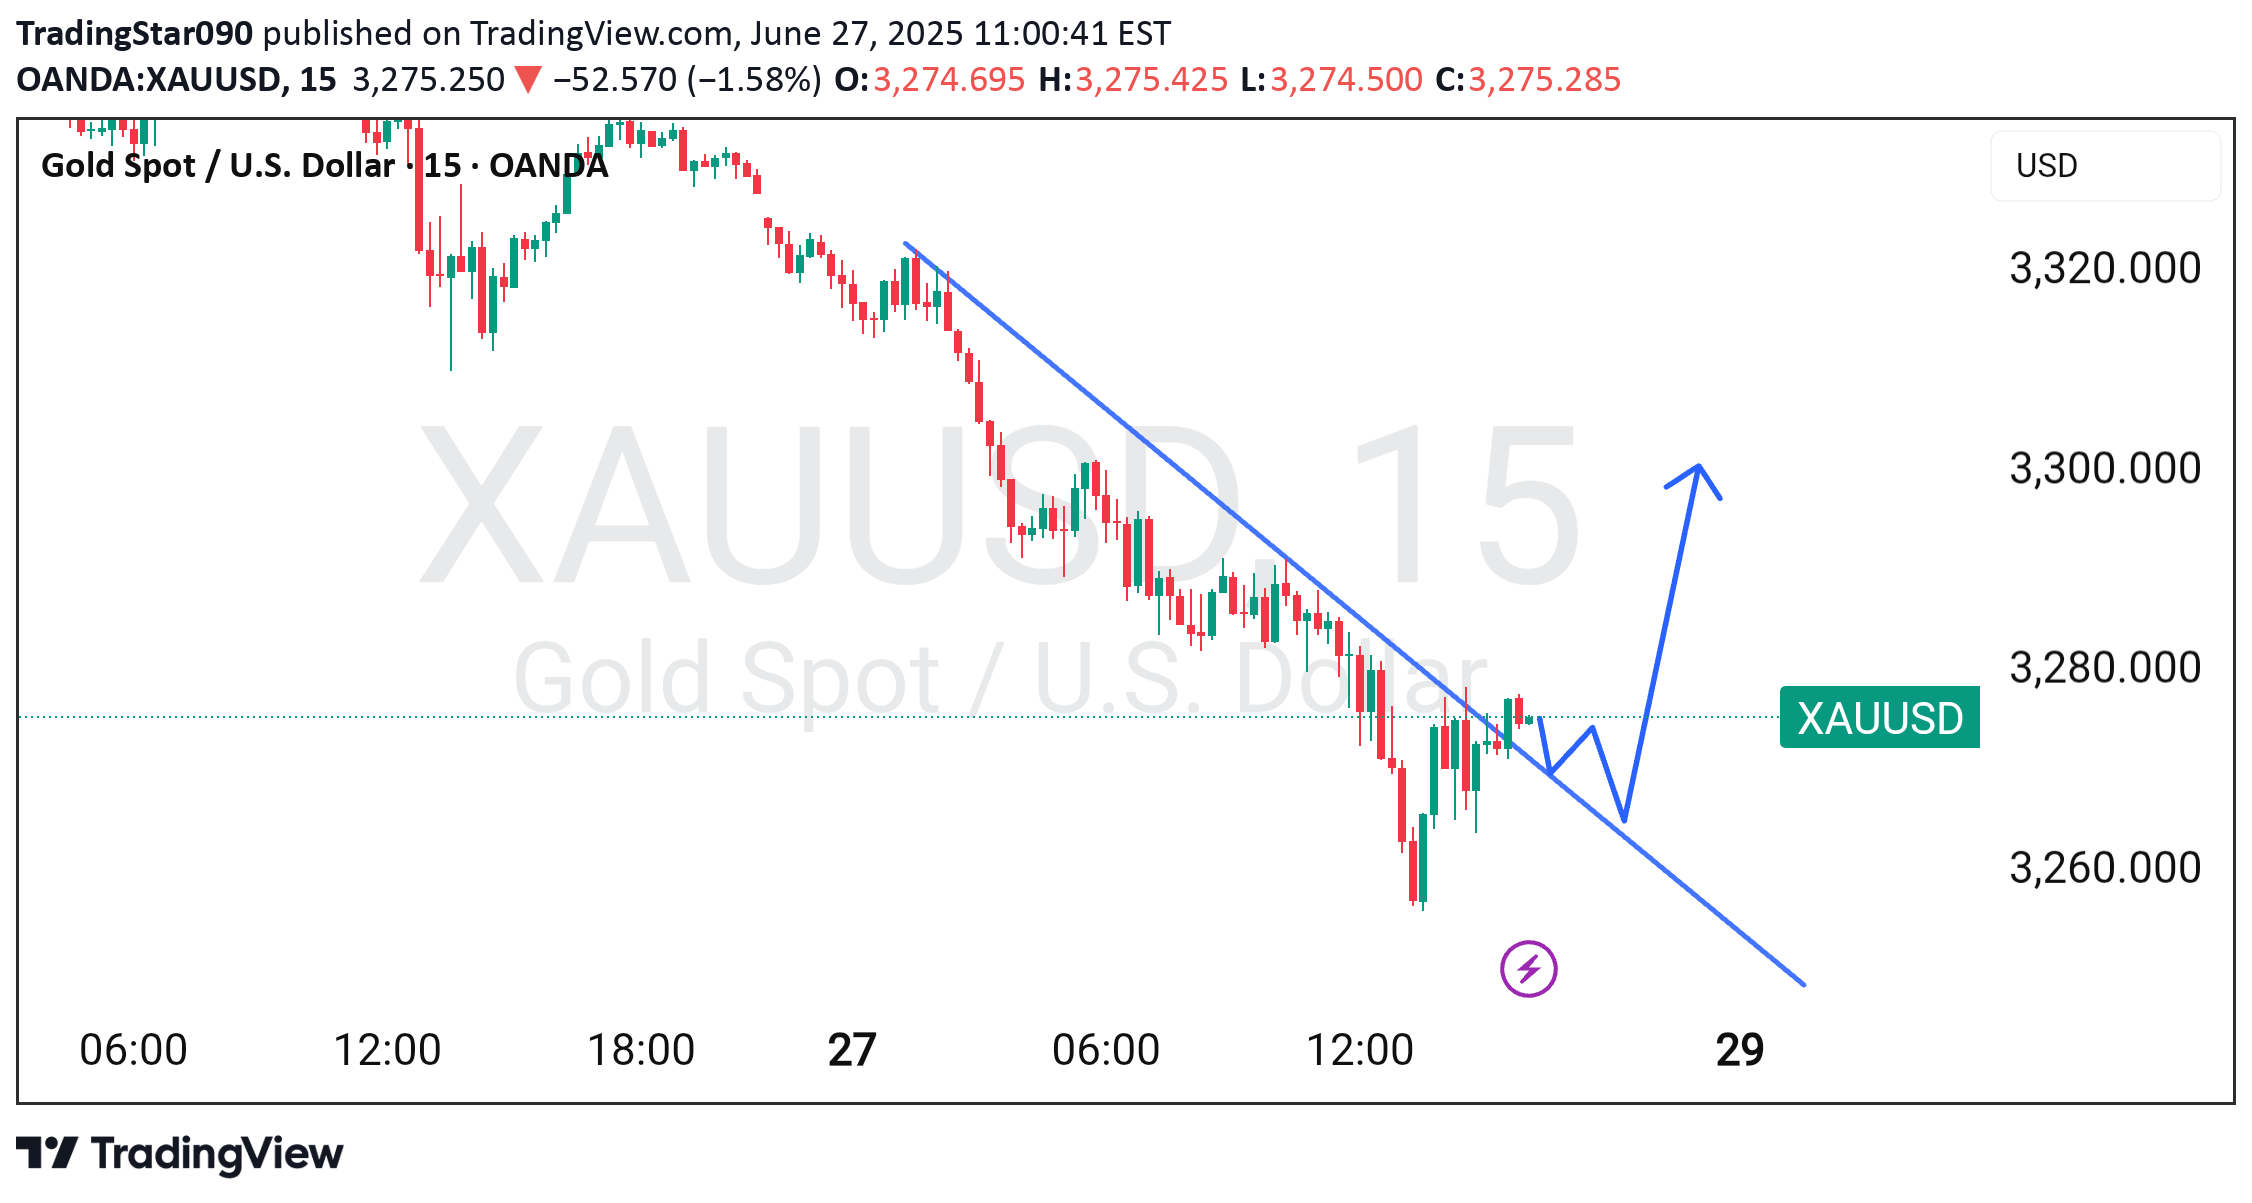
TradingStar090
Gold technical analysis gold can do this.
Gold forecast and technical analysis H1 Time Frame next move possible. Not financial advice.
TradingStar090
Gold technical analysis For FOMC Meating. Gold can do this.
FOMC meeting today really gives effect on market. Based on yesterday, We thinks for long term we need bias on Bullish Trend.⚜️ Big Timeframe Compression⚜️ Dovish Tone FOMC⚜️ Waiting Breakout Confirmation⚜️ H4 Bullish EngulfingBased on data and analysis, it's possible to gold shot up straight without retracement. Because price already bounce on H4 Bullish Engulfing.For now let's be careful and we entry based on market confirmation only.
TradingStar090
BTCUSD analysis short trade from 109200
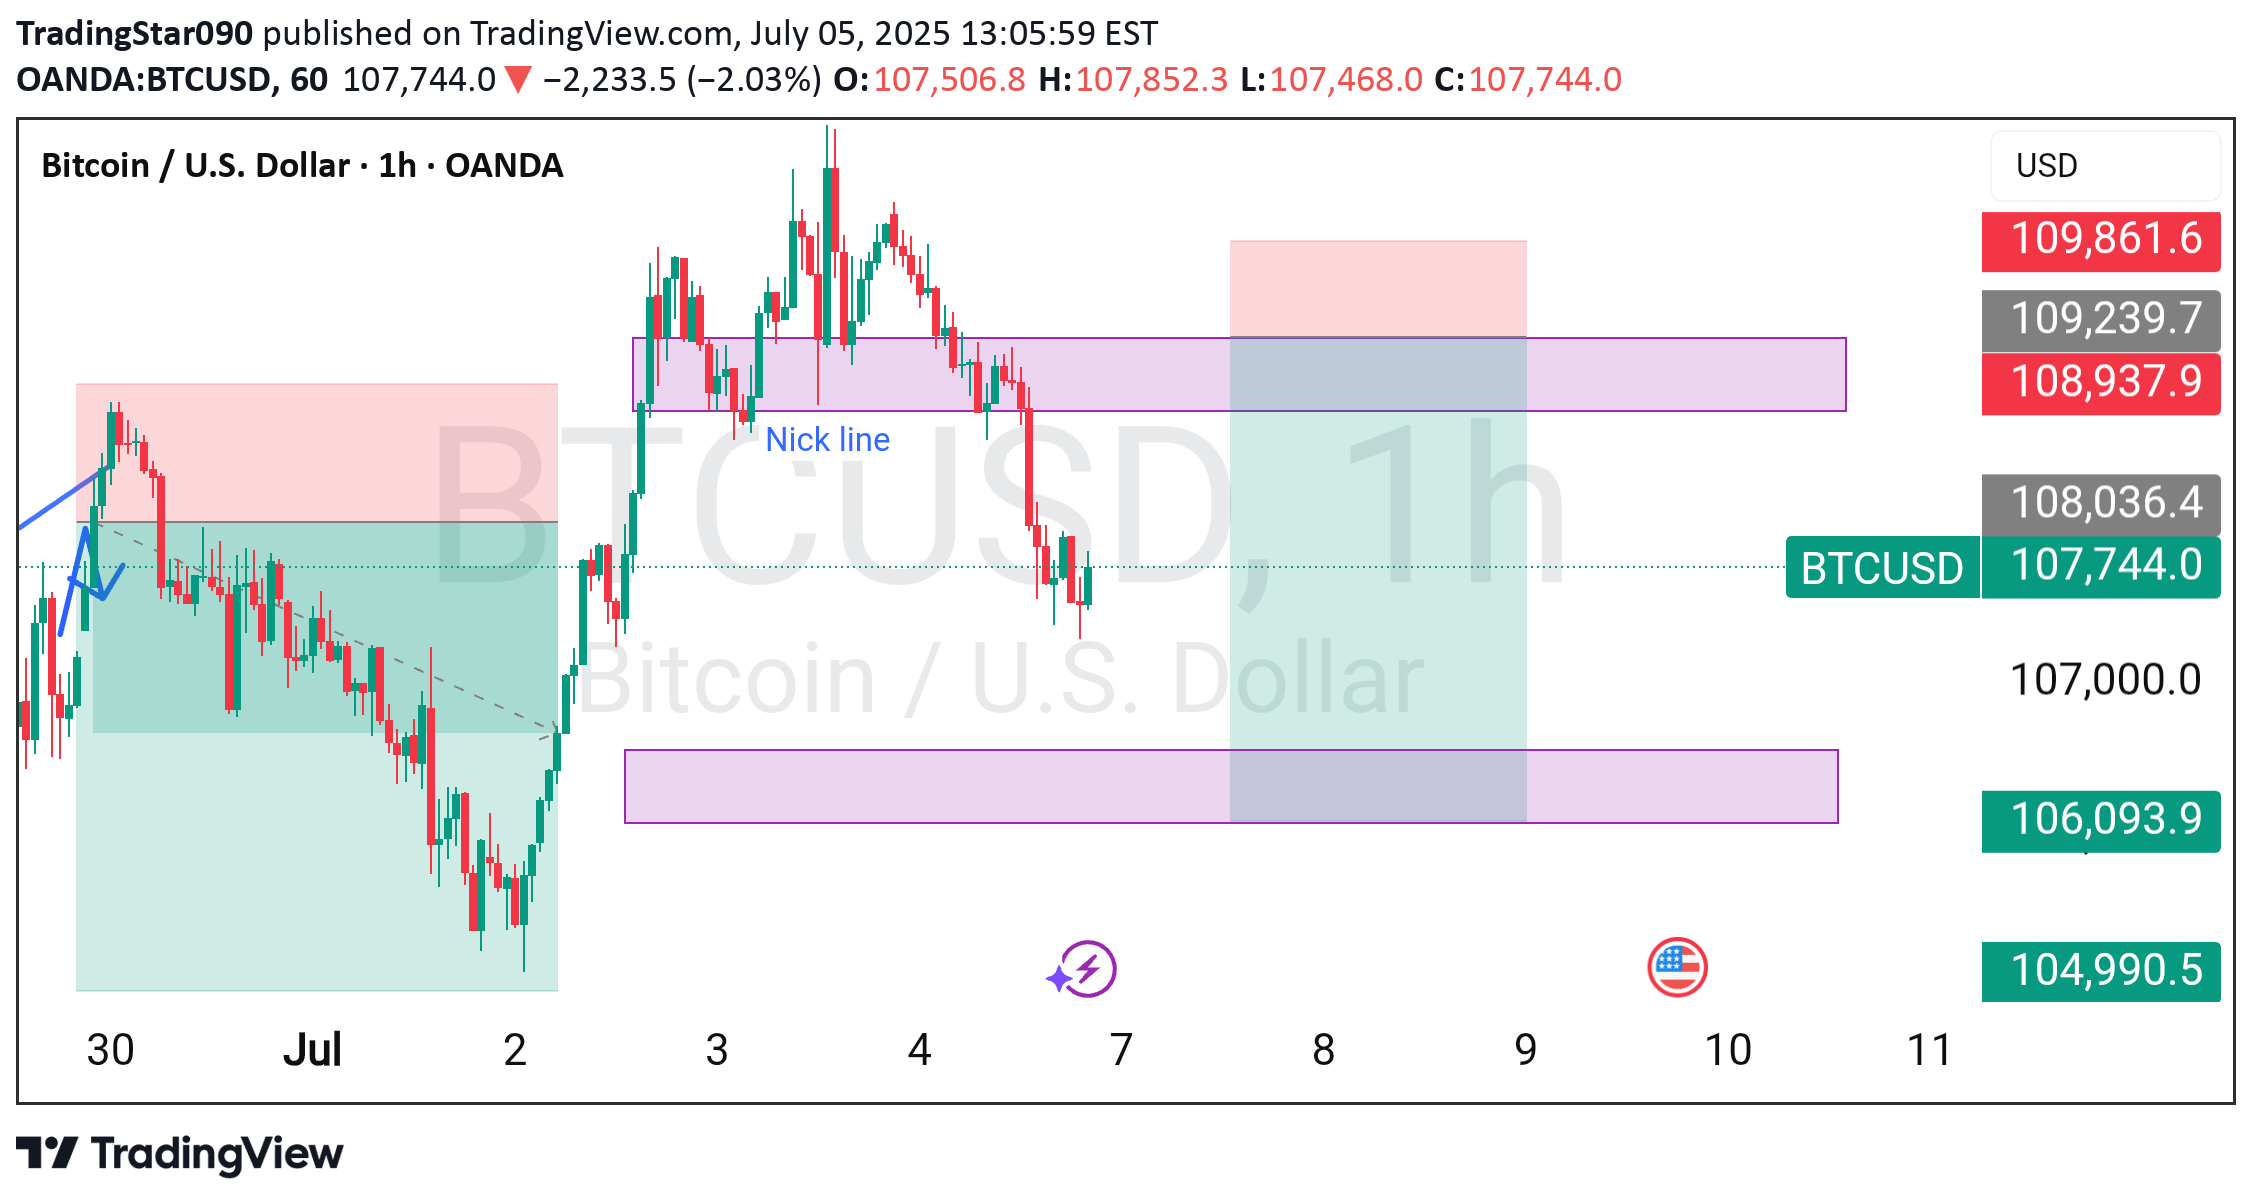
BTCUSD Forecast and technical analysis H1 Time Frame next move possible . Not financial advice
TradingStar090
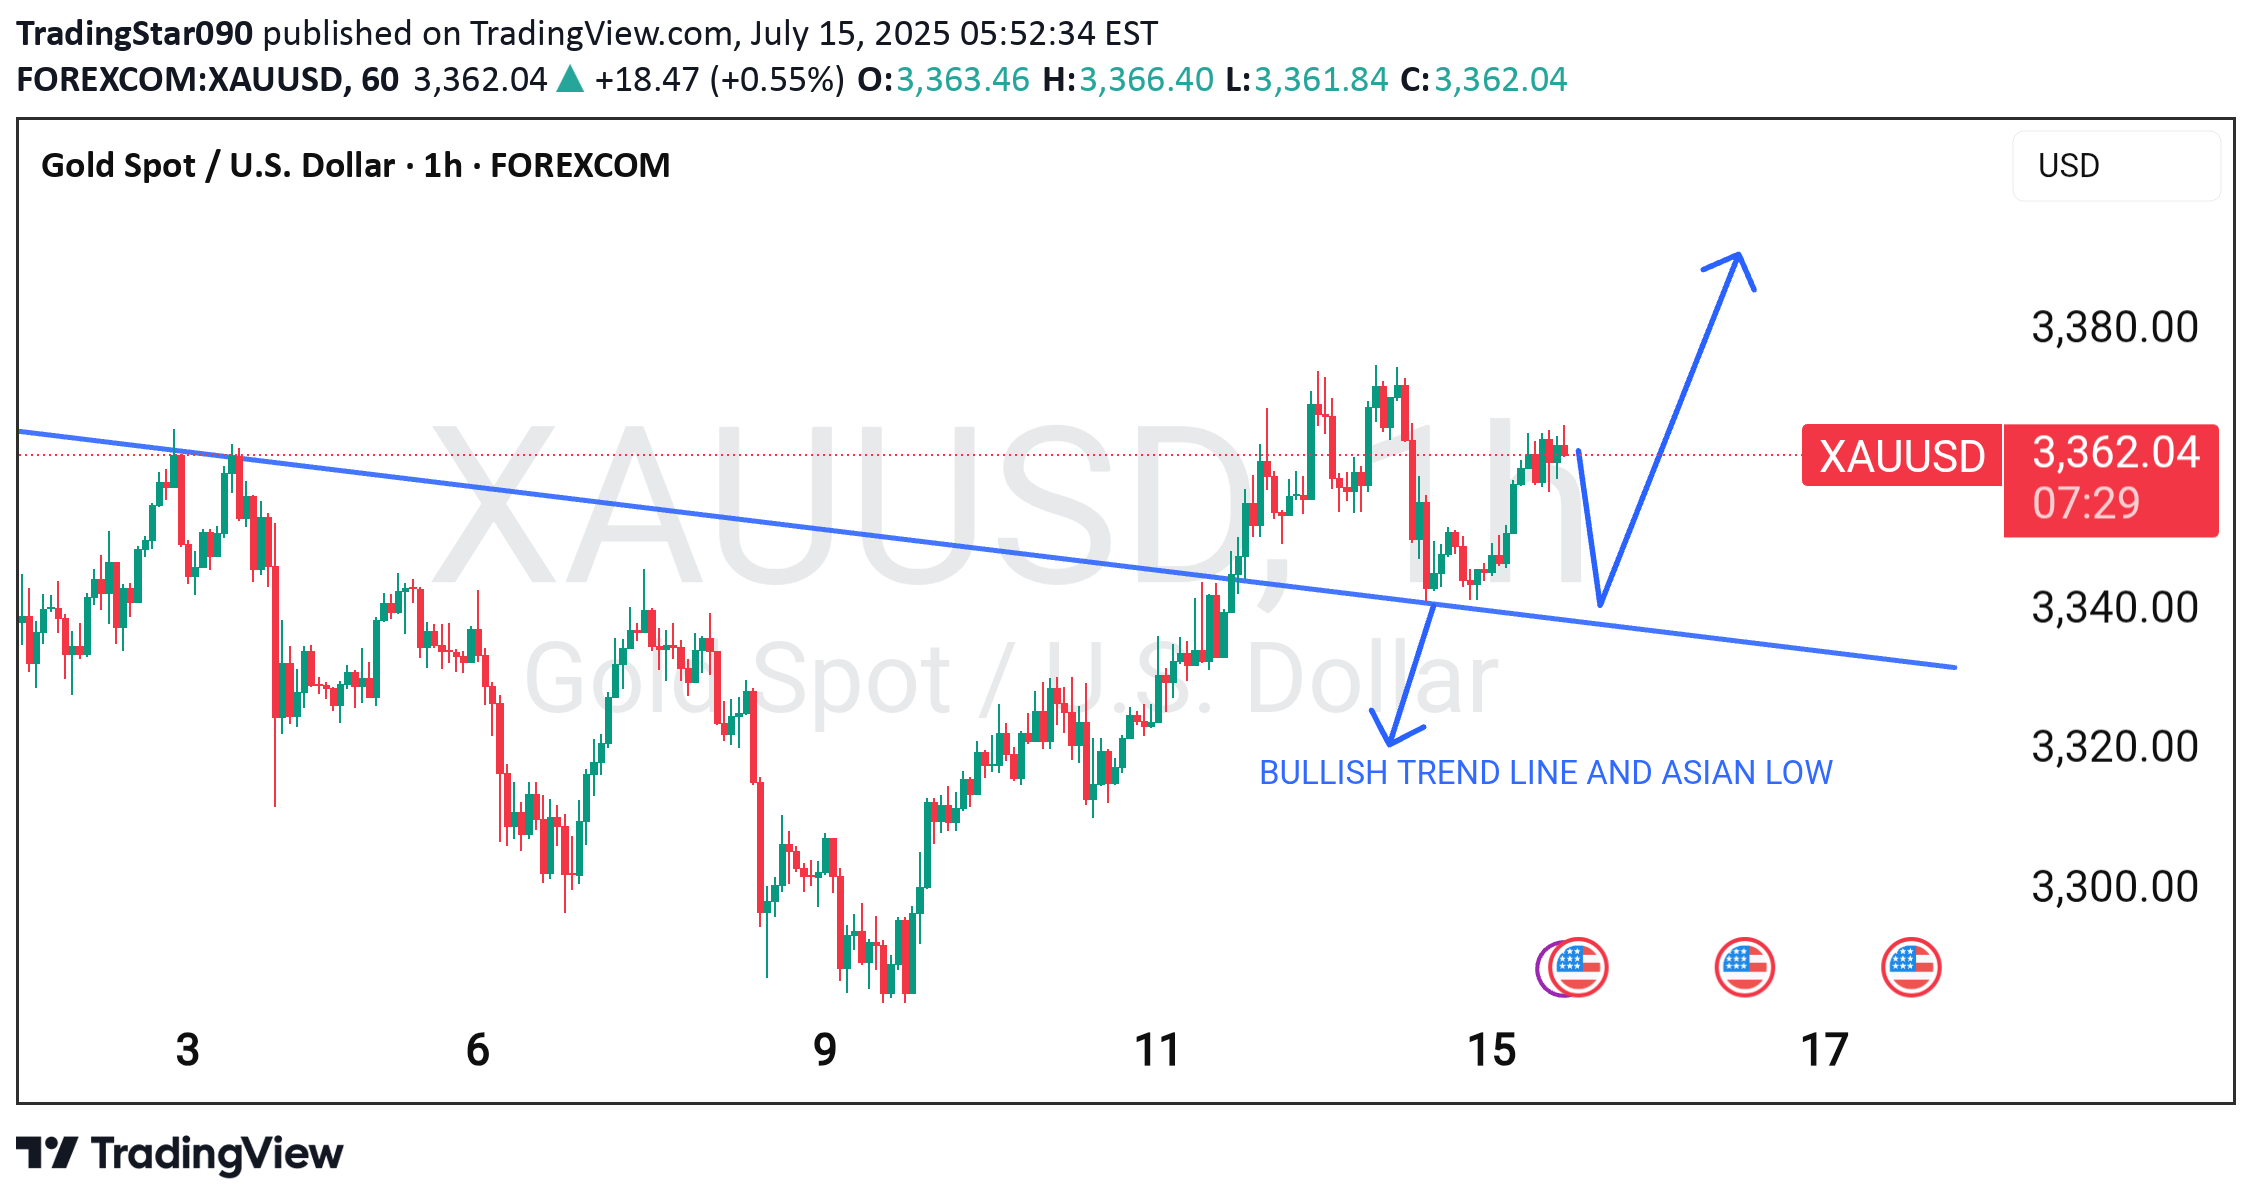
Gold next move analysis.
Gold forecast and technical analysis H1 Time Frame next move possible. Not financial advice.
TradingStar090
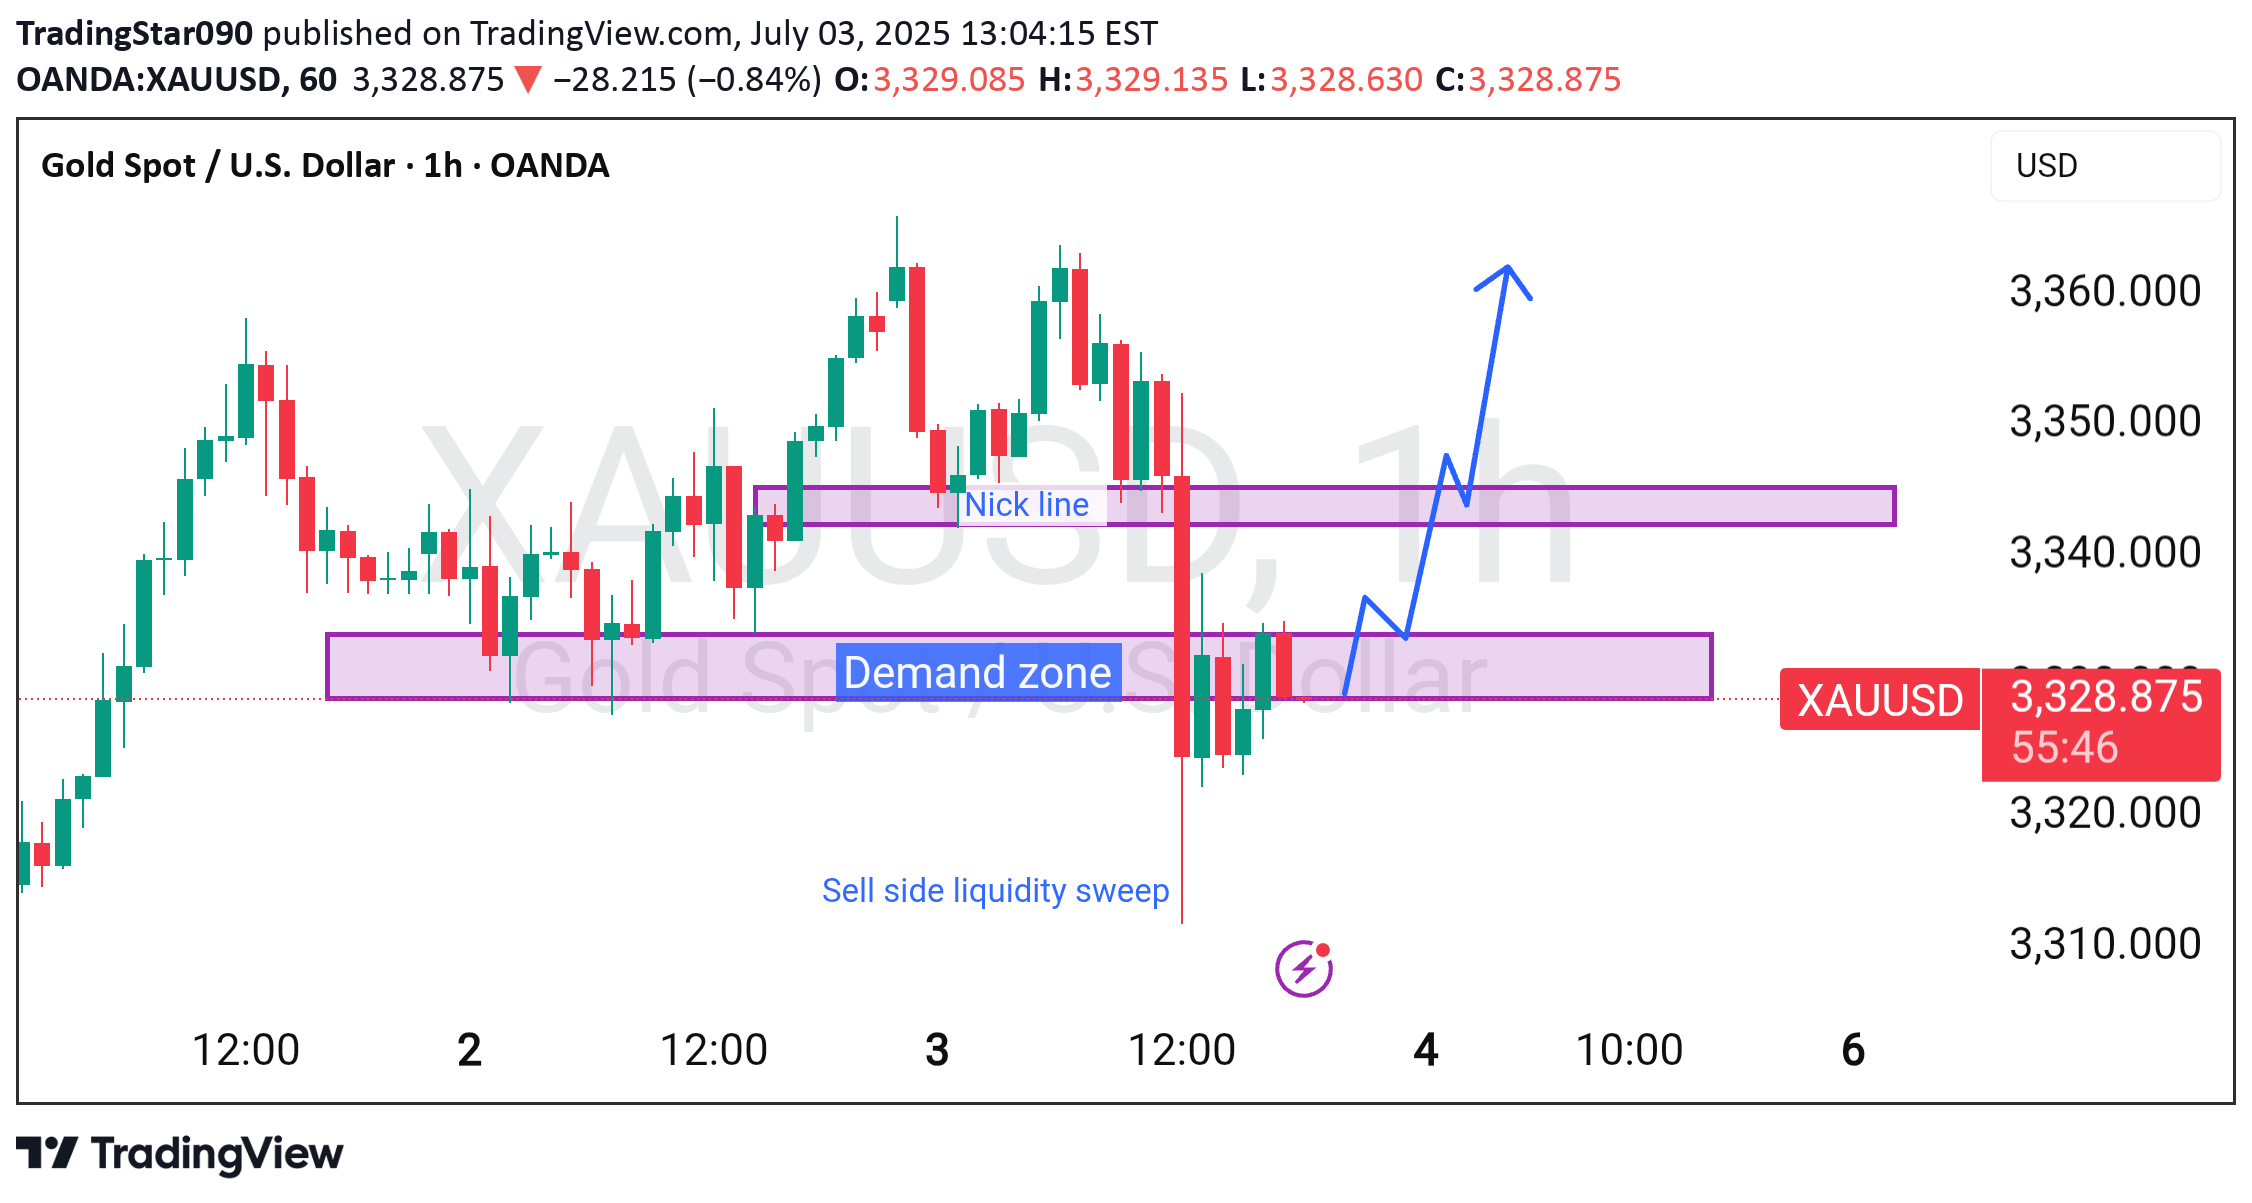
Gold current on demand zone.
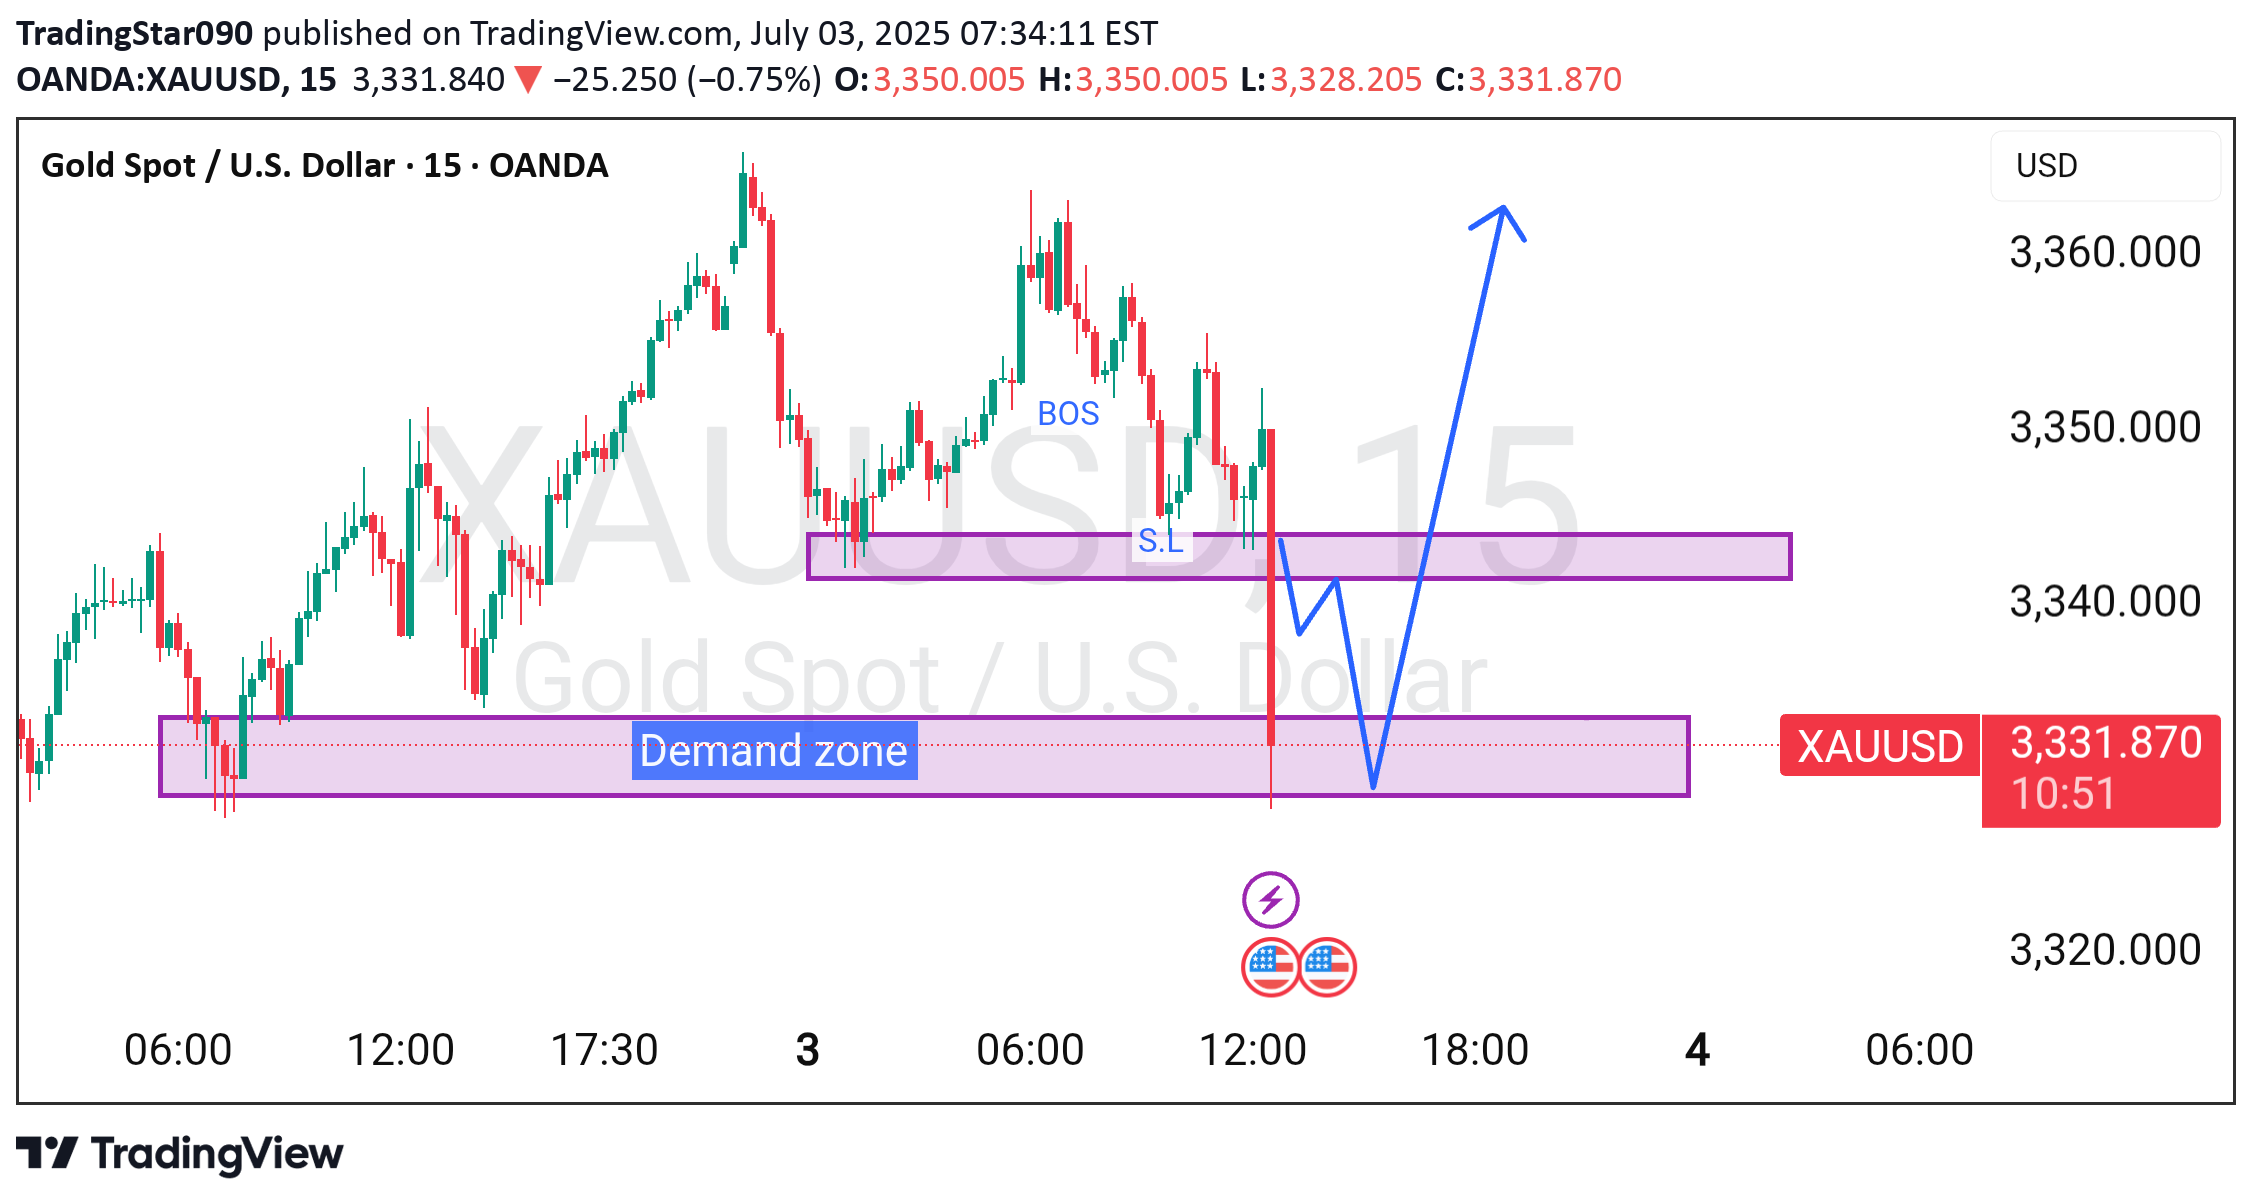
Gold forecast and technical analysis m15 time frame next move possible. Not financial advice.Trade active now keep risk management
TradingStar090
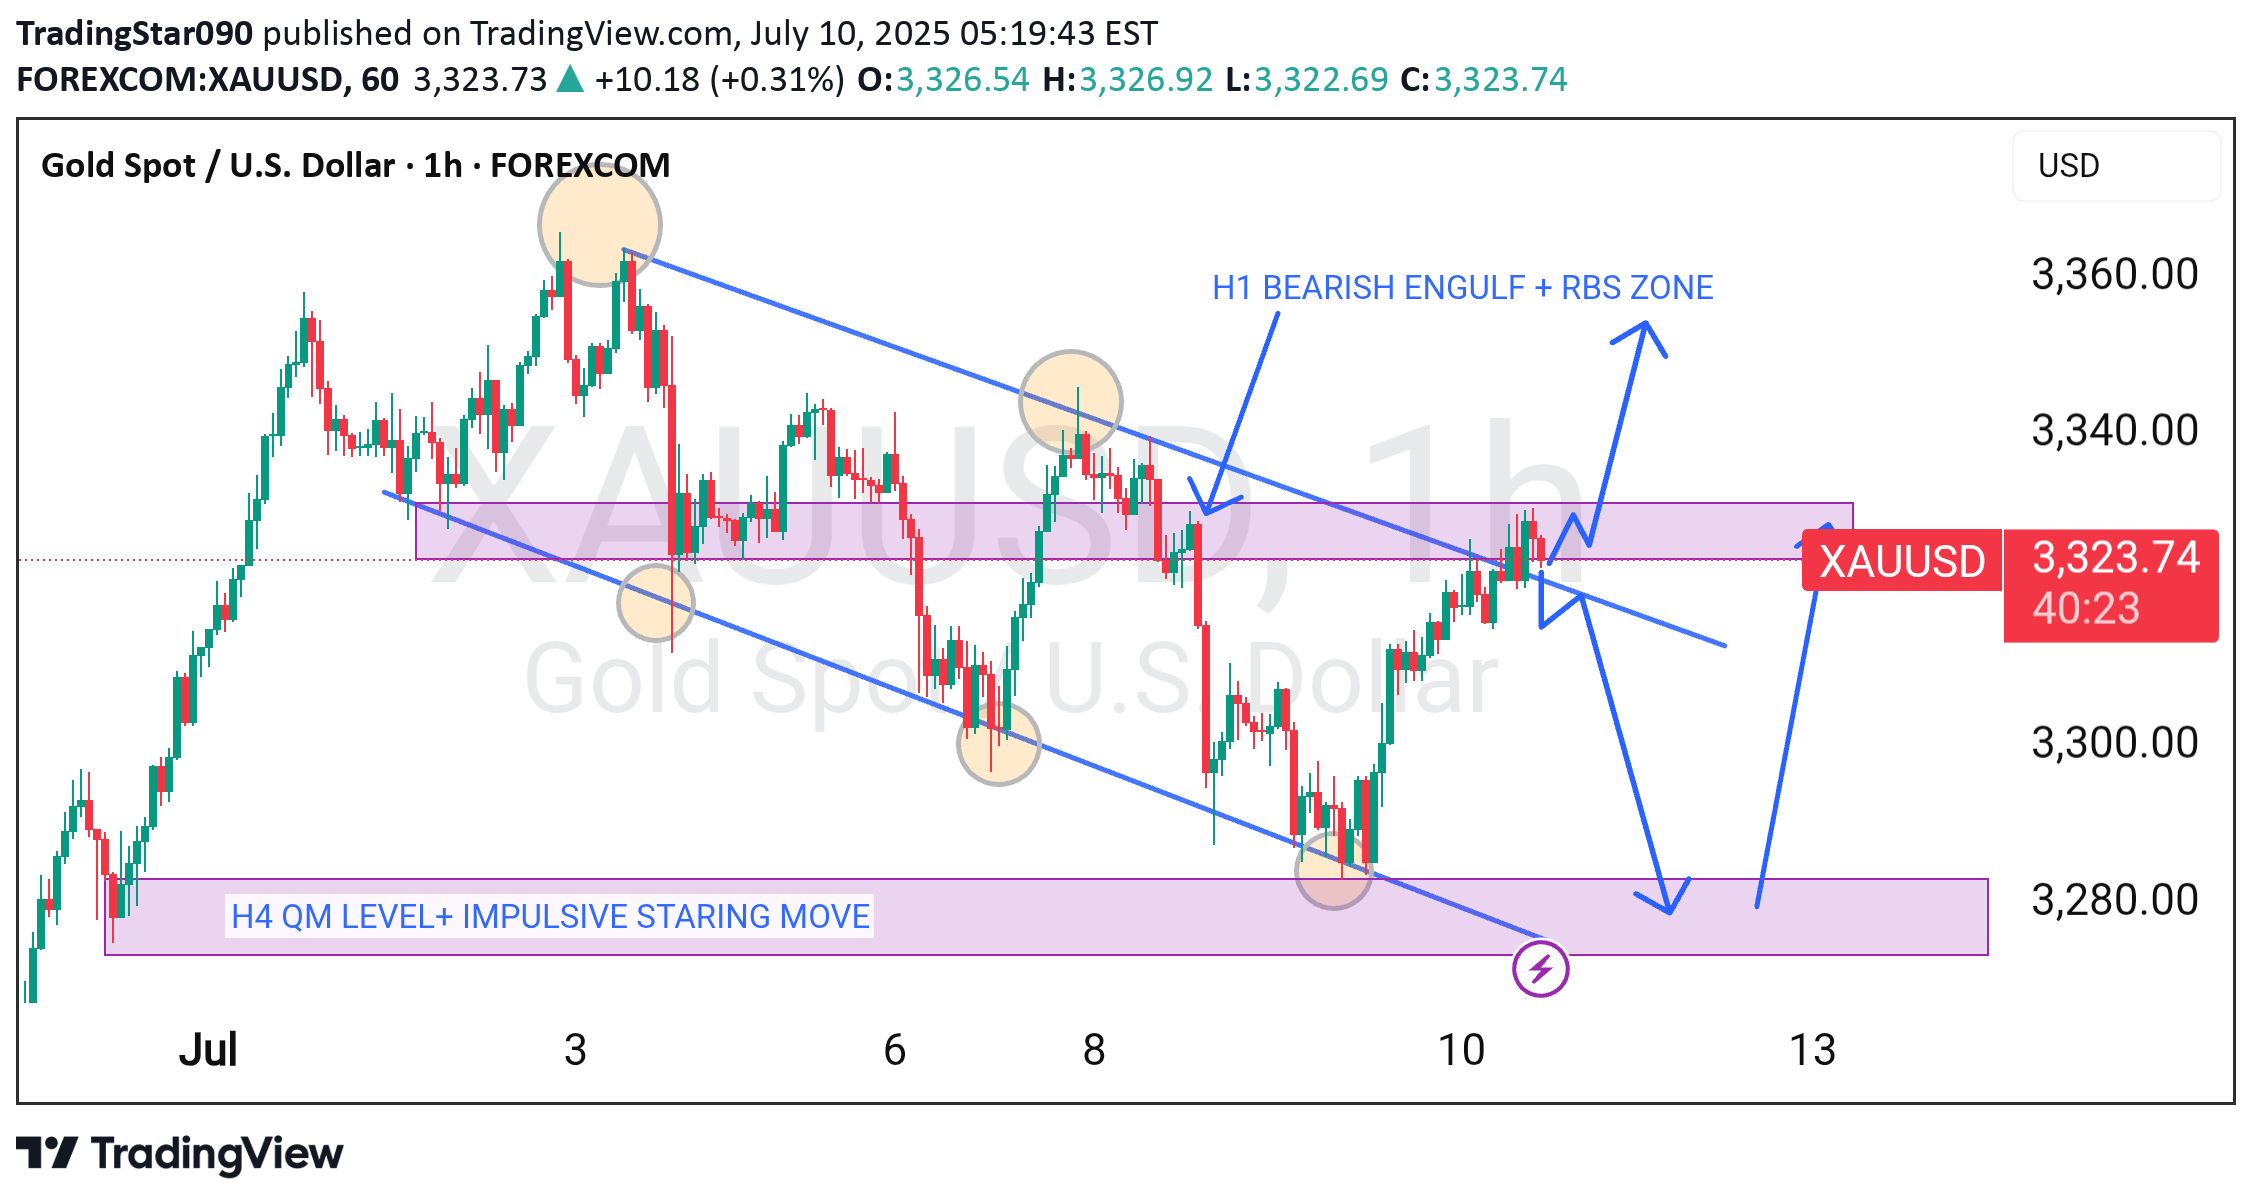
Gold technical analysis H1 Time Frame demand.
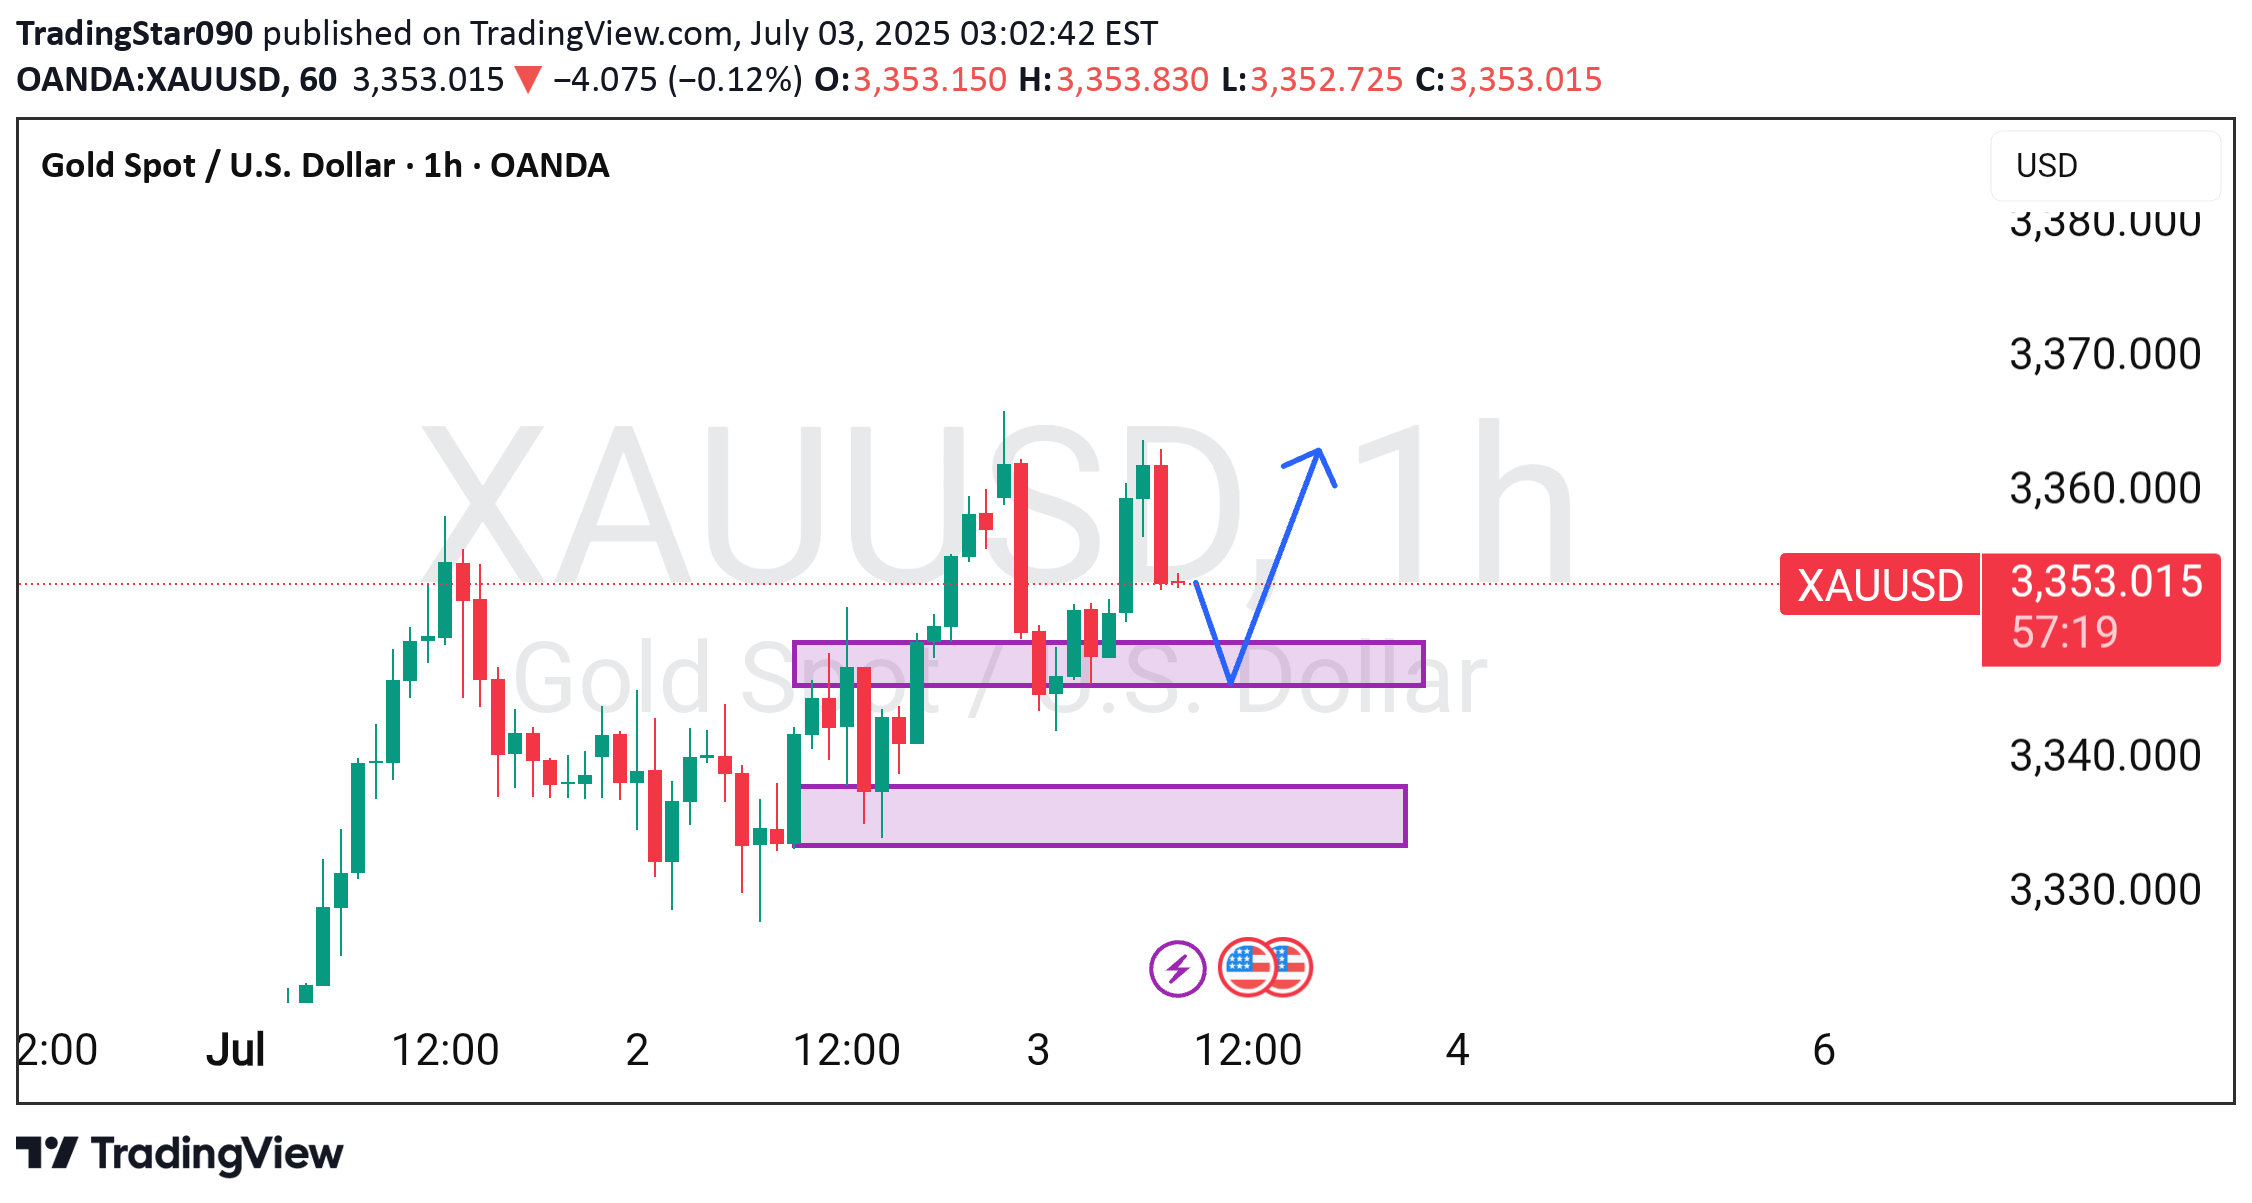
Gold forecast and technical analysis H1 Time Frame next move possible. Not financial advice.
TradingStar090
Gold supply and demand next move possible.
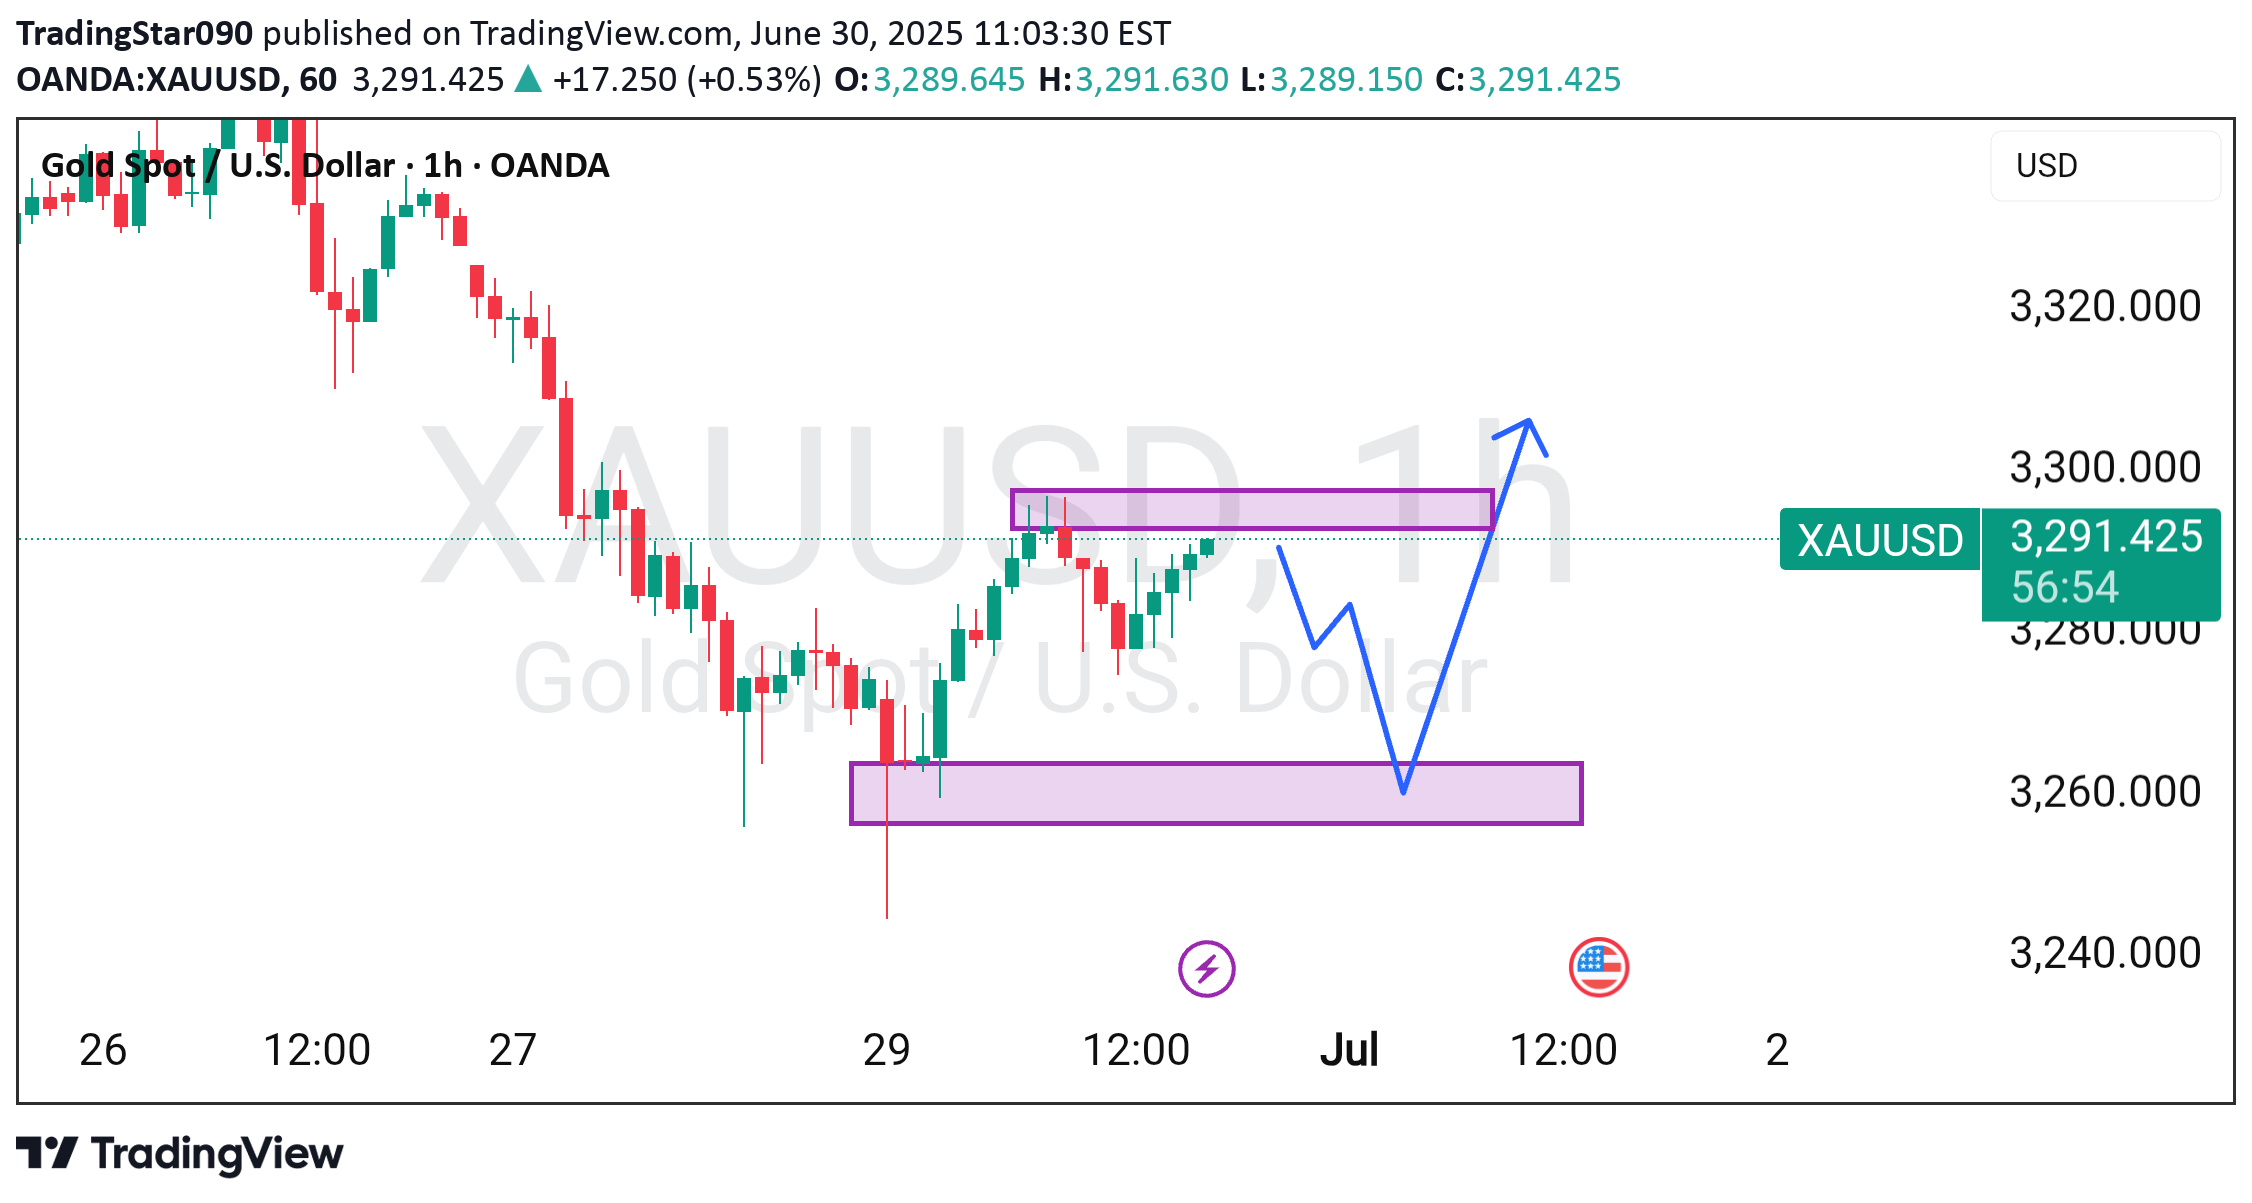
Gold forecast and technical analysis H1 Time Frame next move possible. Not financial advice.
TradingStar090
BTCUSD analysis major trend line breakout.
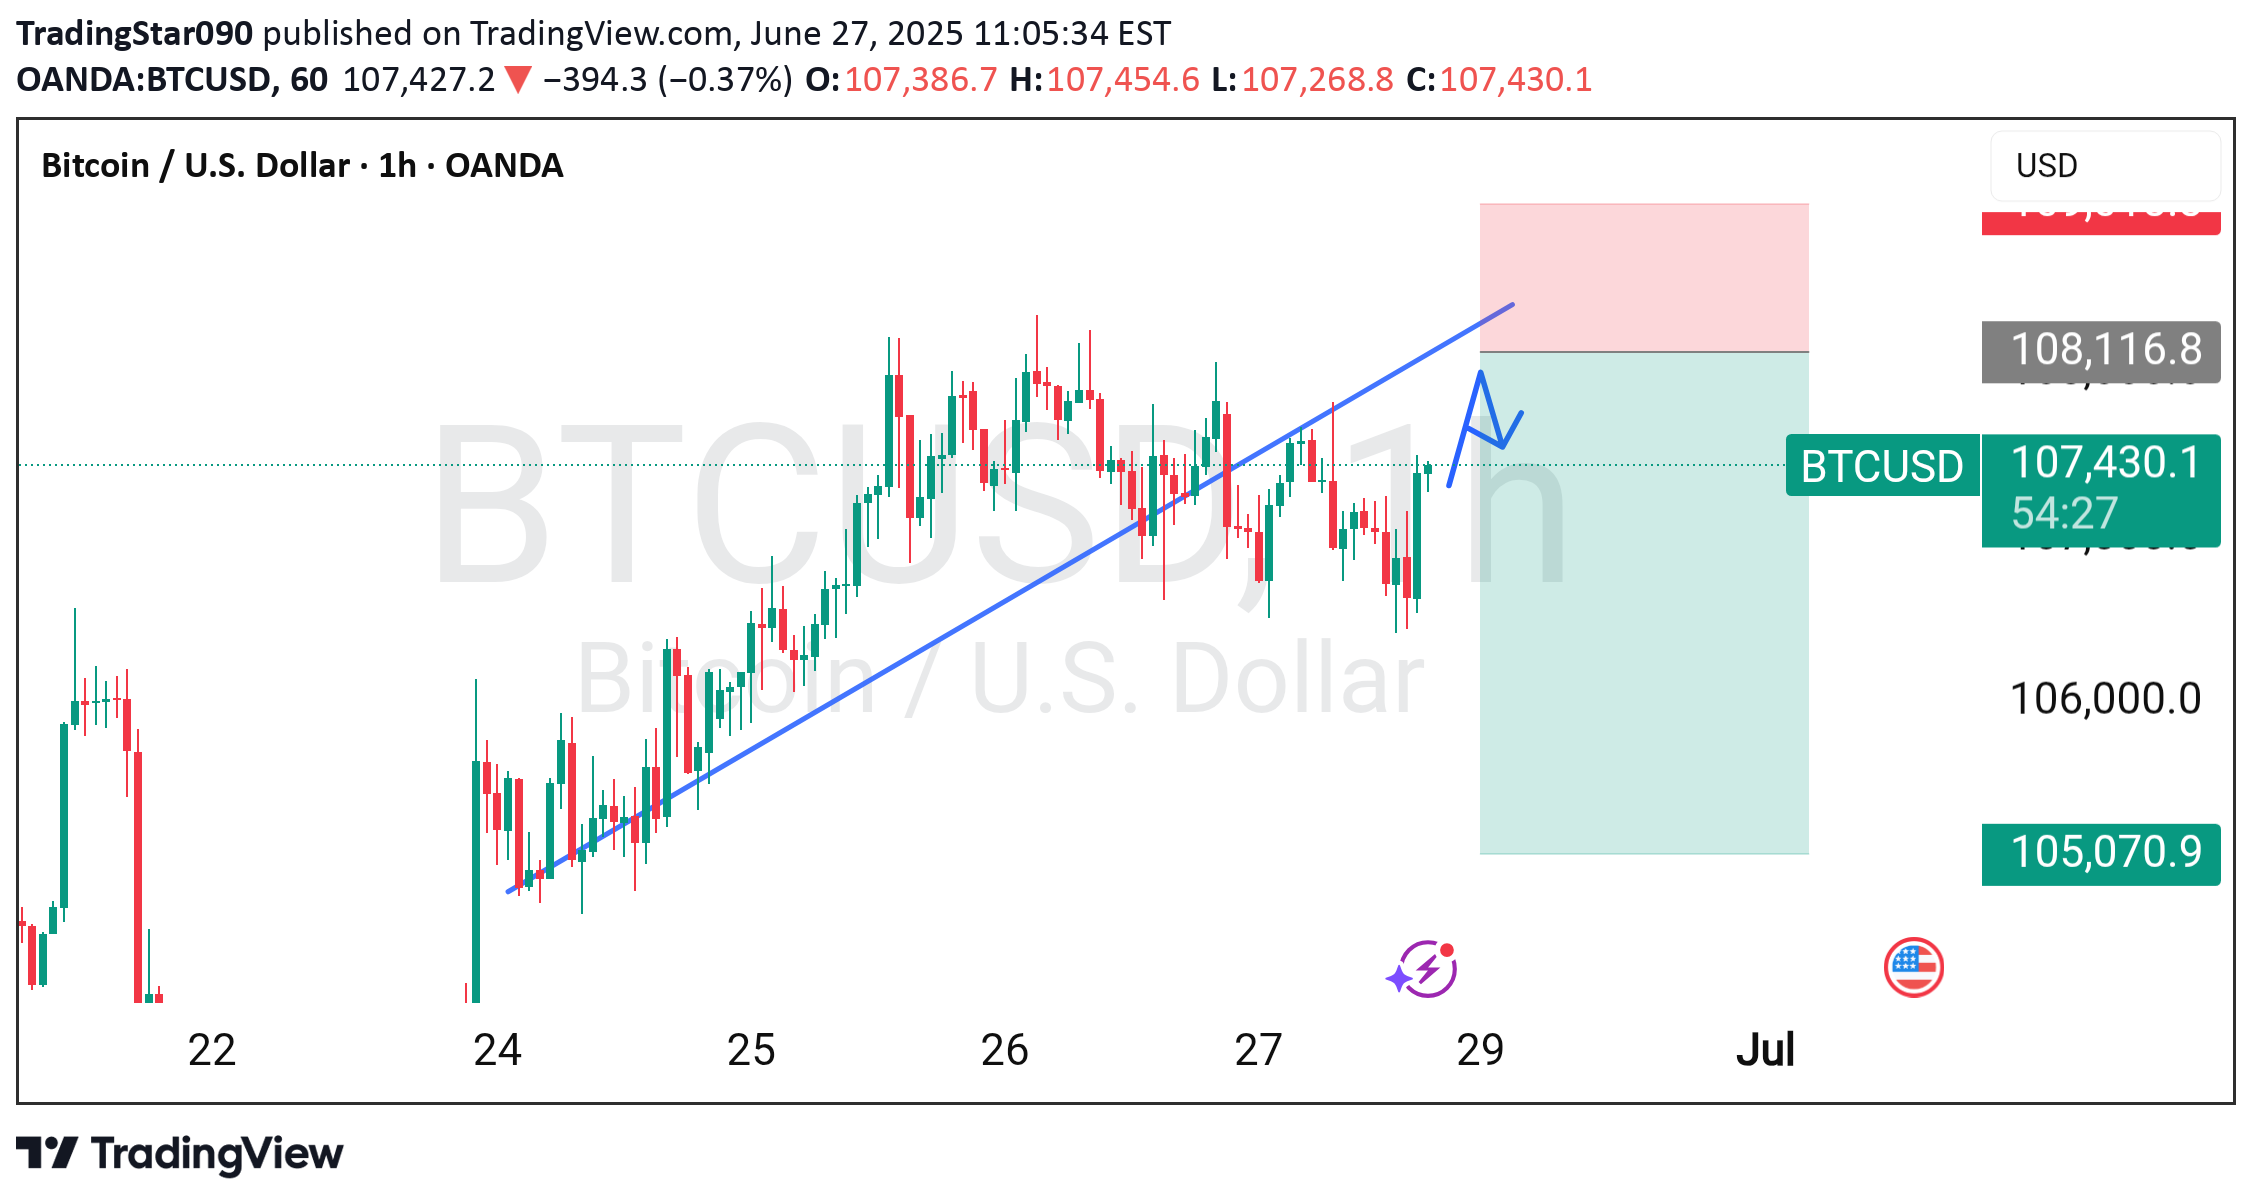
BTCUSD Forecast and technical analysis H1 Time Frame next move possible resion major bullish trend line breakout. Not financial advice.
TradingStar090
Gold forecast and technical analysis m15 analysis.
Gold technical analysis m15 time frame next move possible. If market farm any bullish structure then we can expect upside move. Not financial advice.Active now keep your risk managementXauusd target Successfully reached
TradingStar090
XAUUSD Short

XAUUSD Short Current price is 3288 R1 3300 R2 3310if breakout resistance than you can go for long Target 3335S1 3282S2 3275After Breakout Support Strong Short Sell Target 3260Must use risk management Stay tuned for more successfull ideashttps://www.tradingview.com/x/ix9EDDUs/
Disclaimer
Any content and materials included in Sahmeto's website and official communication channels are a compilation of personal opinions and analyses and are not binding. They do not constitute any recommendation for buying, selling, entering or exiting the stock market and cryptocurrency market. Also, all news and analyses included in the website and channels are merely republished information from official and unofficial domestic and foreign sources, and it is obvious that users of the said content are responsible for following up and ensuring the authenticity and accuracy of the materials. Therefore, while disclaiming responsibility, it is declared that the responsibility for any decision-making, action, and potential profit and loss in the capital market and cryptocurrency market lies with the trader.