
TradeTheVolumeWaves
@t_TradeTheVolumeWaves

What symbols does the trader recommend buying?
Purchase History
پیام های تریدر
Filter
راز ورود شورت موفق با متدولوژی درس ۱۵: راهنمای کامل تحلیل نمودار

Reading the chart using Lesson 15 1. Fib Location (sellers could enter hear) 2. Fake Break 3. Placed AVWAP at the beginning of the wave 4. Largest down wave after a while 5. Push Down PD 75.7S abnormakl speed index 6. Hard to Move up , 74.0S abnormal speed index 7. Entry Short on PRS plutus signal Enjoy!Didn't expect that!
آموزش کاربردی XLM: چگونه با اندیکاتورهای پیشرفته (SI و پلاتوس) نمودار را بخوانیم و معامله کنیم؟
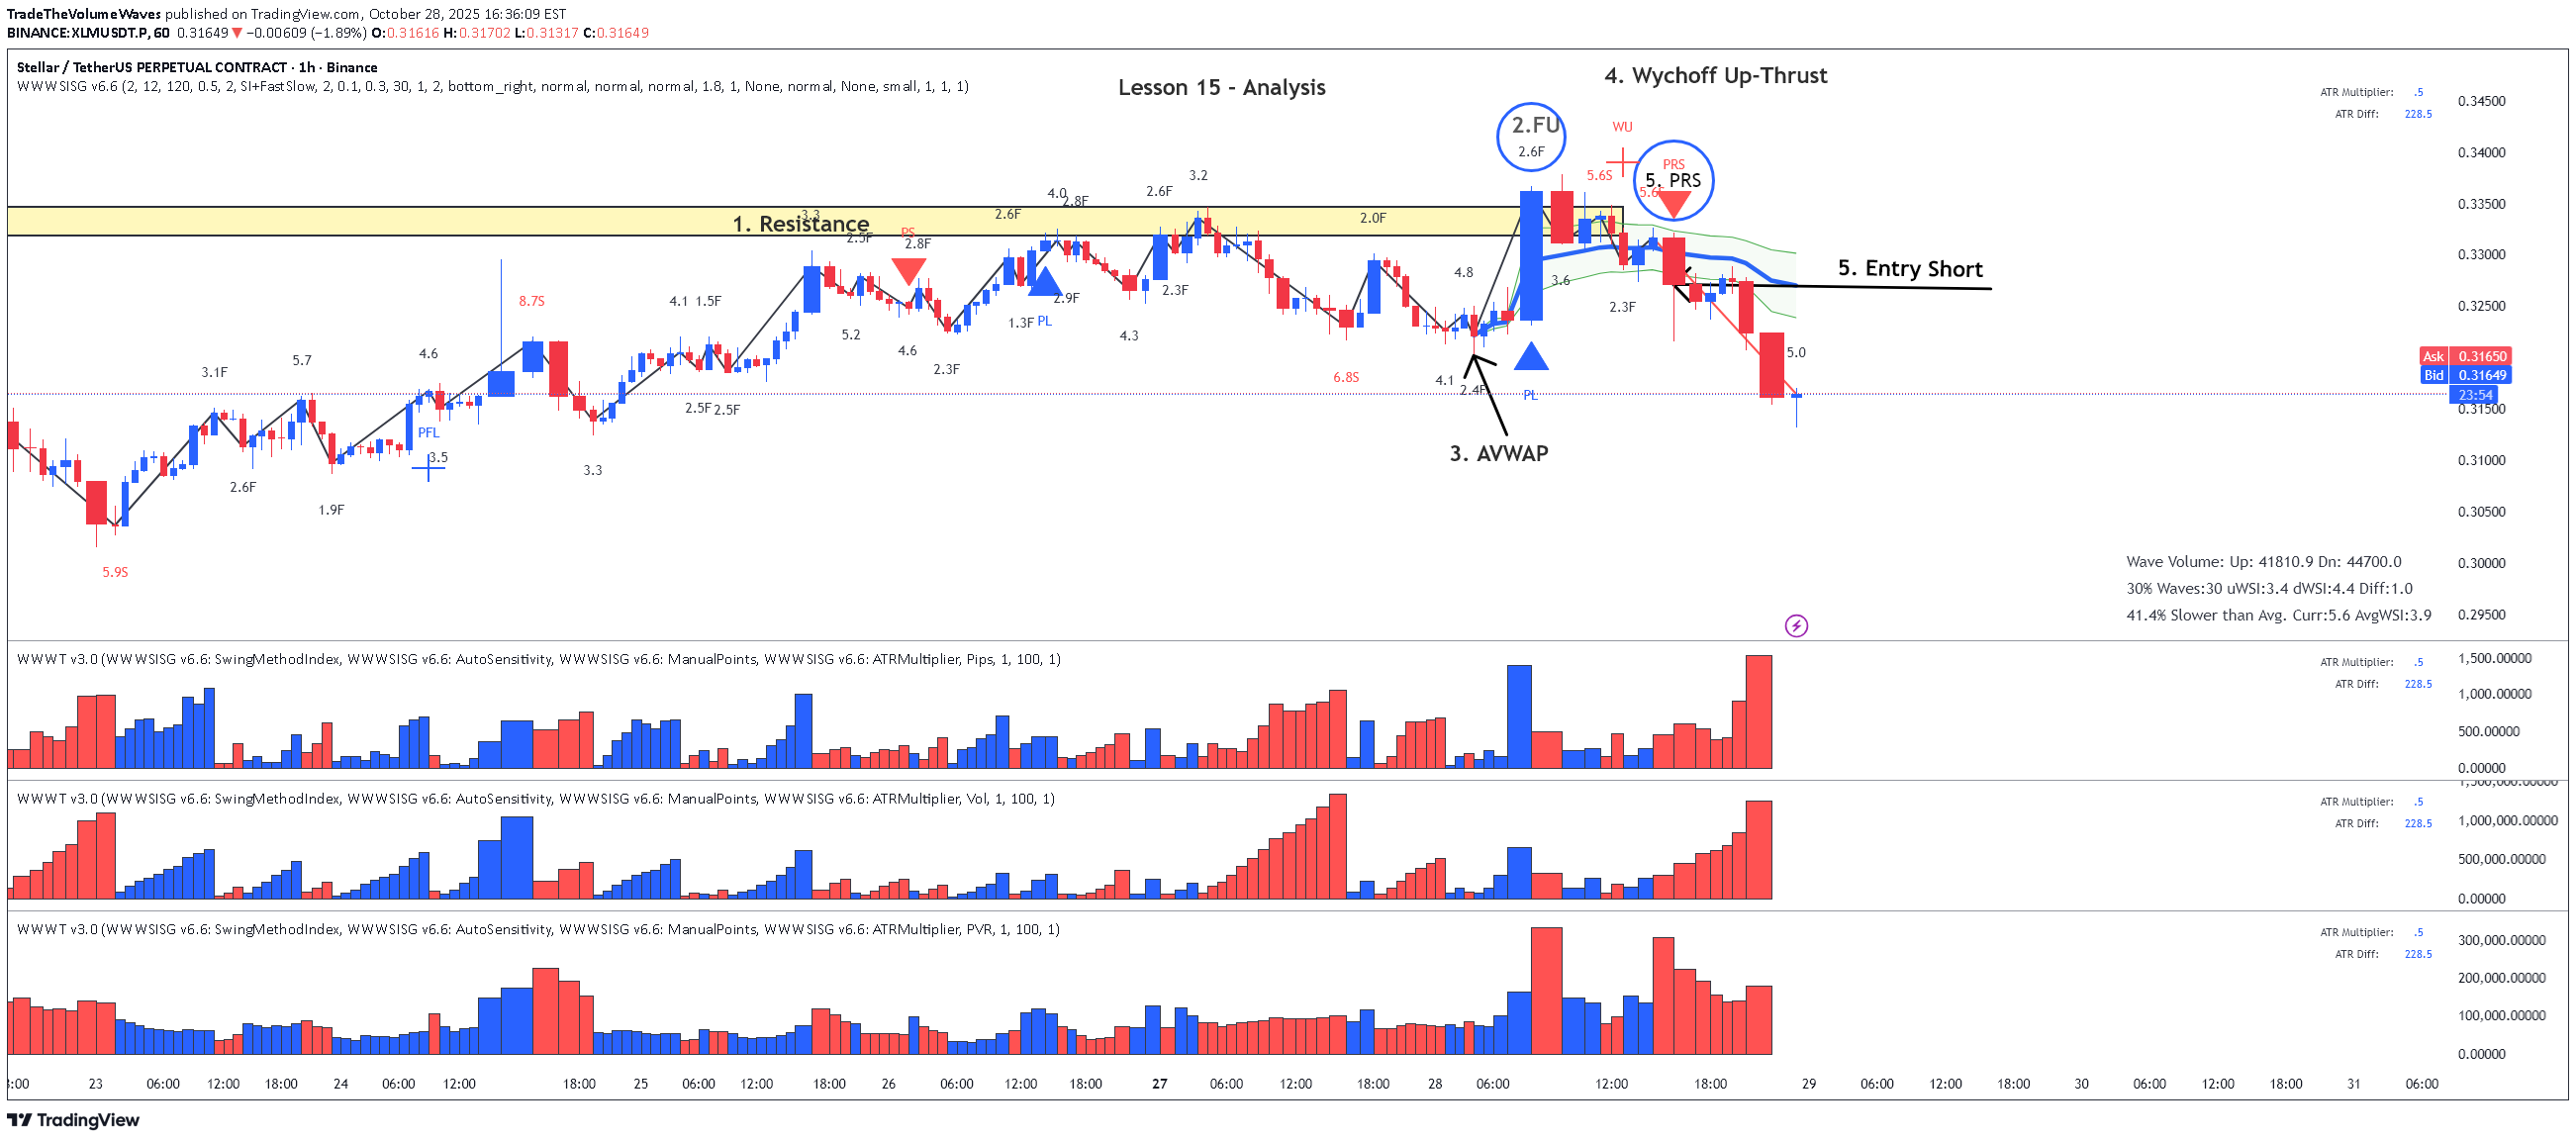
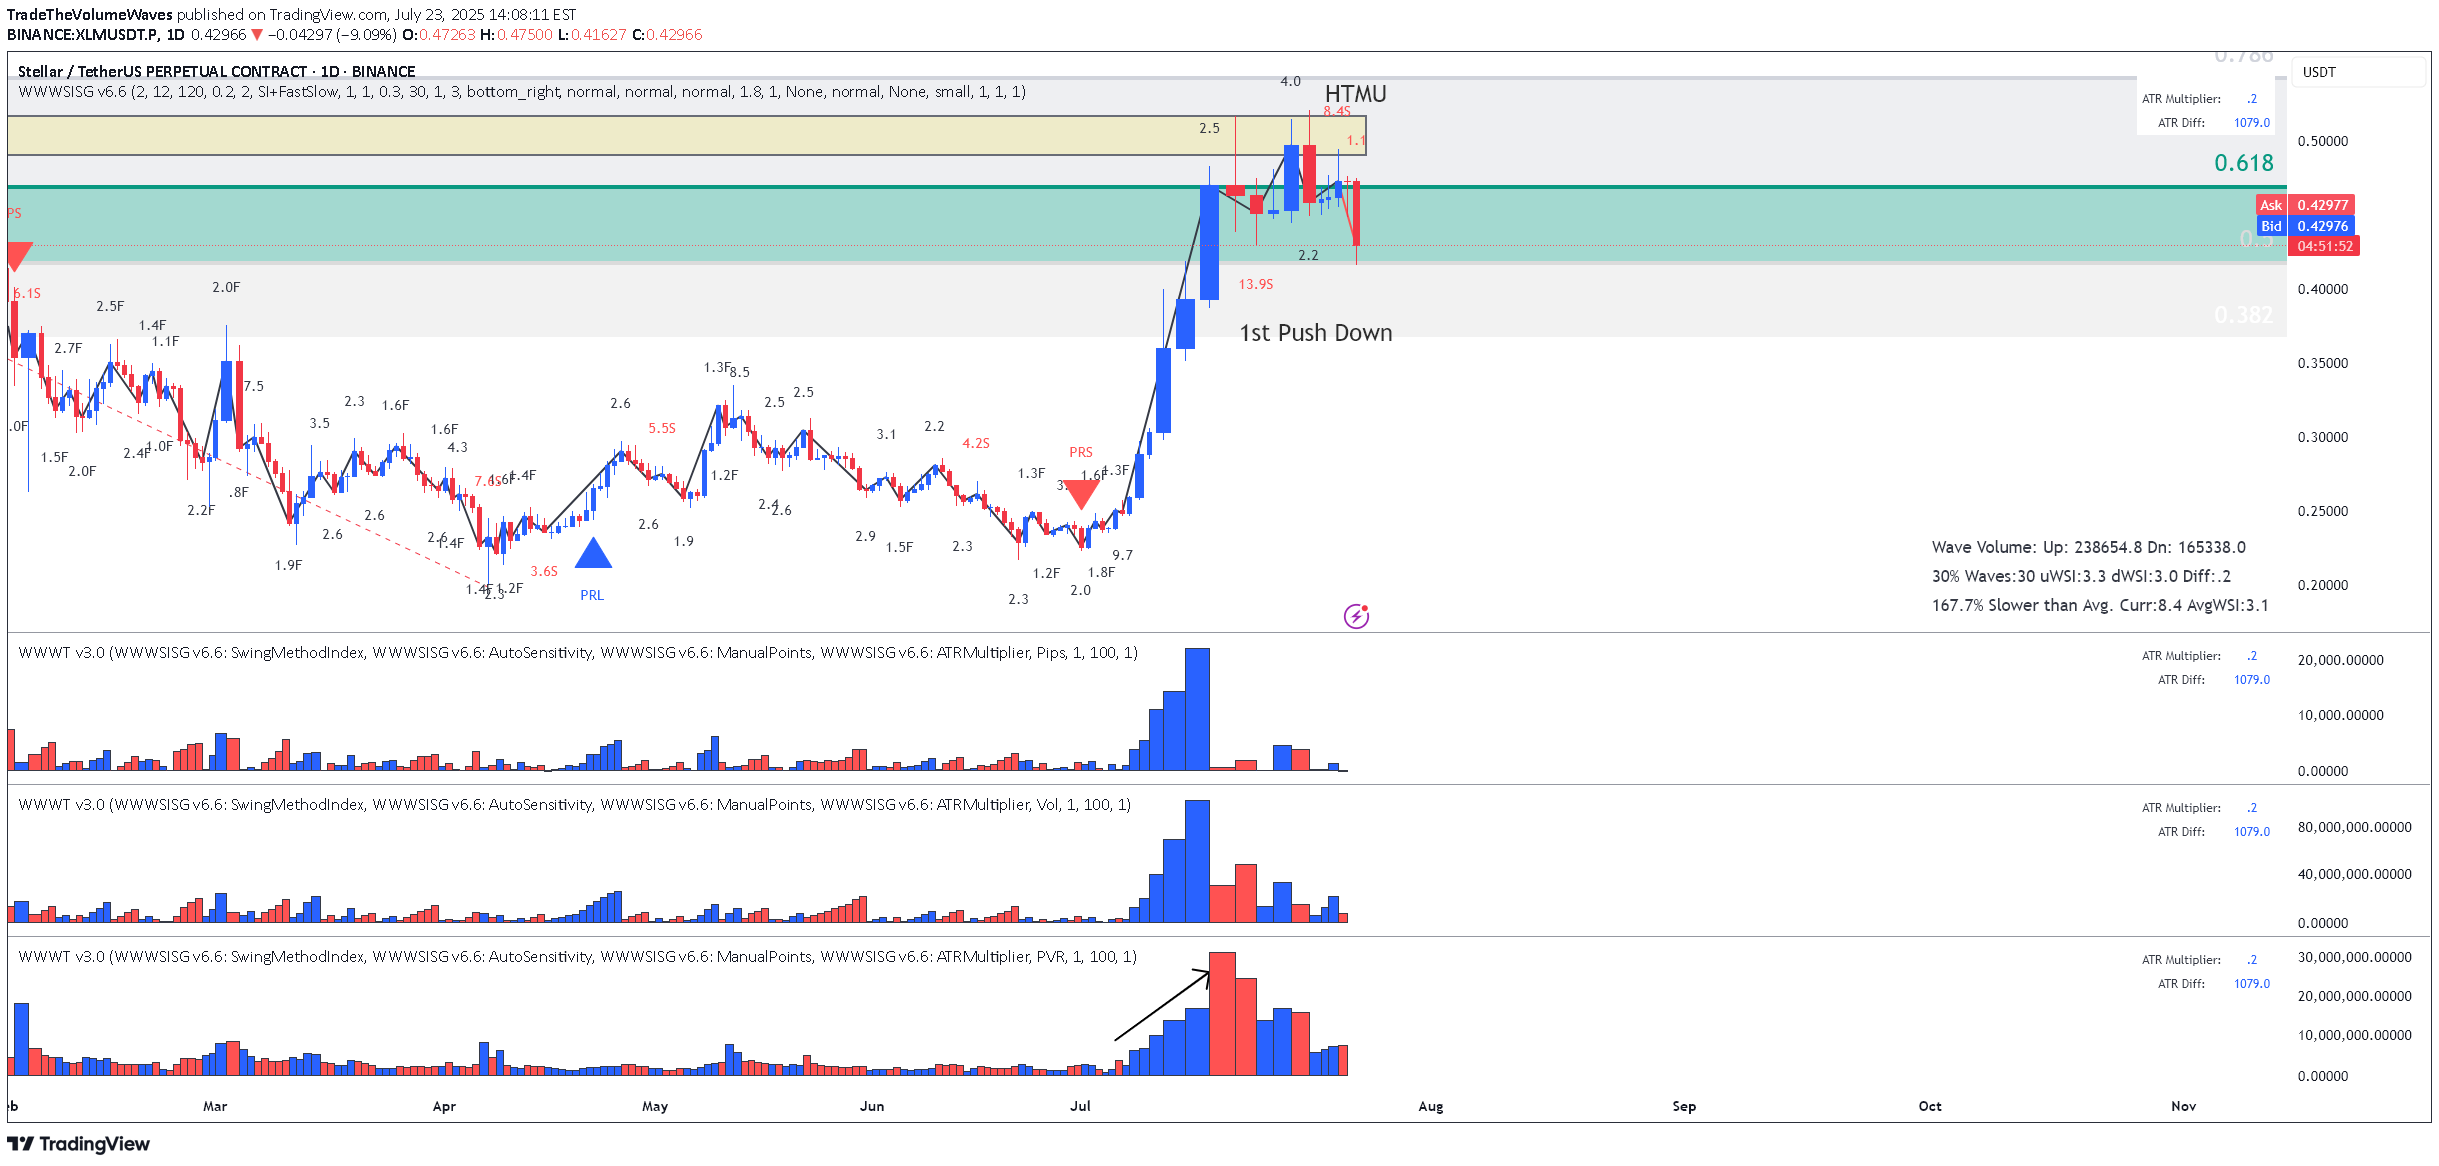
Lesson 15 Methodology - Reading the Chart using Speed Index and Plutus singals 1. Resistance Level (sellers might come in) 2. FU - Fast Up - with SI 2.6F = Fake Break 3. Placed AVWAP at the beginning fo the FU wave and waited for price to cross downwards and pull back 4. We get a Wyckoff Up-Thrust signal from Plutus - WU with an abnormal SI 5.6S 5. Second Abnormal SI 5.6S and the confrimation entry for Short the PRS crossing AVWAP downwards ......and down we go!!! Enjoy!
چرا کاردانو (ADA) وارد فاز فروش شد؟ تحلیل دقیق ورود به معامله شورت

On the Left is the Daily Chart and the Location is a Fib Area. Analyzing the 1Hr chart for my entry: 1. As previous said Location is Fib - this is a great location for seller to come in 2. Fake Break on Fib 61.8 3. Indcreasing PVR on the up wave as we approach Fib 61.8 and High PVR volume at the top. 4. Hightest down volume wave after a very long time 5. Placed AVWAP and waited for a Plutus short singal below it 6.... and finally the short signal arrives PDHTMU (Push Down and then Hard to Move Up) with a high Speed Index of 8.4S Target in the middle of Fib, but as long as we get to 50Fib we move are stop to breakeven or trail it. Enjoy!Stop hit and back to Fib 61.8
ETHFI Short - Possible Trend Change

Reading the Chart using the wave and Speed Index: 1. Major Resistance level coming from the Daily Chart 2. Abnormal Speed Index 225.5S - This what I call the "First Push Down" - PD 3. Abnormal Speed Index on up move 46.1S - This is what I call "Hard To Move Up" - HTMU, that never breaks the highest High. 4. Highest PVR bar Considering the above I have entered Short!
UXLINK - Just Short Based on PVR reading and Plutus Short Signal
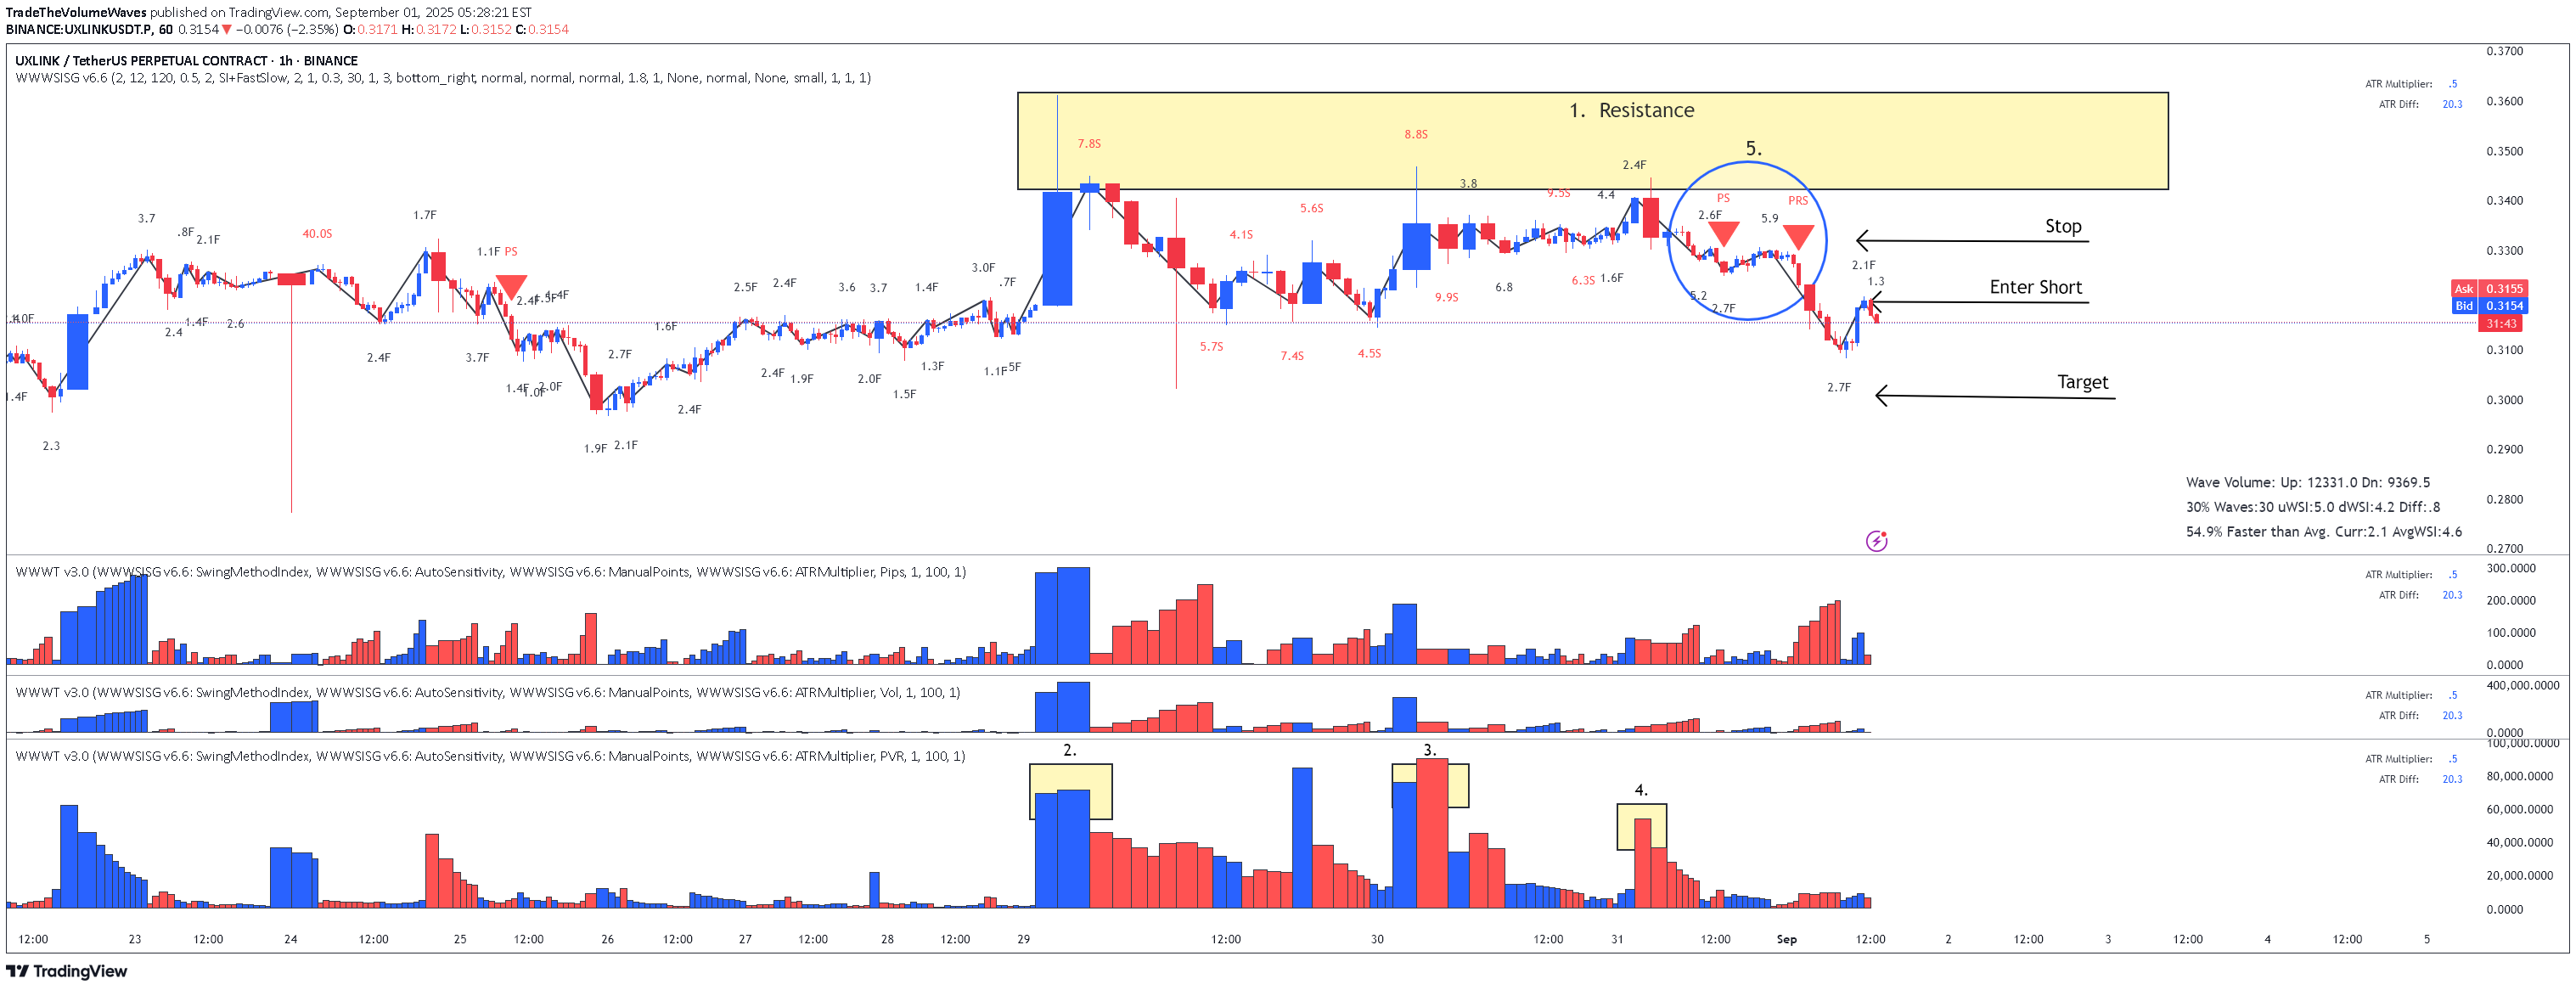
Reading: 1. Resistance Level 2. 3. and 4 High PVR when ever we approach Resistance 5. Plutus Short signalsClosed with profit before reaching target because it's ranging and I do not like the way it behaves
AAVE - Short trade closed with profit on Fib
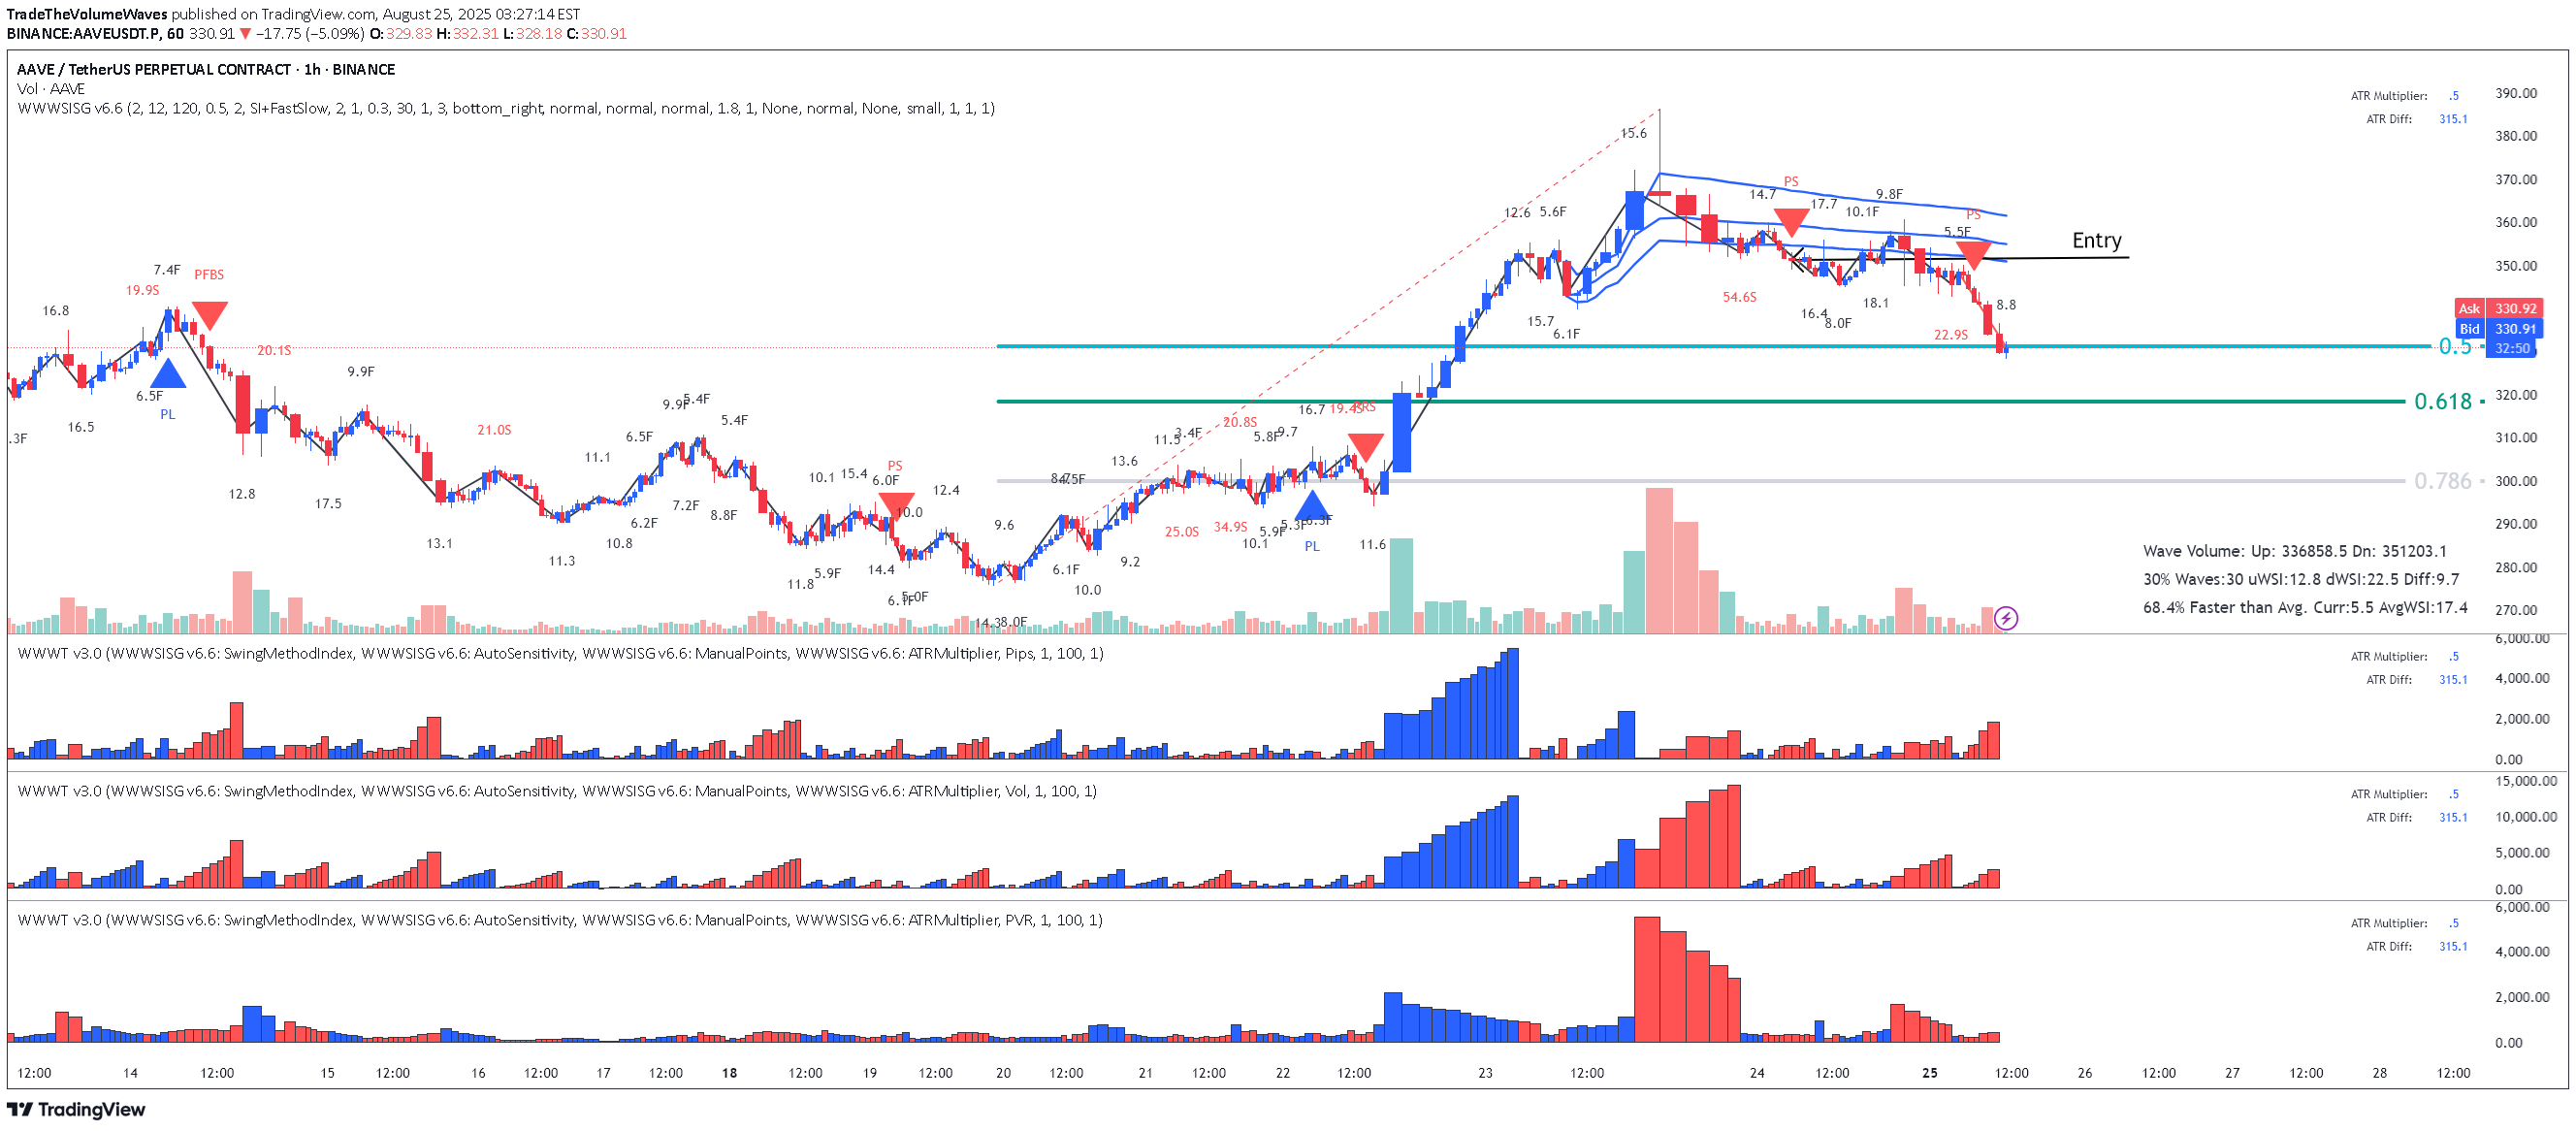
Based on a previous post: https://www.tradingview.com/chart/AAVEUSDT.P/6OoYehTy-AAVE-Entered-Short-based-on-Lesson-15/ Closed on Fib , it could go to 61.8 but let's not be greedy.
AAVE - Entered Short based on Lesson 15
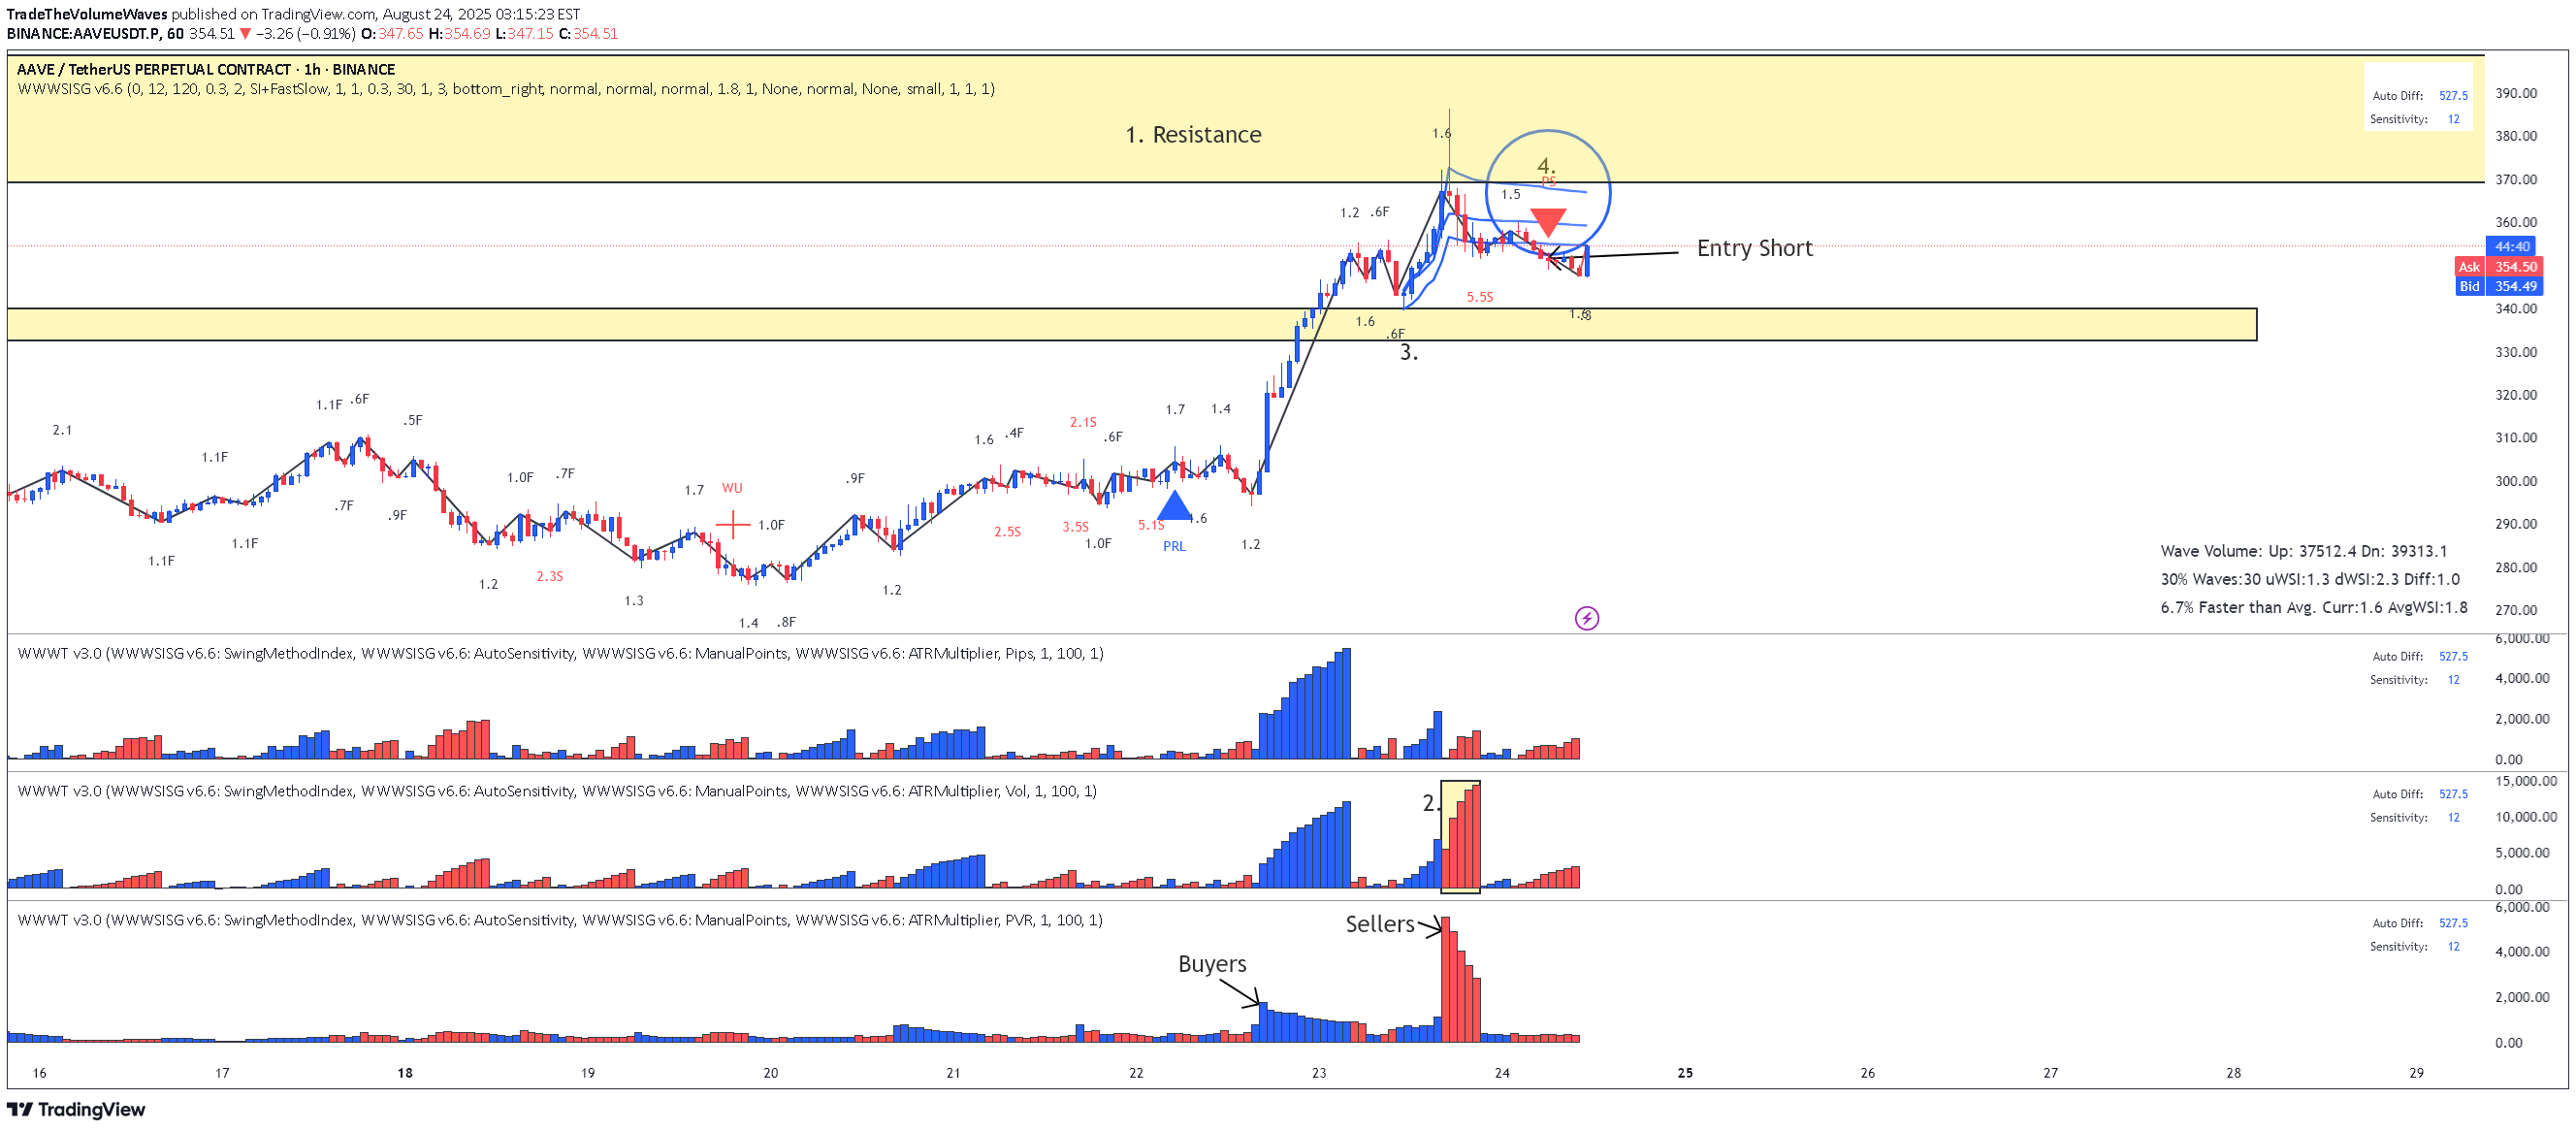
Reading the chart with Lesson 15 methodology: 1. Location: Resistance coming from the weekly chart 2. Largest down volume wave after a long time 3. Place AVWAP at the of the last up wave. Price crossed it and pulled back to AWVAP 4. The Entry, a PS signal after the pullback to AVWAP Enjoy! PS. PVR show Buyers and Sellers locations.
LTC- LitCoin - This is how a Fake Break on Fib looks like
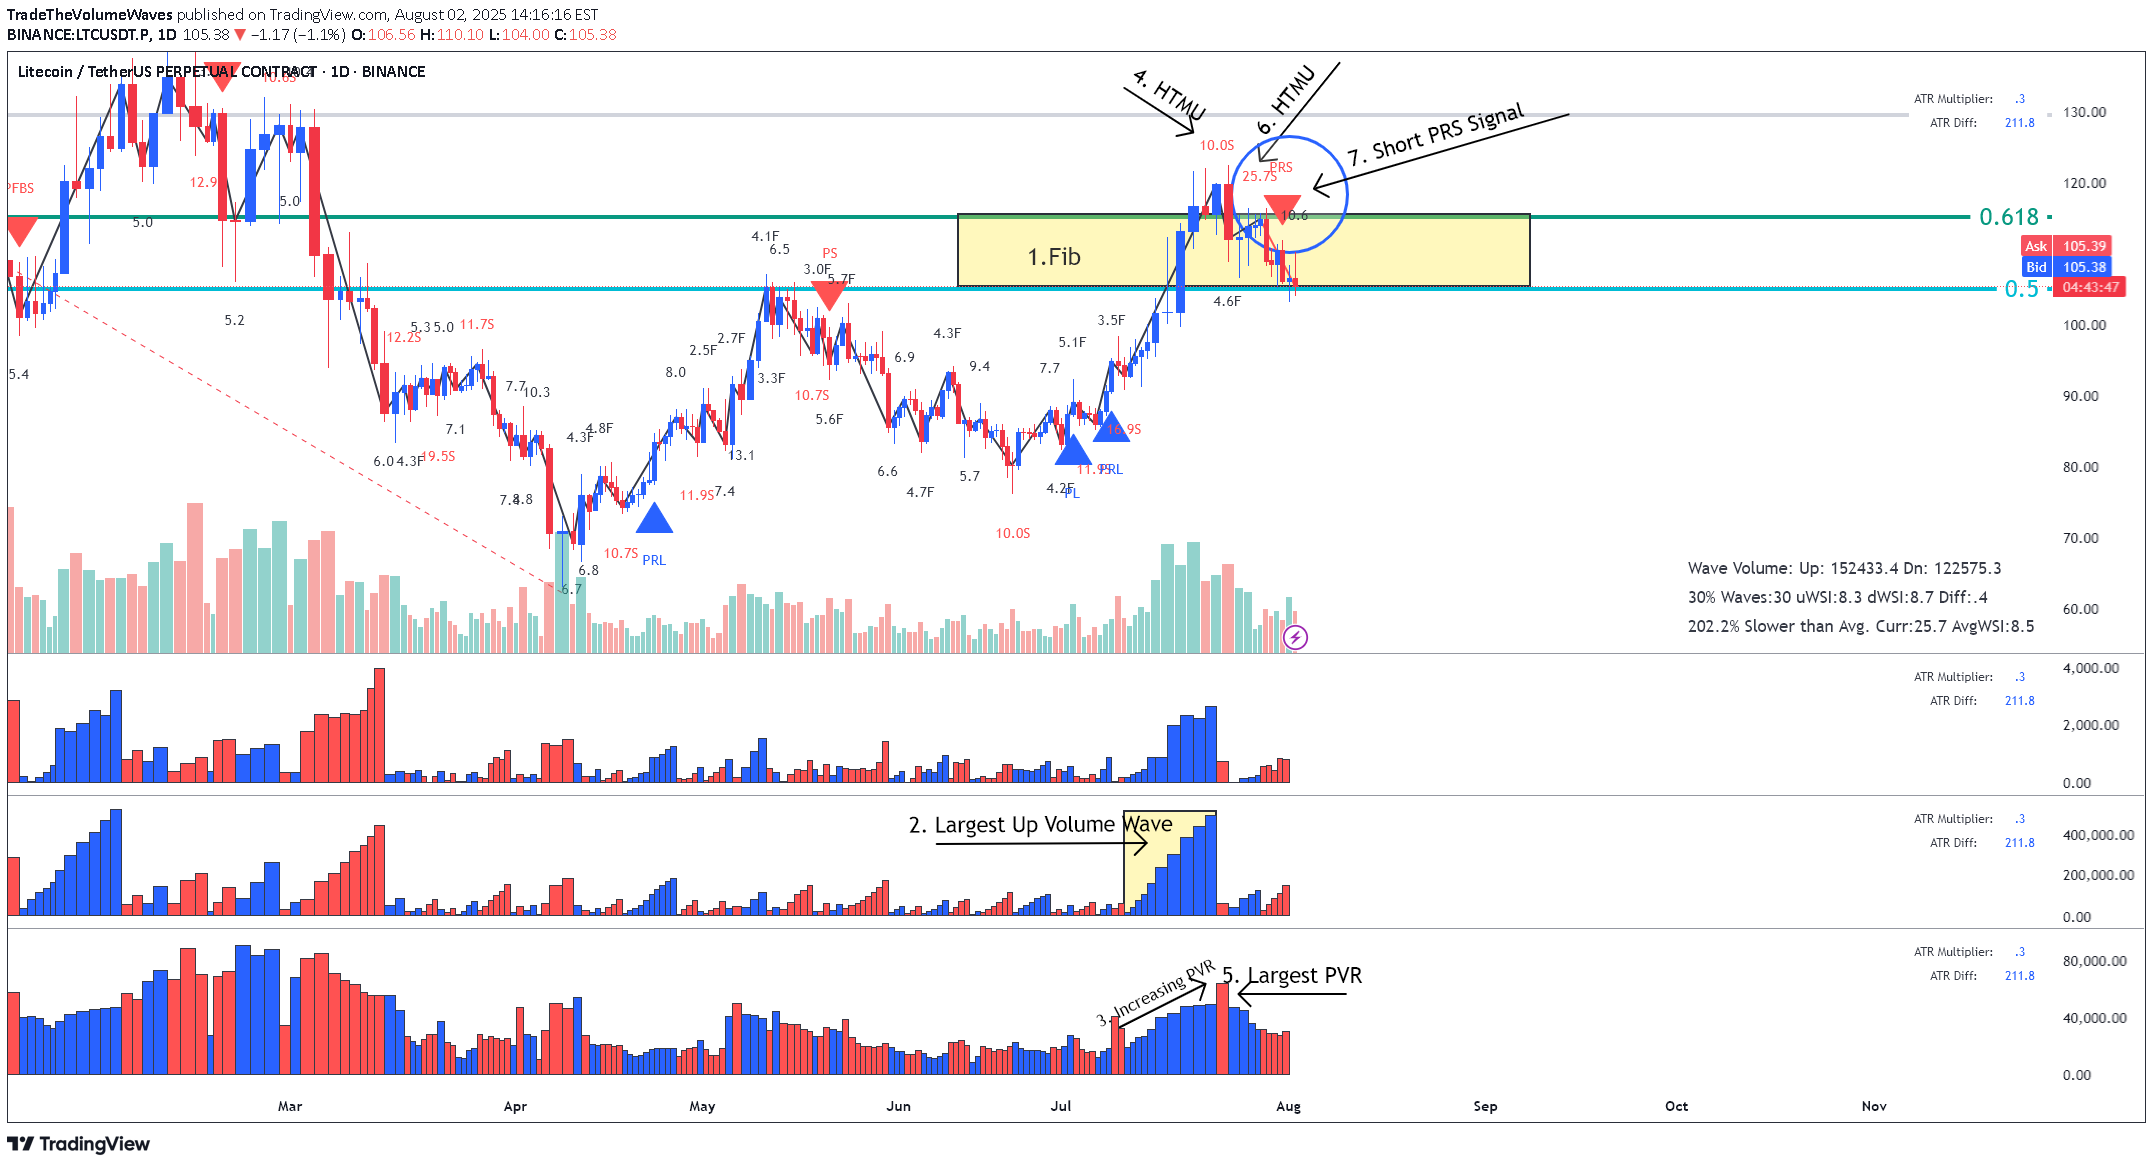
This is how a Fake Break on Fib looks like using Weis Wave with Speed Index Reading the Daily Cha rt 1. Fib Location - Sellers could enter here 2. Largest Up volume wave after a while - also sellers could be hidden in there. 3. Increasing PVR (progressing volume rate) = as we approve the top more volume comes in (sellers) 4. This up wave has the highest Speed Index 10.0S of all the up waves in the trend, that's a HTMU (hard to move up = sellers) 5. The highest PVR bar =sellers 6. Another Abnormal Speed Index 25.5 S - that's another HTMU = more sellers on the up move, price cannot progress upward anymore. 7. and finally down we go with a PRS signal. All the ingredients for the Short were there. Reading Weis Wave with Speed Index is like reading a book, page after page, until you reach to the last page that the writer has kept the surprise, the only difference is that this is never ending chart book with many stories. This was the story of LTC for now. I think this story has not ended yet and continue to drop to another Fib, the details on the 1HR!. I hope you enjoy this chart reading lesson using Weis Wave with Speed Index.
BNB Binance Coin: Lesson 15 methodology did the job again
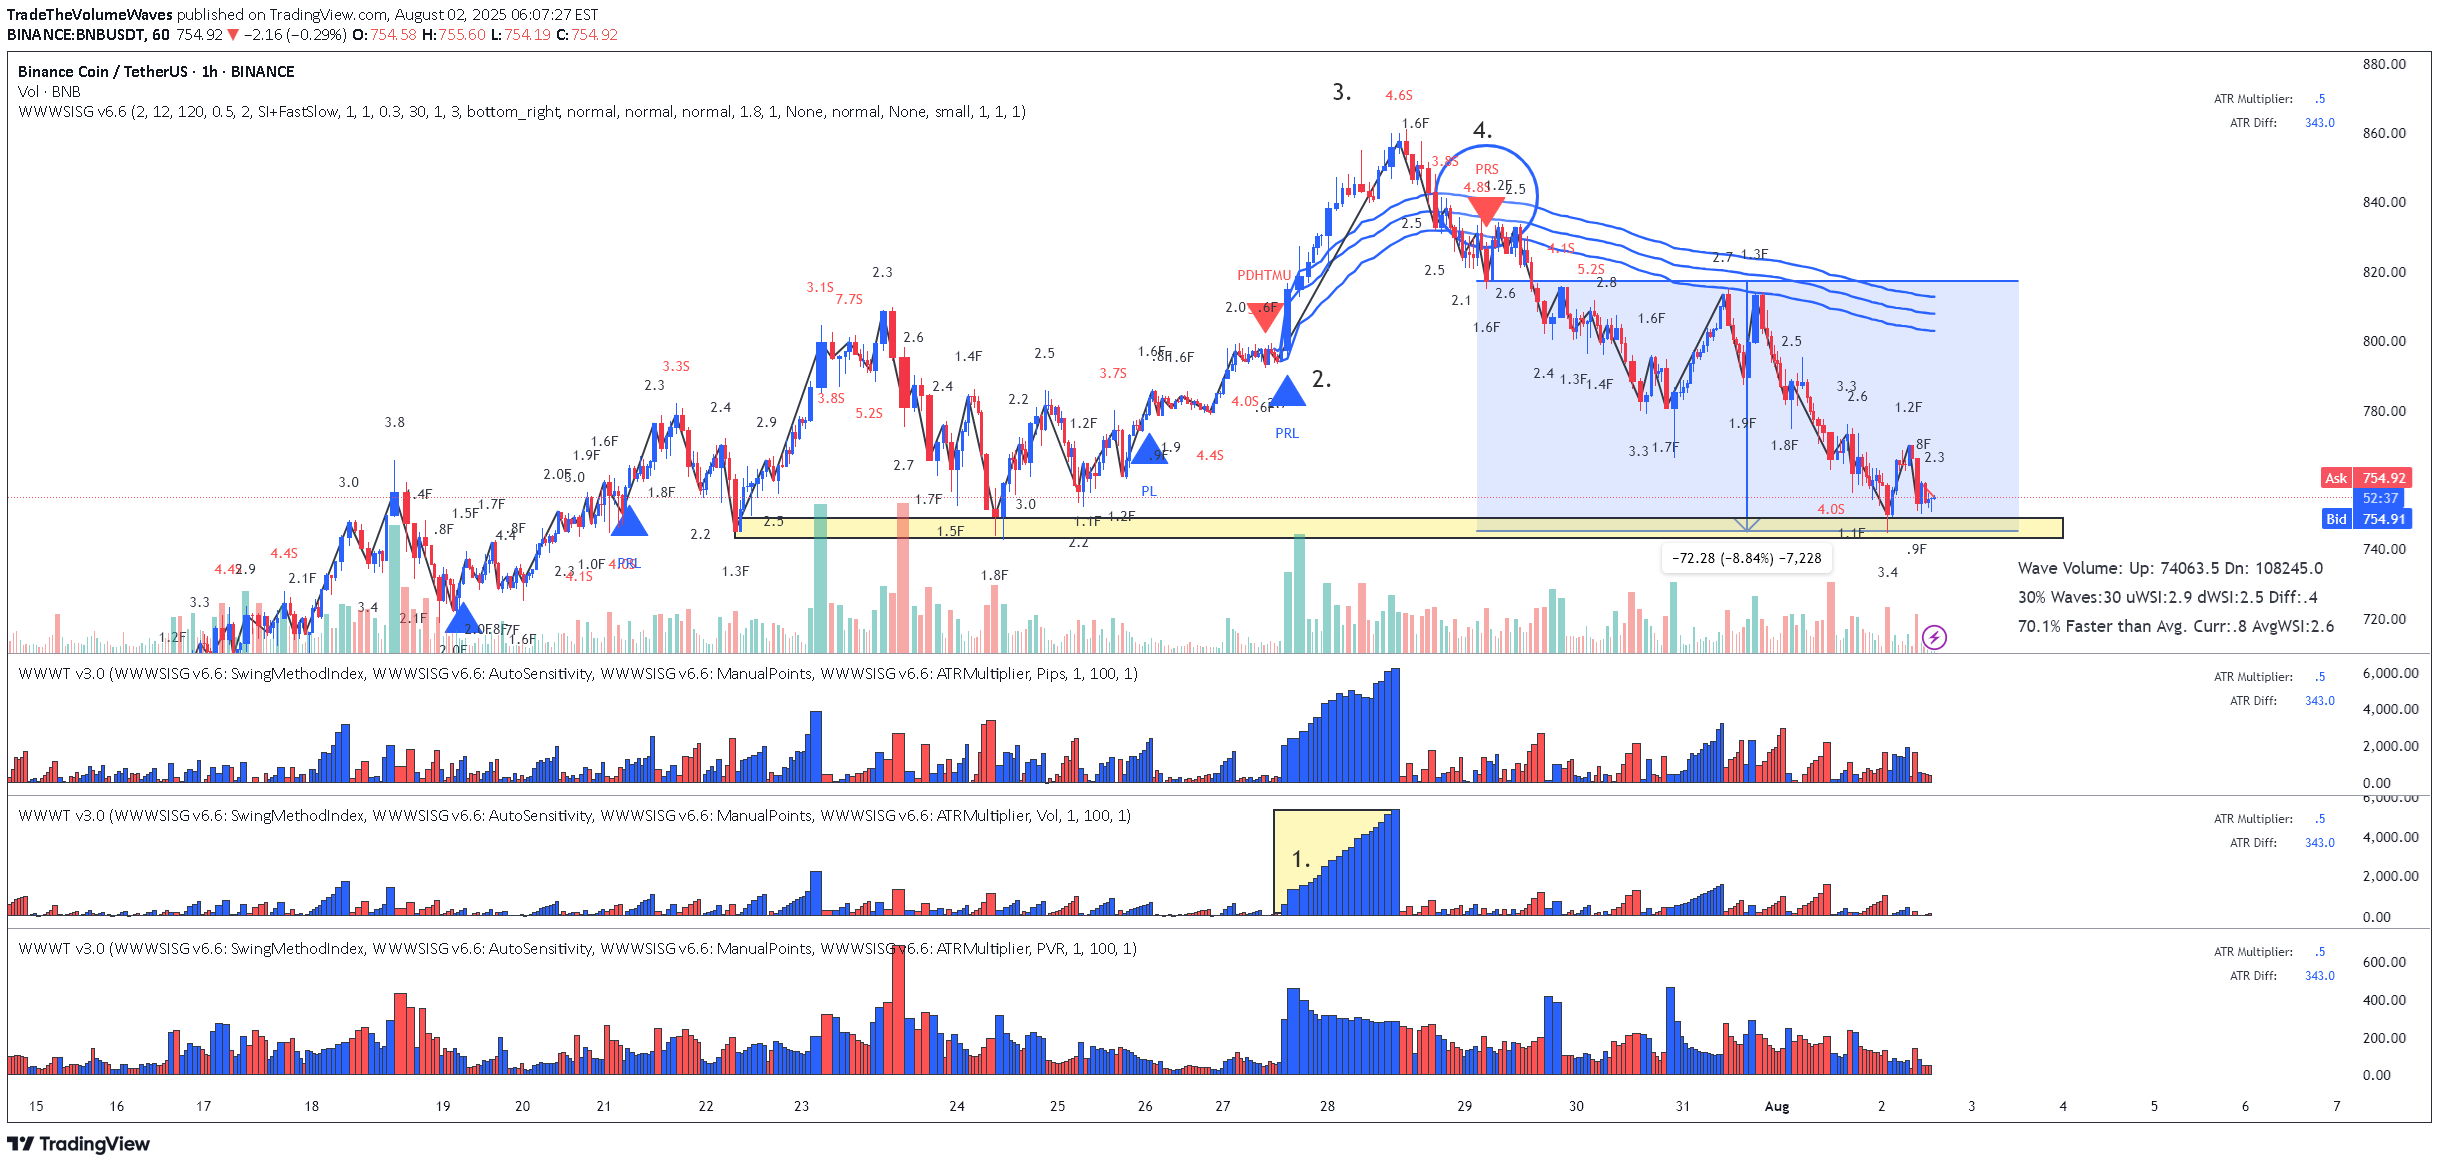
Lesson 15 methodology (annotations in sync with the chart): 1. Largest up volume wave after a while - sellers might be in there. 2. Placed AVWAP and waited for price to cross downwards and pullback again on AVWAP 3. HTMU (hard to move up) - Abnormal Speed Index 4.6S at the top 4. Entry short signal PRS with abnormal SI 4.8.2 (price has a hard time to move up - absorption) Simple as that. Enjoy!
HOW TO: Reading the Daily Chart on XLM - getting ready to Short
In this video I will demonstrate how I read the chart using two indicators Weis Wave with Speed Index Signals and Weis Wave - Wave Types. Enjoy!
Disclaimer
Any content and materials included in Sahmeto's website and official communication channels are a compilation of personal opinions and analyses and are not binding. They do not constitute any recommendation for buying, selling, entering or exiting the stock market and cryptocurrency market. Also, all news and analyses included in the website and channels are merely republished information from official and unofficial domestic and foreign sources, and it is obvious that users of the said content are responsible for following up and ensuring the authenticity and accuracy of the materials. Therefore, while disclaiming responsibility, it is declared that the responsibility for any decision-making, action, and potential profit and loss in the capital market and cryptocurrency market lies with the trader.