
Trad3WithFaraz
@t_Trad3WithFaraz

What symbols does the trader recommend buying?
Purchase History
پیام های تریدر
Filter
Trad3WithFaraz
FLOKIUSDT

FLOKIUSDT is showing good bullish momentum. As price break through resistance area and successfully closed above resistance. If the price sustain this broken level there are more chances of massive run to the upside.
Trad3WithFaraz
Bullish Divergence in Gold

Gold looking good for buyers on H1 as it has formed bullish divergence. Move above 2617 would test 2644 and 2680 resistance zone. Stop loss for buyers will be below 2689.
Trad3WithFaraz
TAOUSDT

The price is testing a confluence of horizontal as well as vertical support in the 260 region. This horizontal support has been tested 2 times so the 3rd pivot to the horizontal support is very important. Additionally, there is trendline support. Buyers are likely to remain in control above 265. The target for this rally should be 700
Trad3WithFaraz
Buy Theta

The falling wedge pattern has been broken, along with a series of lower highs and lower lows. The formation of a higher high is a positive sign for buyers. On the upside, buyers can target resistance levels at 3.24 and 3.35.
Trad3WithFaraz
Sell YGG

Bearish divergence has formed on the H1 chart, signaling a concerning development for buyers. If horizontal support breaks, at 1.13100 – which is also considered a Lower Low – then selling momentum is likely to increase. The targets for sellers should be at 1.01 and 0.90 respectively.It has broken previous higher high. Our sell stops didn't trigger.
Trad3WithFaraz
Sell ZRXUSD

Following a bullish phase and distribution phase, the market has entered into bearish trend on 1HR TF. Currently, it is showing a pattern of lower lows and lower highs, signaling a shift towards a bearish trend. 0.76 and 0.61 are downside targets for short sellers.TP1 Hit. Move SL to BE.
Trad3WithFaraz
Buy CRV
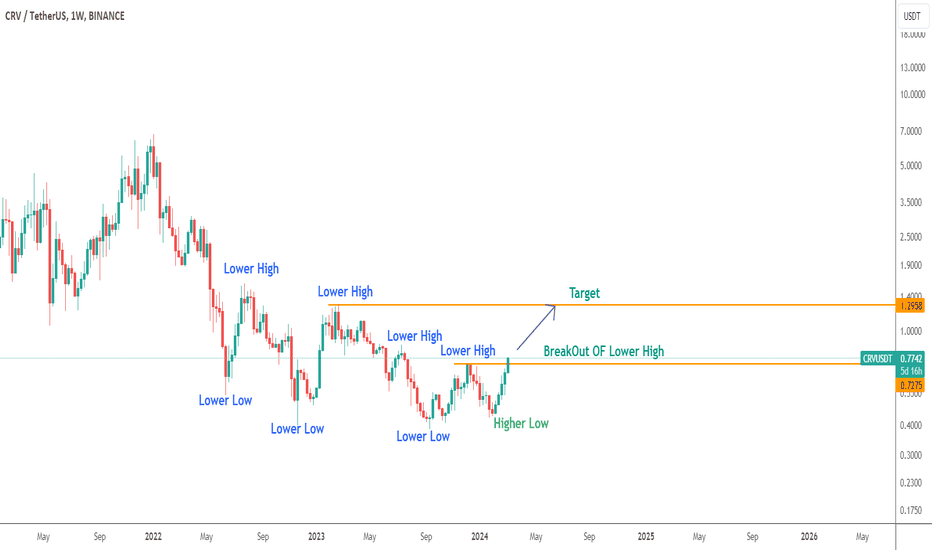
The series of lower lows and lower highs has been broken. The recent break above 0.74, where the last lower high occurred, signals a bullish trend. On the upside, 1.29 serves as a resistance level, with potential targets for buyers.
Trad3WithFaraz
Sell Below 2870

Bearish divergence has formed on the H1 chart, signaling a concerning development for buyers. If the ascending parallel channel breaks, along with the horizontal support at 2870 – which is also considered a higher low – then selling momentum is likely to increase. The targets for sellers should be in the 2710-2750 region.
Trad3WithFaraz
Buy Gold

Bullish Divergence is considered a positive signal for buyers. If there is a breakthrough above the resistance level at 1998, buyers are expected to take control. The target for buyers is the 2009-2013 resistance zone, with a recommended stop loss at 1982.About to Hit our first Target 2009 Close Half and move SL to BE 1998
Trad3WithFaraz
Buy BAKEUSDT

After breaking a major support zone and experiencing a false breakout of support, buyers launched another attack, and buying momentum picked up after breaking the descending parallel channel. This resulted in higher highs and higher lows, indicating a bullish trend. Targets at 0.4350 and 0.5071 now seems achievable, as long as the 0.2710 level doesn't break.TP1 Hit
Disclaimer
Any content and materials included in Sahmeto's website and official communication channels are a compilation of personal opinions and analyses and are not binding. They do not constitute any recommendation for buying, selling, entering or exiting the stock market and cryptocurrency market. Also, all news and analyses included in the website and channels are merely republished information from official and unofficial domestic and foreign sources, and it is obvious that users of the said content are responsible for following up and ensuring the authenticity and accuracy of the materials. Therefore, while disclaiming responsibility, it is declared that the responsibility for any decision-making, action, and potential profit and loss in the capital market and cryptocurrency market lies with the trader.