
TizyCharts
@t_TizyCharts

What symbols does the trader recommend buying?
Purchase History
پیام های تریدر
Filter
Signal Type
TizyCharts

The daily chart sees a good stop on the ema 50d with decreasing volume. $237 is going to be a strong resistance but if passed, will lead the stock higher.
TizyCharts

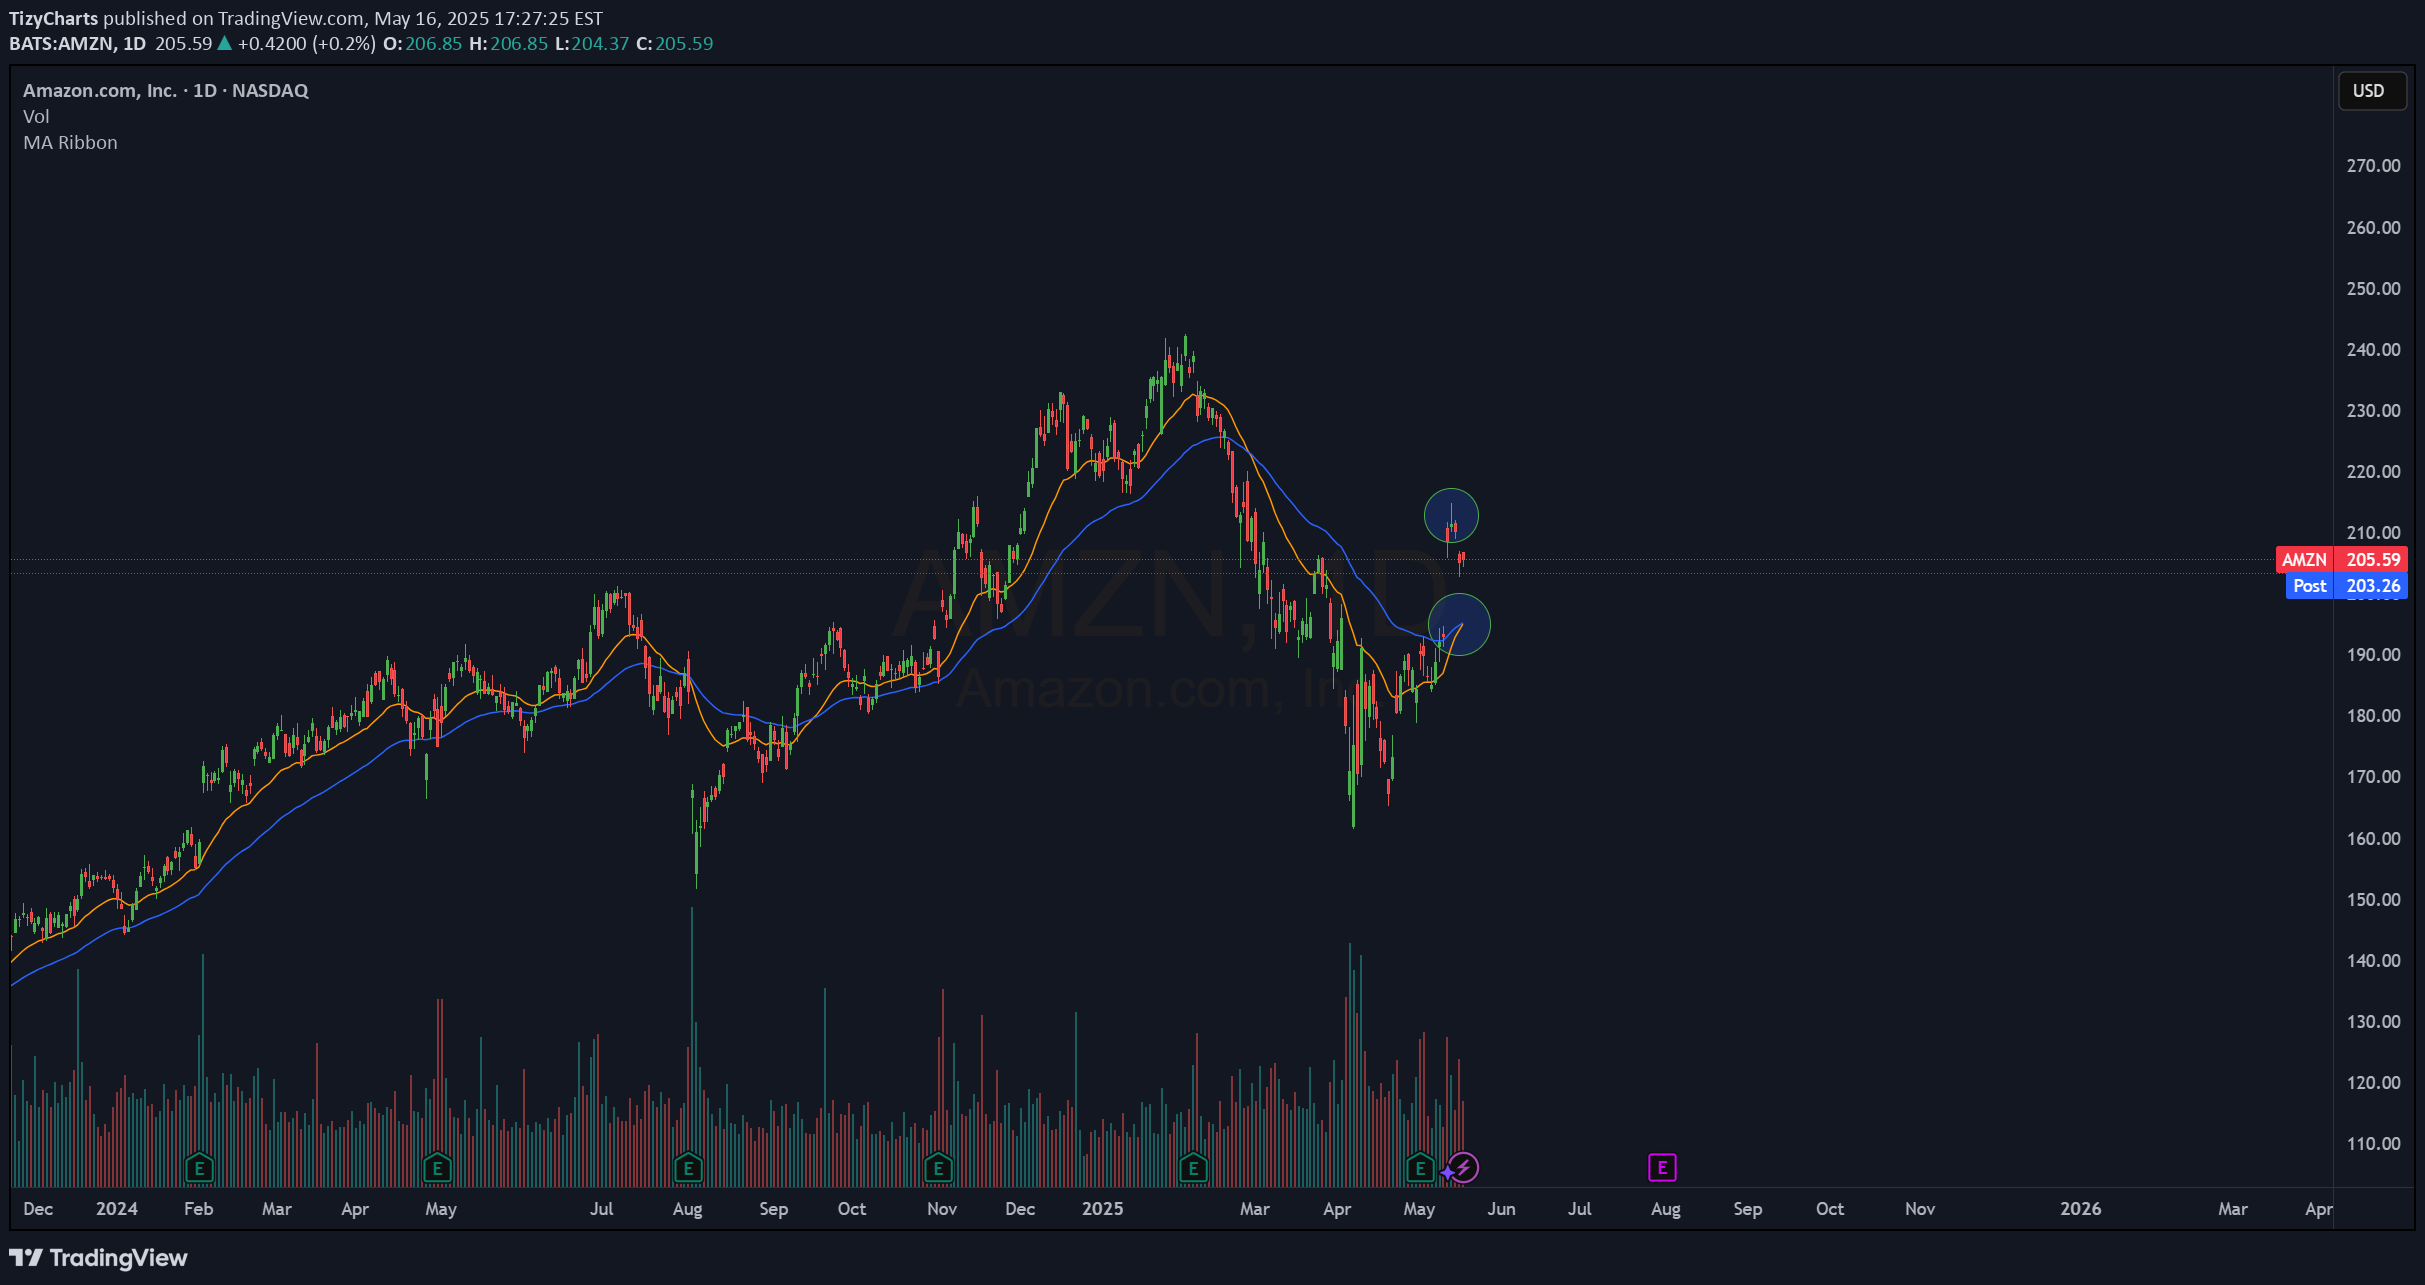
The daily chart sees a bullish ATR Break together with a bullish crossover and a pullback on the ema50. There is even a strong rejection to that level. We are still waiting for the confirmation but it looks great !
TizyCharts

AAPL on the Weekly is still bearish. The price is trading below our EMAs that are even in a bearish order. We need a stable move above $217 right now. Not sure will come soon
TizyCharts

TizyCharts

Bullish Crossover on the hourly chart at the bottom of the channel. The action of the last hours is weak as can be seen by the lack f volume.
TizyCharts

- Great Crossover on the Daily chart with the ema9 and 21 that are moving above the ema50 - Consolidation area on the Hourly.
TizyCharts

- The daily chart sees the price testing the ema 50d as support while all the other EMAs are in a bullish scenario. Great Bullish pattern. Looking for an action that creates a new positive price action
TizyCharts
- Bullish Box on the daily chart supported by the ema50d and strong ema 21d and 9d. No volume on this box. - Almost the same pattern on the hourly
TizyCharts

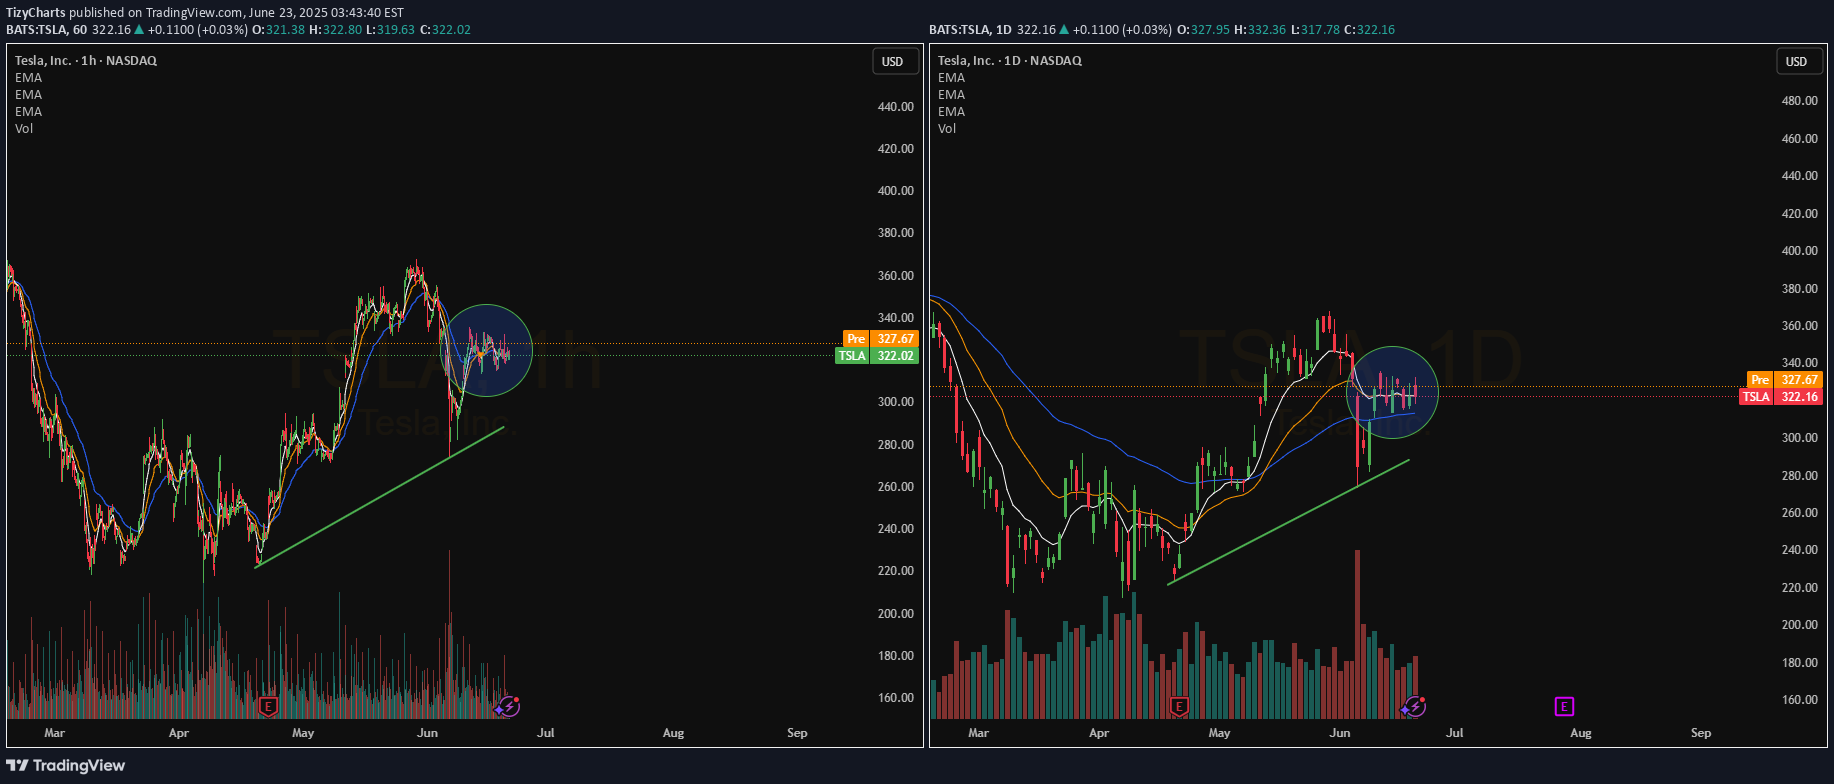
Daily -> Bullish crossover with pullback (and volume) Hourly-> Consolidated bullish trend Watching for a #TopSwing Setup on the Daily Chart
TizyCharts
EMA21 at the crossover of the EMA50 and price is pulling back. Watching for a #TopSwing Setup Area of $215 as key resistance. Support → $193 and $176
Disclaimer
Any content and materials included in Sahmeto's website and official communication channels are a compilation of personal opinions and analyses and are not binding. They do not constitute any recommendation for buying, selling, entering or exiting the stock market and cryptocurrency market. Also, all news and analyses included in the website and channels are merely republished information from official and unofficial domestic and foreign sources, and it is obvious that users of the said content are responsible for following up and ensuring the authenticity and accuracy of the materials. Therefore, while disclaiming responsibility, it is declared that the responsibility for any decision-making, action, and potential profit and loss in the capital market and cryptocurrency market lies with the trader.