
The_FxTricks
@t_The_FxTricks

What symbols does the trader recommend buying?
Purchase History
پیام های تریدر
Filter
XAUUSD- War Situation Midterm
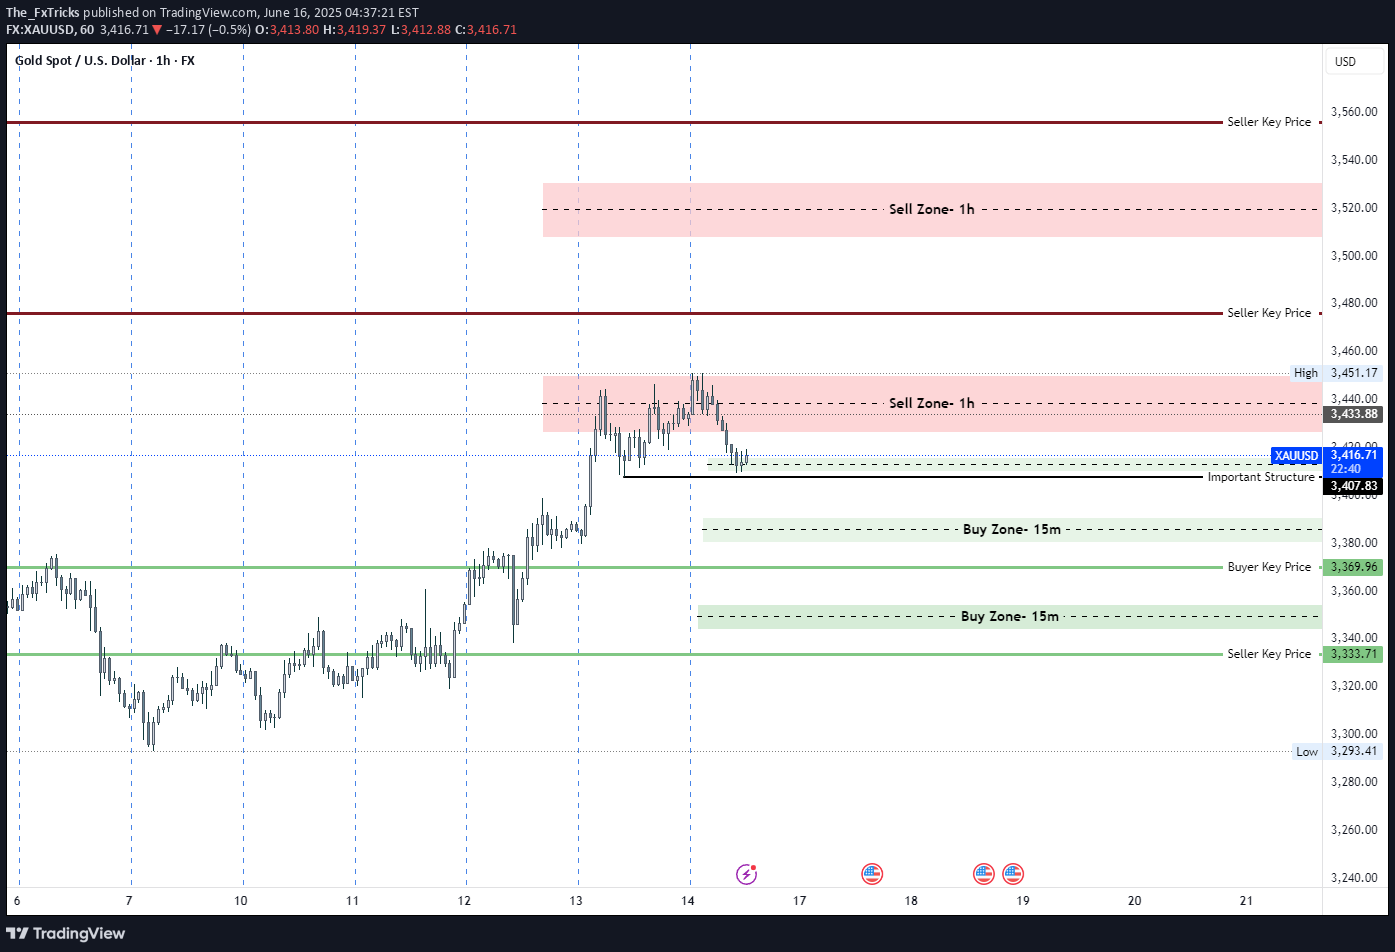
The Zones I marked for Buy can be good areas to have short-term and Upper Sell zone on 3507 can be a good area to make a midterm longer move Sell.
XAUUSD- 1H Update

Chart Description – XAUUSD 1H (Gold Spot vs. USD)This is a multi-scenario Smart Money Concept (SMC)-based projection chart for Gold (XAUUSD), focusing on potential bullish retracements and major bearish continuations, incorporating Buy Zones, Sell Zones, and Change of Character (CHOCH) areas.🔍 Key Components:🟣 Sell ZonesTwo sell zones are identified, with the highest near the All-Time High (ATH) around the $3,500 mark.These are areas of expected bearish reaction if price retraces upward after a low.🟢 Buy ZonesLocated between $3,200 – $3,160 and another deeper one near $2,960, where potential bullish reactions may occur.🔵 CHOCH - 4HMarked in red around $3,260 area, indicating a 4-hour Change of Character, suggesting a potential shift from bullish to bearish sentiment.🔸 Key Price Levels$3,120: Historical support/resistance.$2,956.20: Major swing low and key demand zone.📊 Projected Market Path (Colored Waves)🔹 Blue Path (Bullish Retracement Scenario)Price is expected to retrace into a sell zone around $3,400–$3,460 after testing the current demand.From there, a major sell-off is anticipated.🔷 Cyan Path (Bearish Continuation)Following the retracement, the market is projected to break below the recent low and head toward lower buy zones, potentially near the $3,120 and $2,960 regions.Shows lower-high and lower-low formation, consistent with a bearish trend.🧠 Market SentimentThis chart suggests a bearish outlook for Gold unless a structural shift invalidates the CHOCH zone and supply levels. The chart highlights the importance of:Waiting for confirmation in the supply zones before shorting.Considering buy opportunities only in valid buy zones with bullish reaction confirmation.
XAUUSD- Mid Term

Chart Description – XAUUSD 1H (Gold Spot vs. USD)This is a multi-scenario Smart Money Concept (SMC)-based projection chart for Gold (XAUUSD), focusing on potential bullish retracements and major bearish continuations, incorporating Buy Zones, Sell Zones, and Change of Character (CHOCH) areas.🔍 Key Components:🟣 Sell ZonesTwo sell zones are identified, with the highest near the All-Time High (ATH) around the $3,500 mark.These are areas of expected bearish reaction if price retraces upward after a low.🟢 Buy ZonesLocated between $3,200 – $3,160 and another deeper one near $2,960, where potential bullish reactions may occur.🔵 CHOCH - 4HMarked in red around $3,260 area, indicating a 4-hour Change of Character, suggesting a potential shift from bullish to bearish sentiment.🔸 Key Price Levels$3,120: Historical support/resistance.$2,956.20: Major swing low and key demand zone.📊 Projected Market Path (Colored Waves)🔹 Blue Path (Bullish Retracement Scenario)Price is expected to retrace into a sell zone around $3,400–$3,460 after testing the current demand.From there, a major sell-off is anticipated.🔷 Cyan Path (Bearish Continuation)Following the retracement, the market is projected to break below the recent low and head toward lower buy zones, potentially near the $3,120 and $2,960 regions.Shows lower-high and lower-low formation, consistent with a bearish trend.🧠 Market SentimentThis chart suggests a bearish outlook for Gold unless a structural shift invalidates the CHOCH zone and supply levels. The chart highlights the importance of:Waiting for confirmation in the supply zones before shorting.Considering buy opportunities only in valid buy zones with bullish reaction confirmation.
Gold- Closure of a Range Week

Market Scenarios:We have NFP tomorrow, Be careful so much... FX: XAUUSD Blue Scenario:If the market closes higher than 2,625 but under 2,632, we can expect a small bullish move towards the middle of the London session.After reaching that point, there could be a bearish Friday, with potential to fall at least towards the 2,600 - 2,605 level.Black Scenario:If the market closes below the 2,625 support, we will likely move towards the 2,500 channel.There could be a temporary pause around the 2,580 - 2,575 zone.Orange Scenario:If today’s candle closes above 2,632, we can expect a small bearish move toward the 2,612 - 2,617 zone.After that, there might be a TGIF (a potential weekend reversal or pause).Conclusion:Based on current observations, I see high chances for the Blue move, where the market closes higher than 2,625 and stays below 2,632, leading to a small bullish move followed by a bearish Friday.** This description aligns with the chart provided and the scenarios described for potential market movements.
Gold- 1h Zones

This chart represents the price movement of Gold Spot (XAU/USD) on a 1-hour timeframe, showing key levels of interest, areas of potential sell zones, and market structure concepts. Here's the breakdown of the important components:Key Elements on the Chart:Highlighted Resistance Levels (Red Zones):Possible Sell - Risky (2704.35): Marked as a potential resistance zone where selling pressure might emerge.Possible Sell - Risky (2676.62): Another sell zone that could act as a resistance point.These levels indicate areas where price may reverse due to historical price action or imbalance.Support Zones (Purple Zones):IMB 1h (2576.18): This area represents a 1-hour imbalance or Fair Value Gap (FVG), which is a potential support zone where buyers may step in.Low Zone (2536.09): A significant historical support level where the price might bounce if tested.Internal Change of Character (iCHoCH - 4h):This label signifies a shift in market structure on the 4-hour timeframe. The price broke through a key level, suggesting a reversal or the start of a new trend.Positioned in the middle of the chart, this change initiated the recent bullish trend.Current Price Action (2650):The price is currently consolidating around the 2650 level, possibly preparing for its next move.Directional Bias:If the price moves higher and breaks through 2676.62 or 2704.35, it could continue upward toward new highs.If resistance holds and the price reverses, a bearish move toward 2576.18 or lower could occur.Manipulation Zones:As highlighted in the analysis, the early-week movements (Monday and Tuesday) will be critical in identifying whether the market manipulates the sell zones or seeks liquidity below.Summary:The chart shows a clear range with potential resistance at 2676–2704 and support at 2576–2536. The current price near 2650 is at a decision point, where breaking resistance could lead to bullish continuation, while holding resistance might trigger a bearish move. Market manipulation early in the week will provide further confirmation of direction.
Gold- Possible to Close November Bullish

As far as Gold raised from the Daily Sell target Zone and 4h FVG, it's possible to finish the HTF rest and go for a new high. But it all depends on how the Monthly Candle closes.Until the closure of Month and Week is confirmed, Sell Zones are between 2758-2762 and Buy Zone is between 2680-2684.Meanwhile, we can have 2 risky zones also, depending on Asia movements, such as:Buy --> 2698-2700Sell --> 2722-2724Good Luck.
Disclaimer
Any content and materials included in Sahmeto's website and official communication channels are a compilation of personal opinions and analyses and are not binding. They do not constitute any recommendation for buying, selling, entering or exiting the stock market and cryptocurrency market. Also, all news and analyses included in the website and channels are merely republished information from official and unofficial domestic and foreign sources, and it is obvious that users of the said content are responsible for following up and ensuring the authenticity and accuracy of the materials. Therefore, while disclaiming responsibility, it is declared that the responsibility for any decision-making, action, and potential profit and loss in the capital market and cryptocurrency market lies with the trader.