
TheTradingStar
@t_TheTradingStar

What symbols does the trader recommend buying?
Purchase History
پیام های تریدر
Filter
TheTradingStar
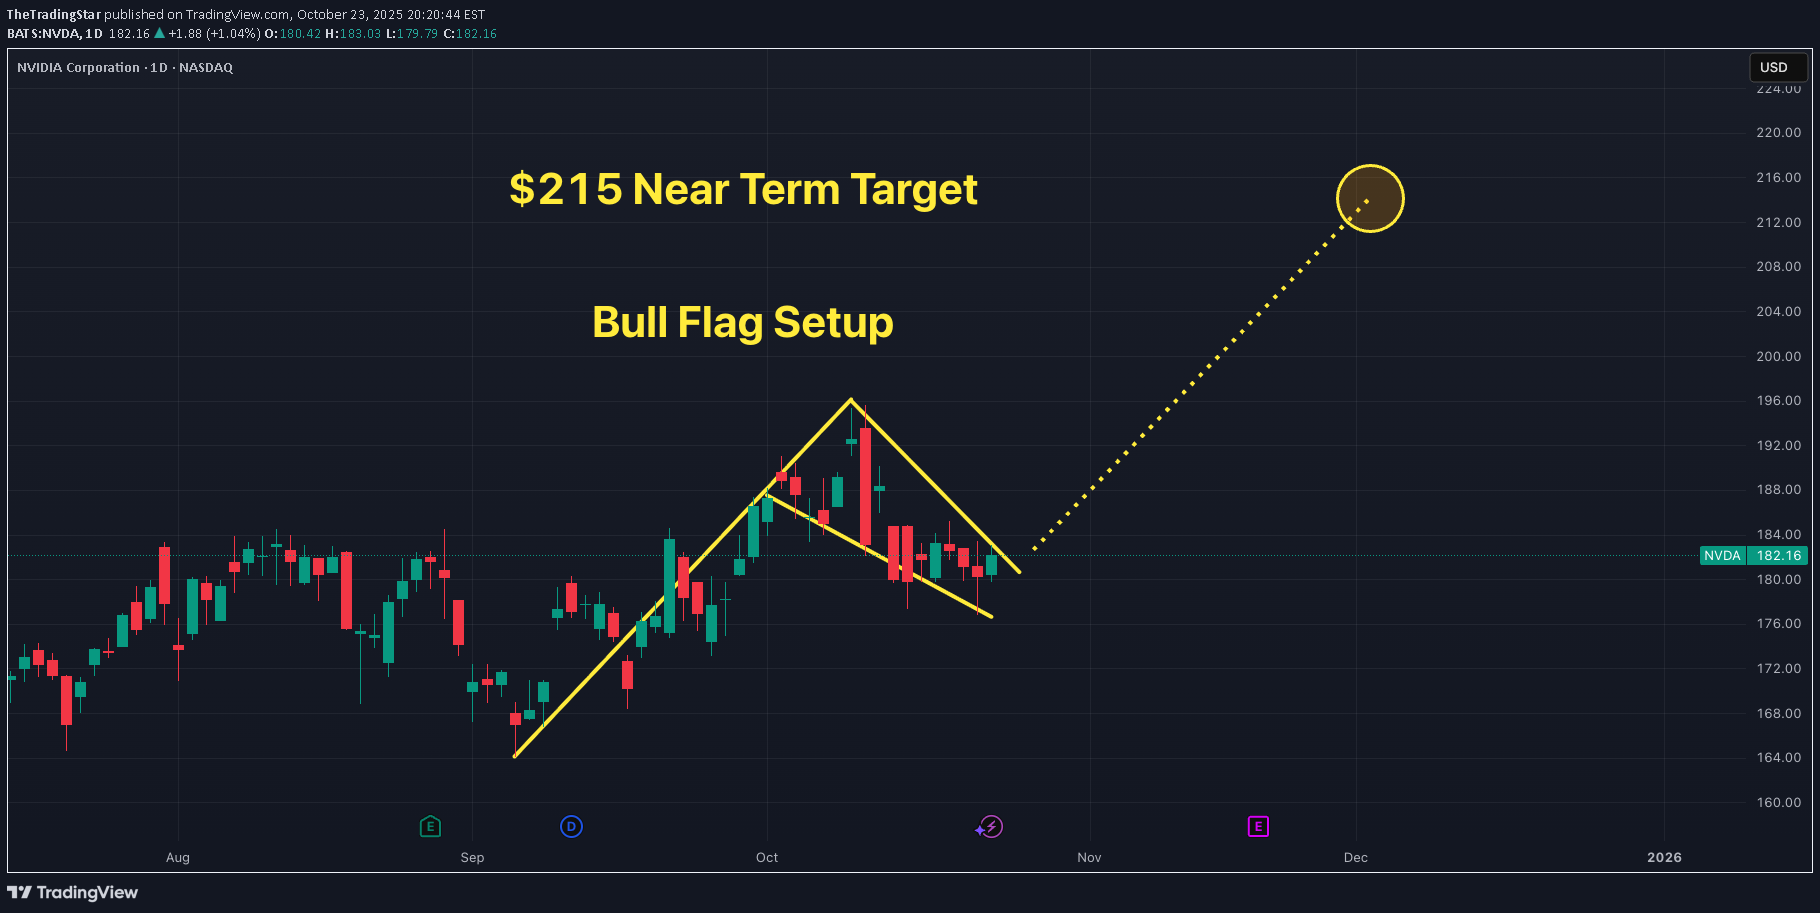
هدف کوتاهمدت انویدیا: آیا قیمت به ۲۱۵ دلار میرسد؟ (تحلیل الگوی پرچم گاوی)
TheTradingStar
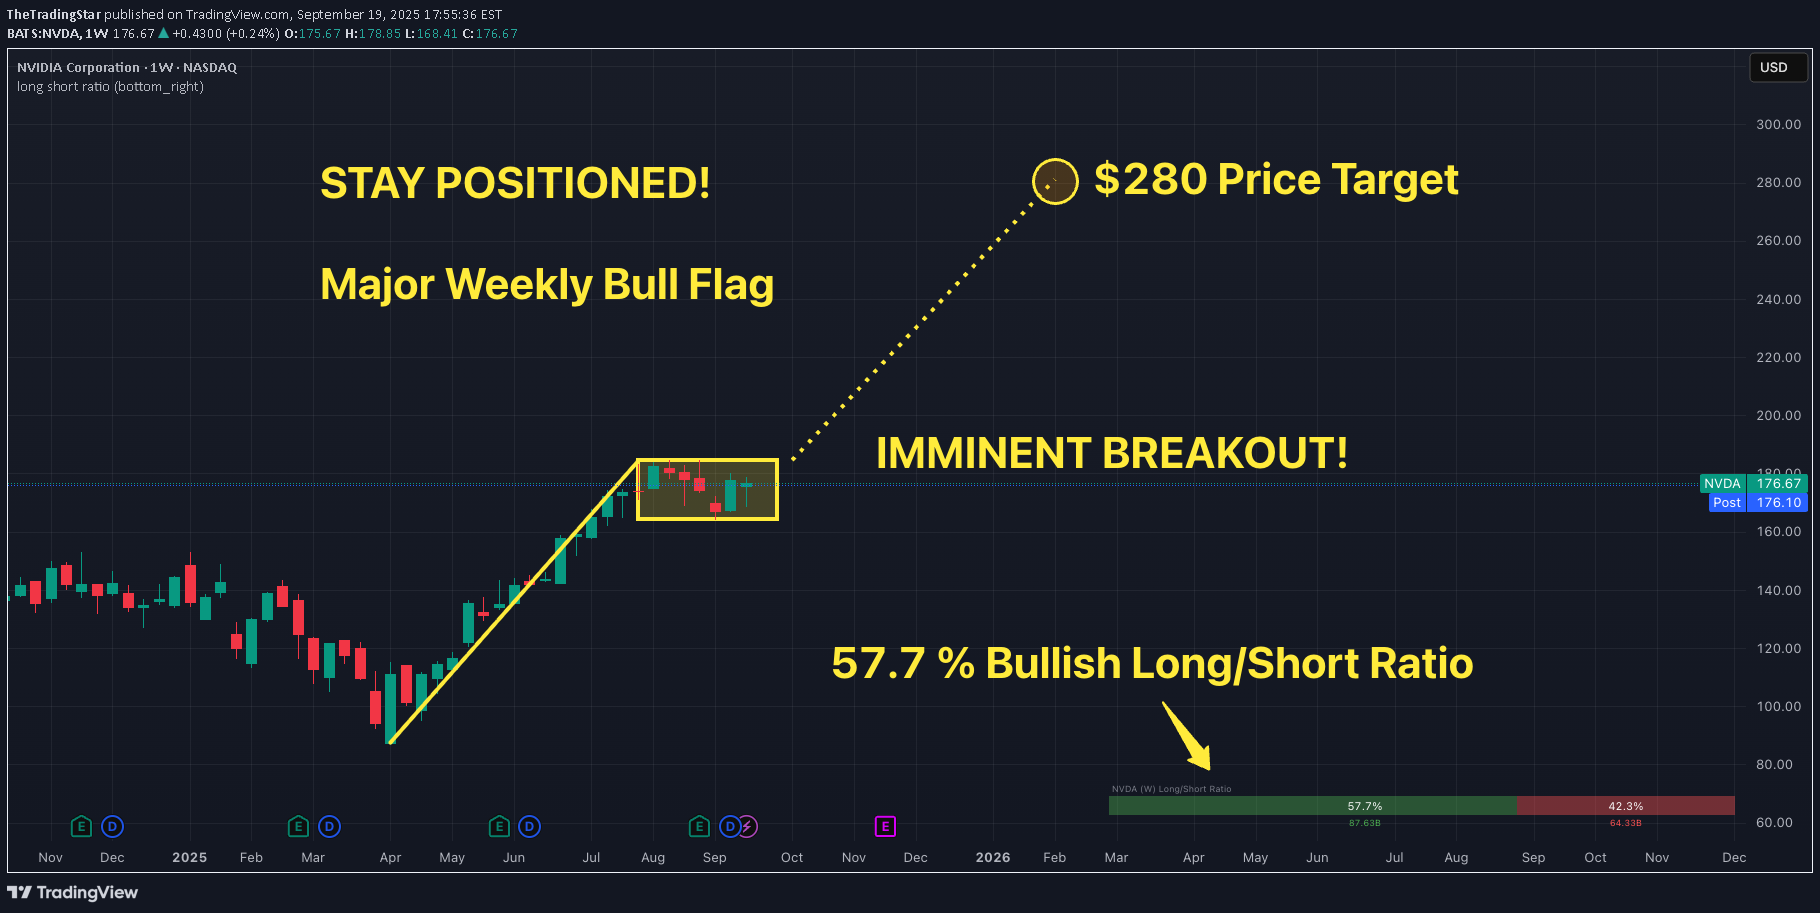
Stay Positioned with Nvidia's Weekly Bullish Chart. A Bull Flag is setting up with an imminent breakout. Long/Short Ratio is also very bullish at almost 60%. Price Target is $280. Remember Pole length of the flag = extended measured move at the breakout point of the flag.
TheTradingStar
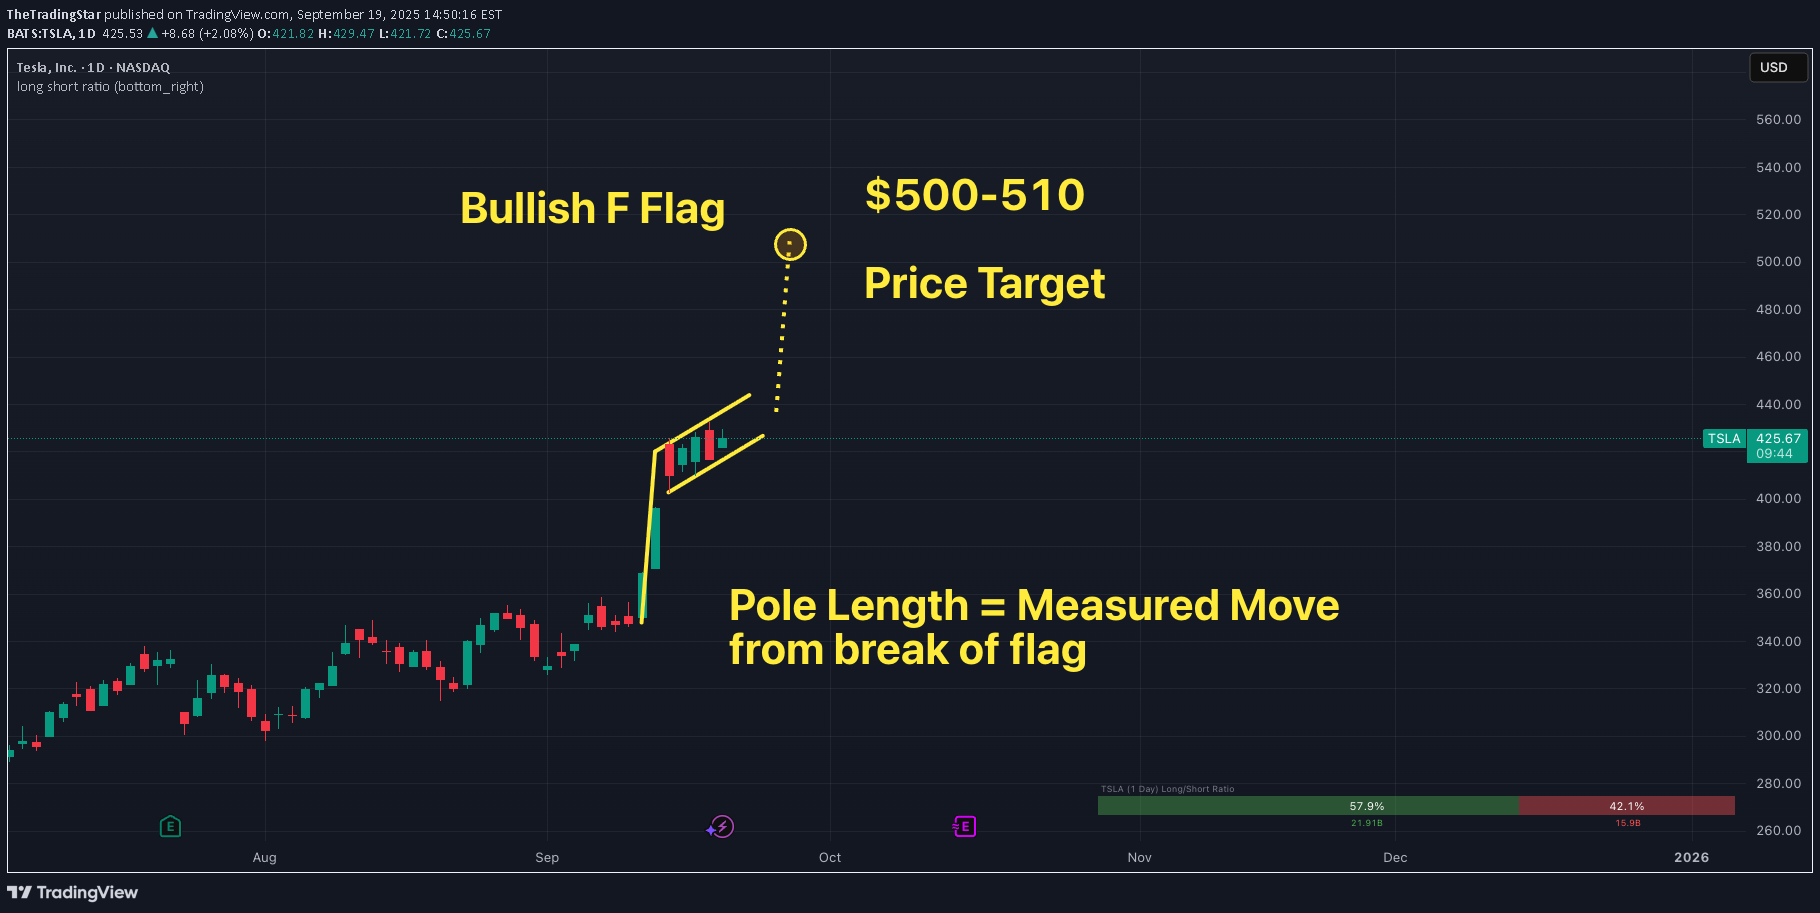
A Bullish Flag is setting up nicely on TSLA. If price breaks out of the flag, a measured move equaling the pole length would put its price objective roughly between $500-510.
TheTradingStar
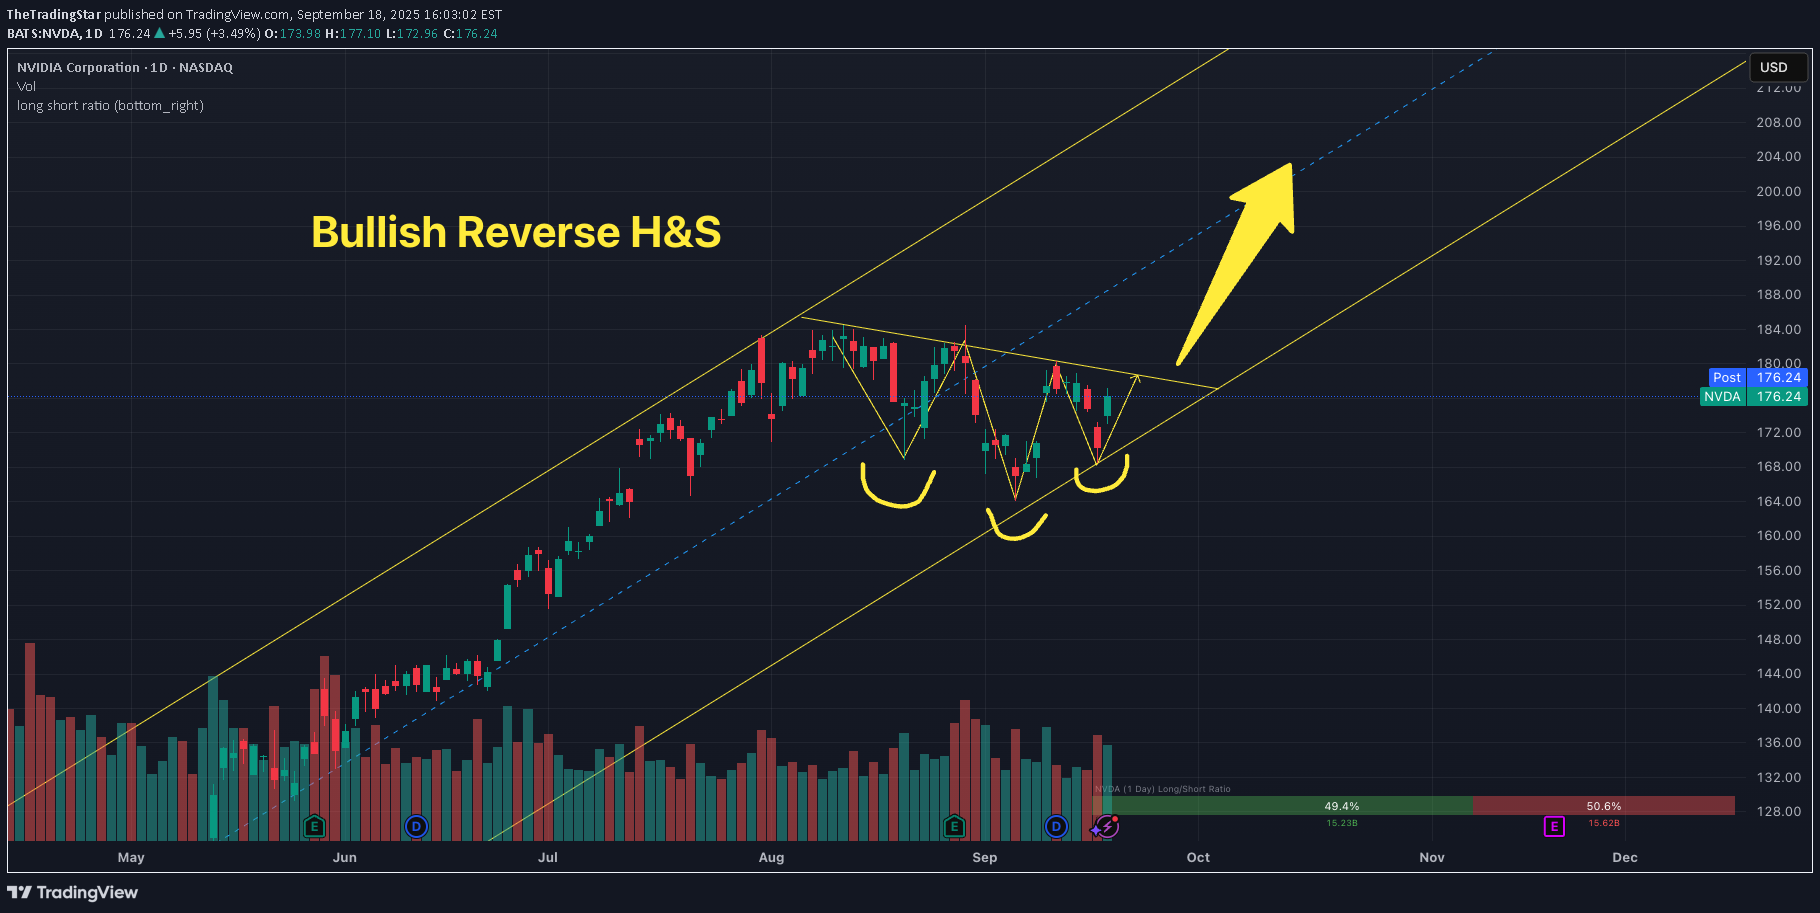
There is a reverse head & shoulder pattern setting up which is a bullish pattern. Break above the neckline should send the price to near $200.
TheTradingStar
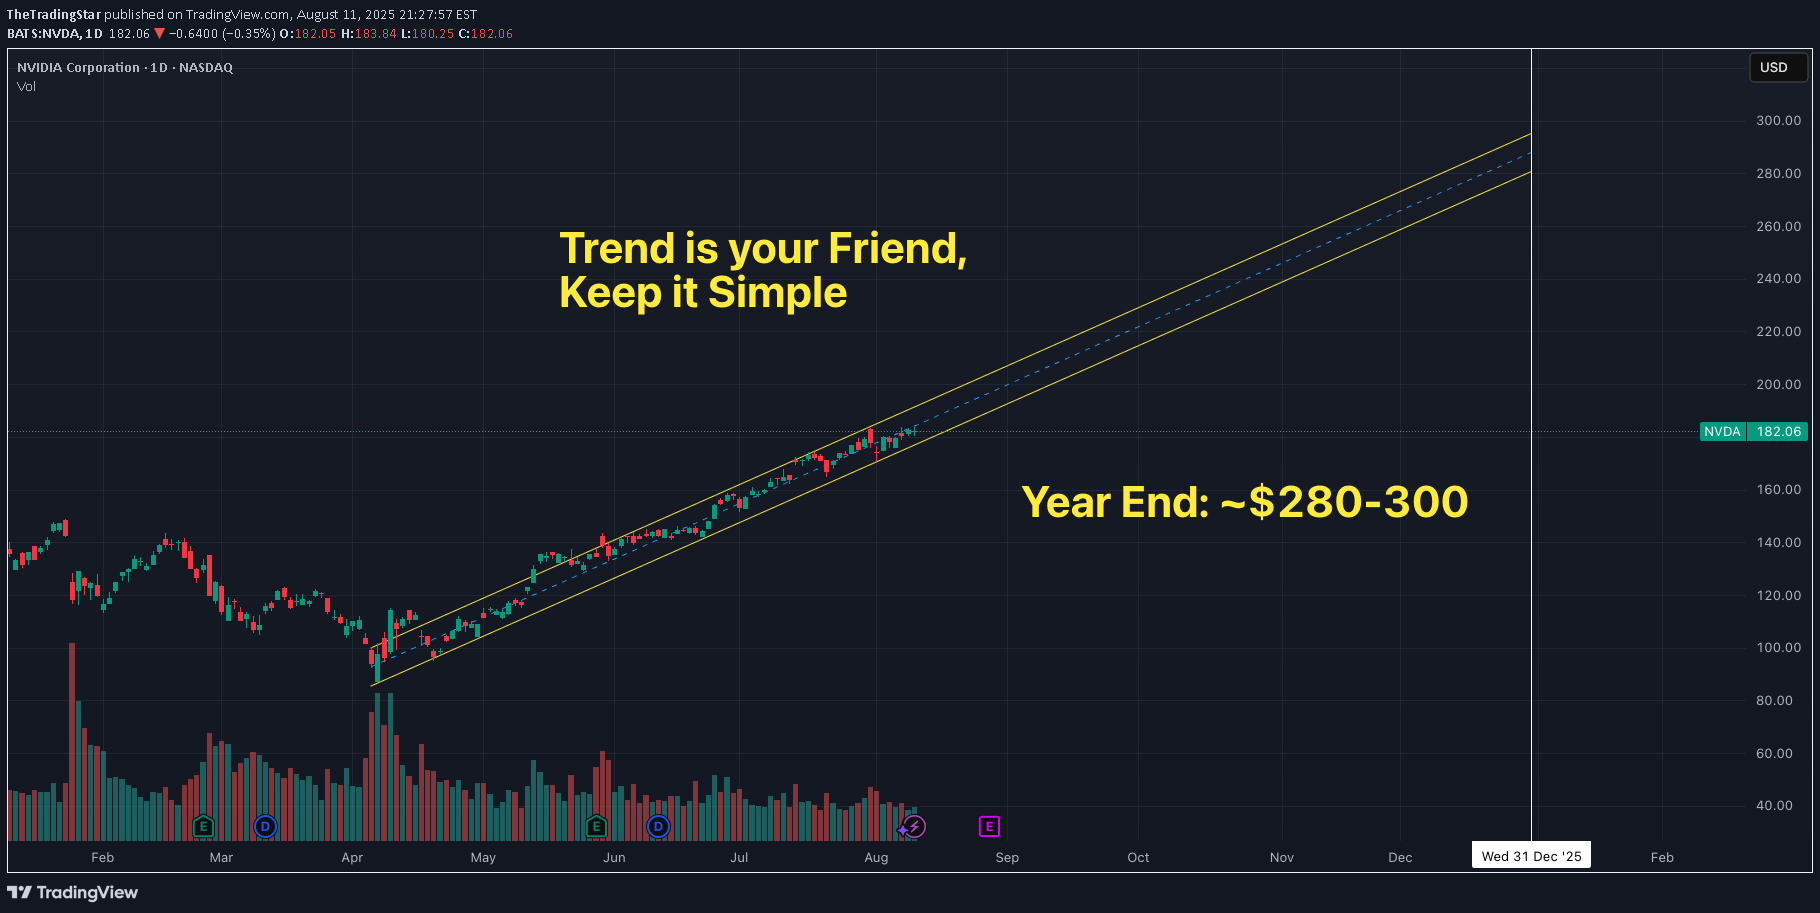
Trend is your friend, just keep it simple. Lots of runway ahead accompanied with improved gross margins of mid 70% during back half of the year on already high margins. Technical trend channel has a price objective between $280 to almost $300.
TheTradingStar
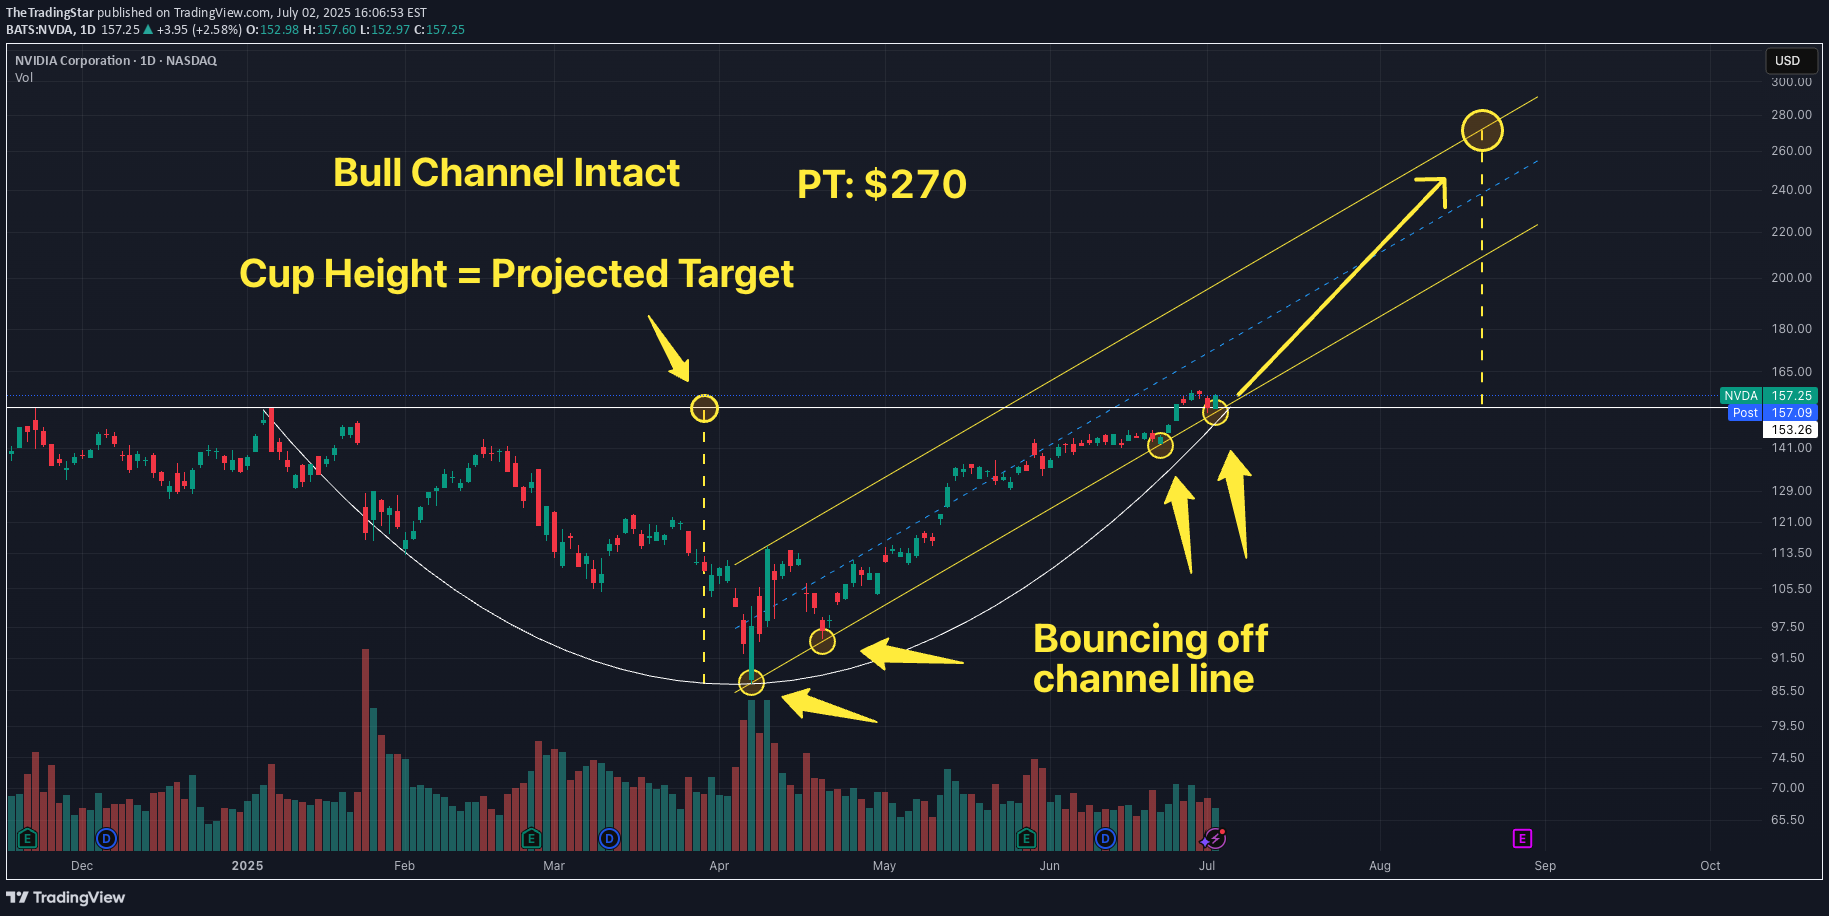
The stock is currently bouncing off of the lower channel line of the rising Bull Channel. Price action has created a Cup and Handle. The projected Price Objective sits at around $270. Remember, the height of the cup is the project target which from current stock price extends to around $270.Bull Channel is holding solidholding strong, in the coming week or 2, chart looks to trend towards $186
TheTradingStar
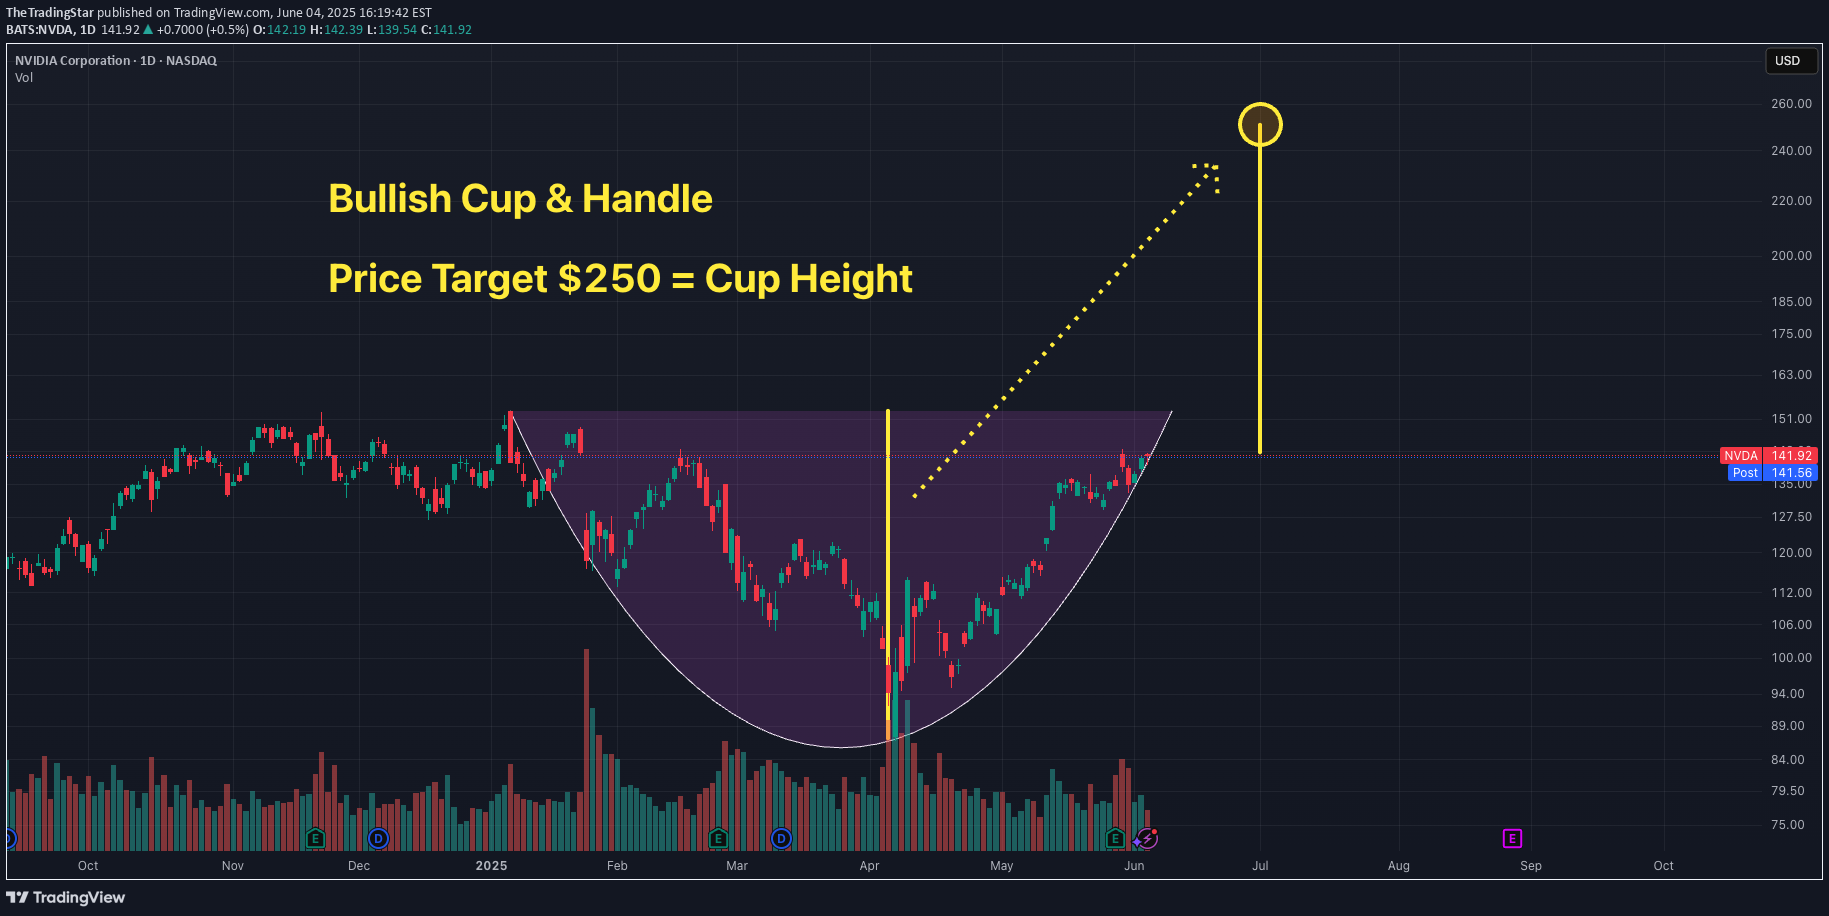
There is a Bullish Cup and Handle Setting Up. Height of the Cup is the Price Objective which would take the stock from current levels to roughly $250.
TheTradingStar
TheTradingStar
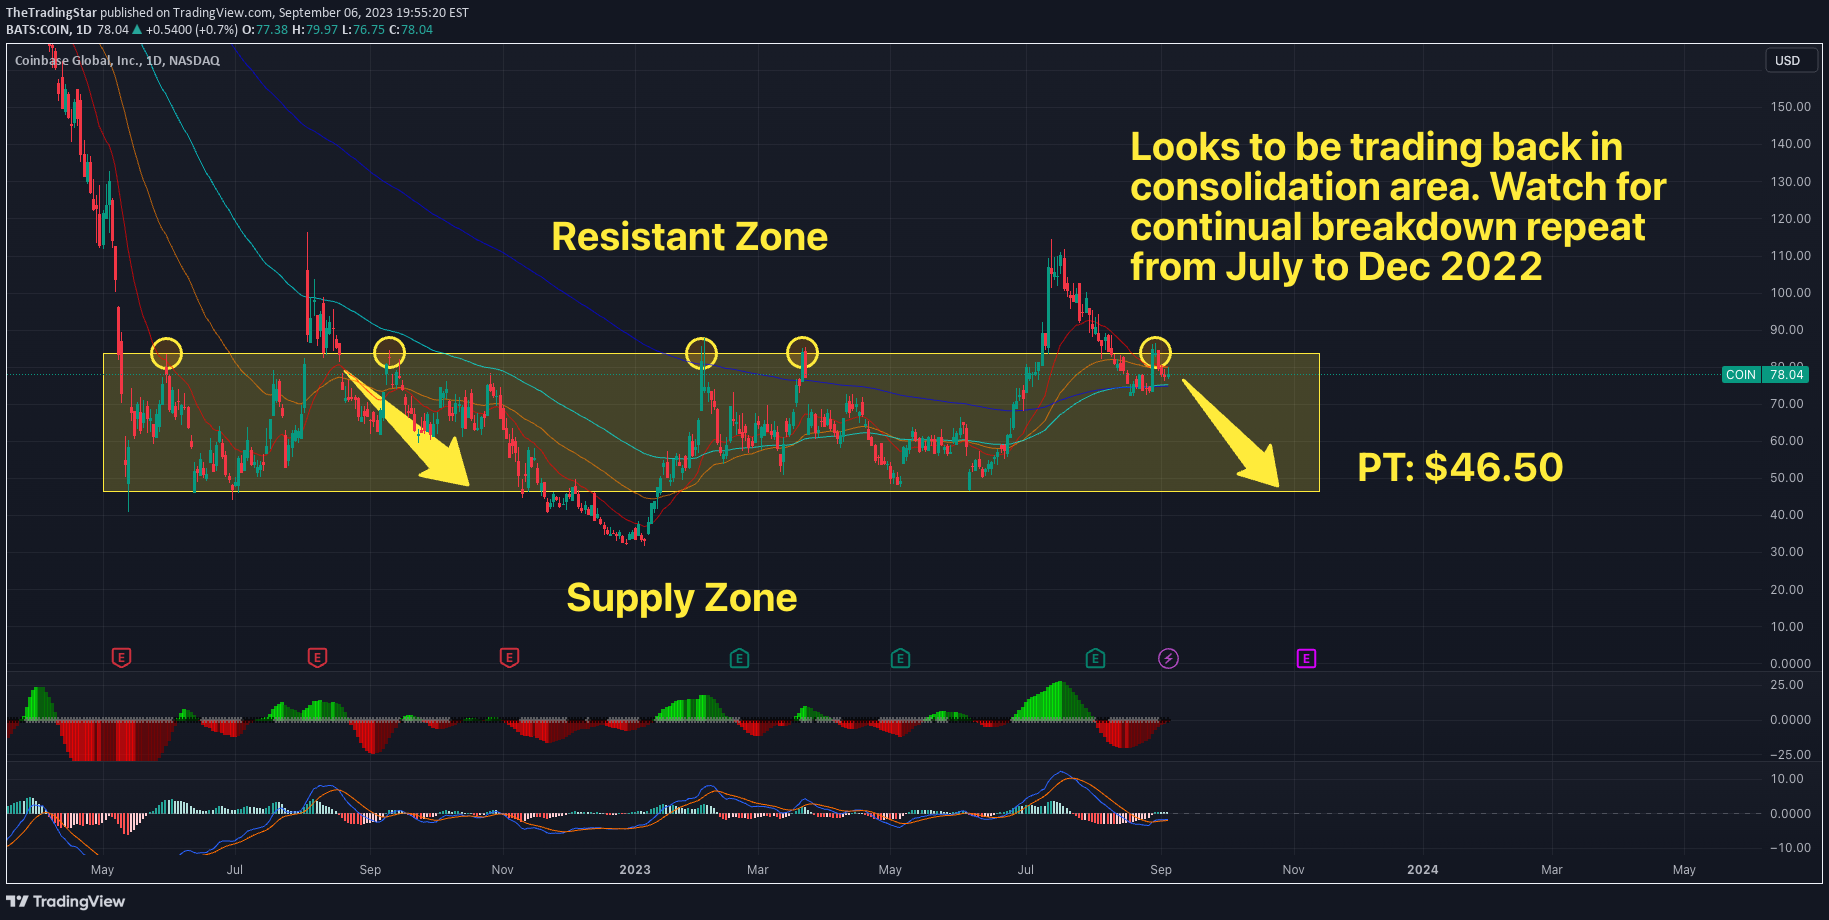
It is very clear that the stock price is trading back into its consolidation zone. Watch for continue trend heading lower to a price target of $46.50 where there is lots of supply.
Disclaimer
Any content and materials included in Sahmeto's website and official communication channels are a compilation of personal opinions and analyses and are not binding. They do not constitute any recommendation for buying, selling, entering or exiting the stock market and cryptocurrency market. Also, all news and analyses included in the website and channels are merely republished information from official and unofficial domestic and foreign sources, and it is obvious that users of the said content are responsible for following up and ensuring the authenticity and accuracy of the materials. Therefore, while disclaiming responsibility, it is declared that the responsibility for any decision-making, action, and potential profit and loss in the capital market and cryptocurrency market lies with the trader.