
TVS-Trader
@t_TVS-Trader
What symbols does the trader recommend buying?
Purchase History
پیام های تریدر
Filter

TVS-Trader
تحلیل طلا: خیز صعودی قدرتمند و اهداف جدید قیمت در 19 نوامبر
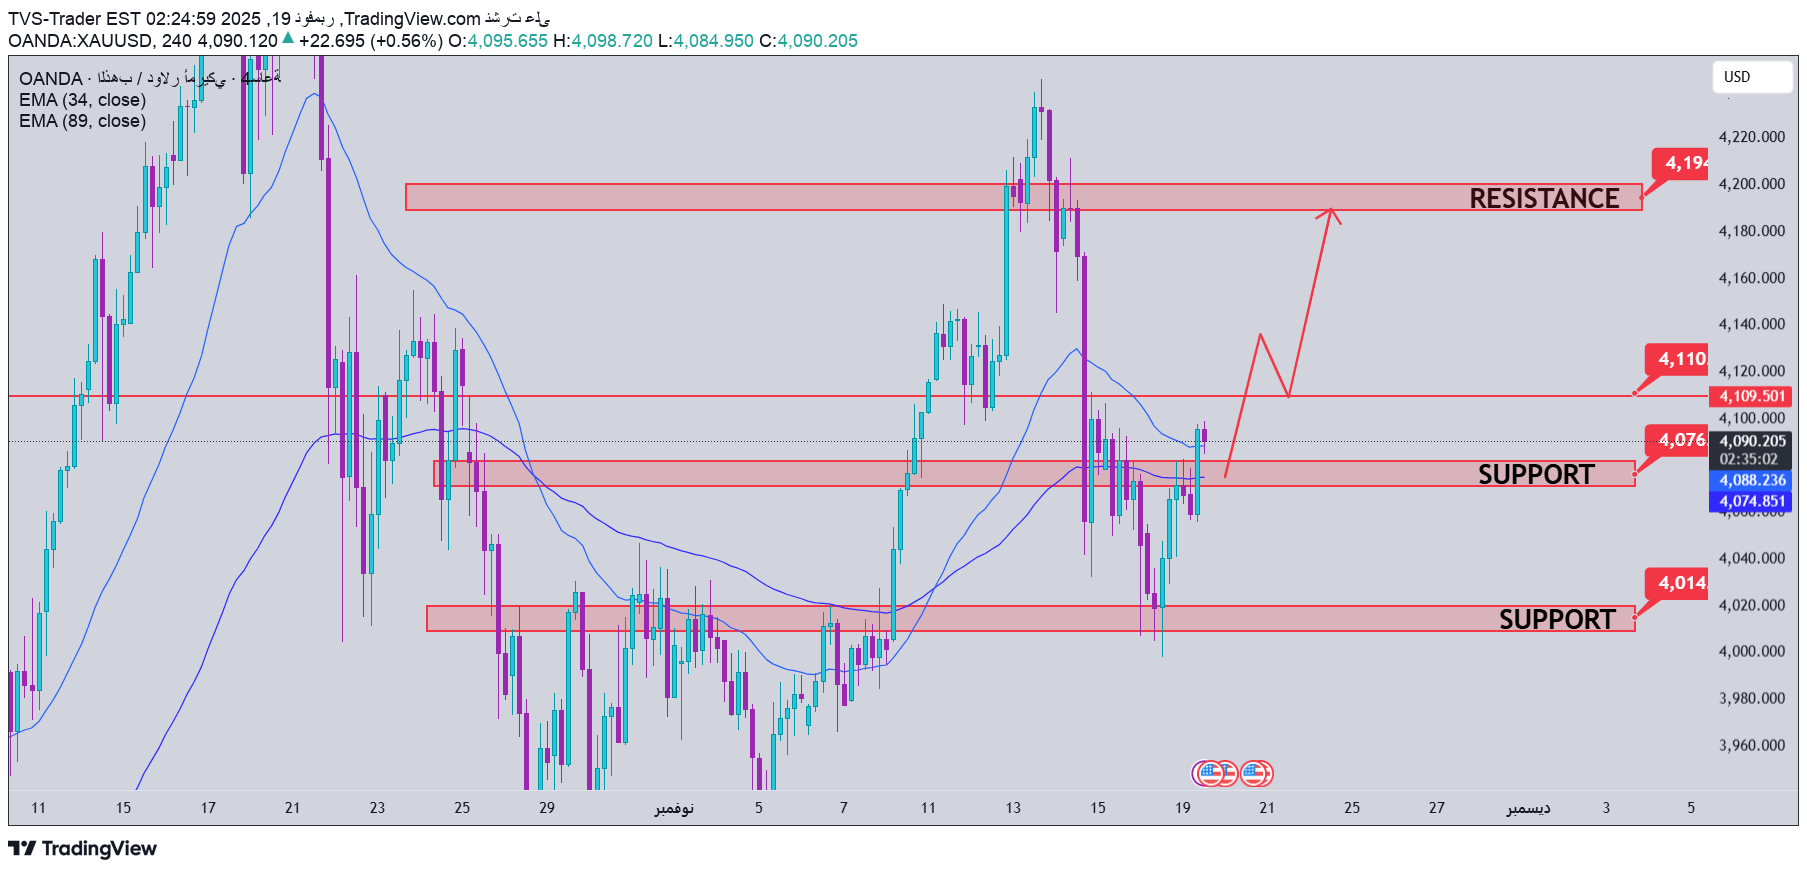
Gold is showing a very positive reaction around the major trend line, where buying pressure is very strong. The breakout of the key resistance area of 4080 opened up new upward momentum, pushing the market directly towards the psychological level of 4100. The bullish structure is clearly consolidating, and the current momentum is targeting the resistance area of 4145 – the upper band of today's trading session. Previous buy setups have proven effective, especially the position from 4075 which generated impressive profits. The overall trend remains in favor of buyers, while important support areas remain well protected. 💡 Reference strategy: Current buying is around 4090 Buy on price rejection signal at support level 4080 Buy on DCA breakout at 4103 Target: 4175 - until it extends to 4200 Risk: The trend is invalidated if the price breaks the trend line and closes the candle below the 4050 level

TVS-Trader
پیشبینی حرکت طلا (XAUUSD) در ۱۸ نوامبر: آیا سقوط به زیر ۳۹۳۳ قطعی است؟
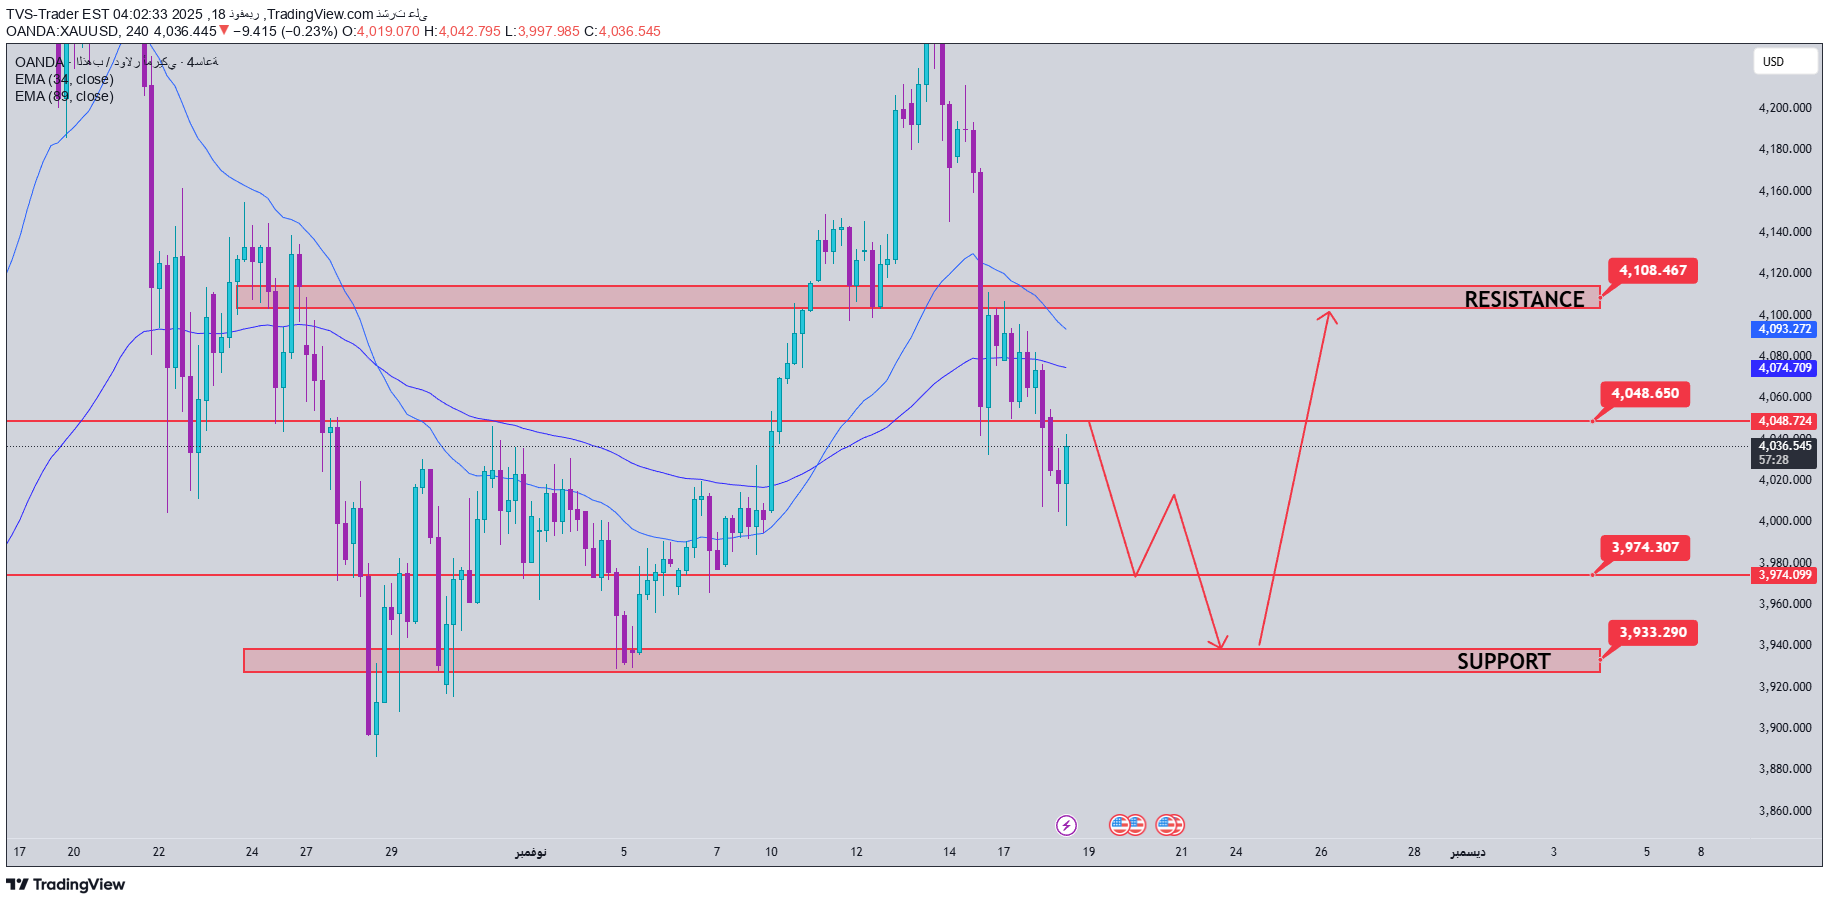
XAUUSD is still under downward pressure, as sellers have a clear advantage, pushing the price towards the 3933 support area. Buyers' efforts to keep the price at the trend line are very weak, indicating that this support is at risk of being breached, and the market decline may extend to lower levels. At this stage, monitoring the price reaction at important support levels on the chart is the key to finding a safe entry point. Preferred trading scenario: Buy when the market rejects the sharp decline and there is a clear reversal signal at the 3973 - 3933 area. Target: An immediate target towards 4104, with an additional extension to 4203. Risk Warning: The uptrend will be invalidated if the 4-hour candle (H4) closes below 3933.

TVS-Trader
تحلیل طلای امروز: آیا کف قیمت میشکند؟ فرصت خرید پنهان در محدوده 3933!
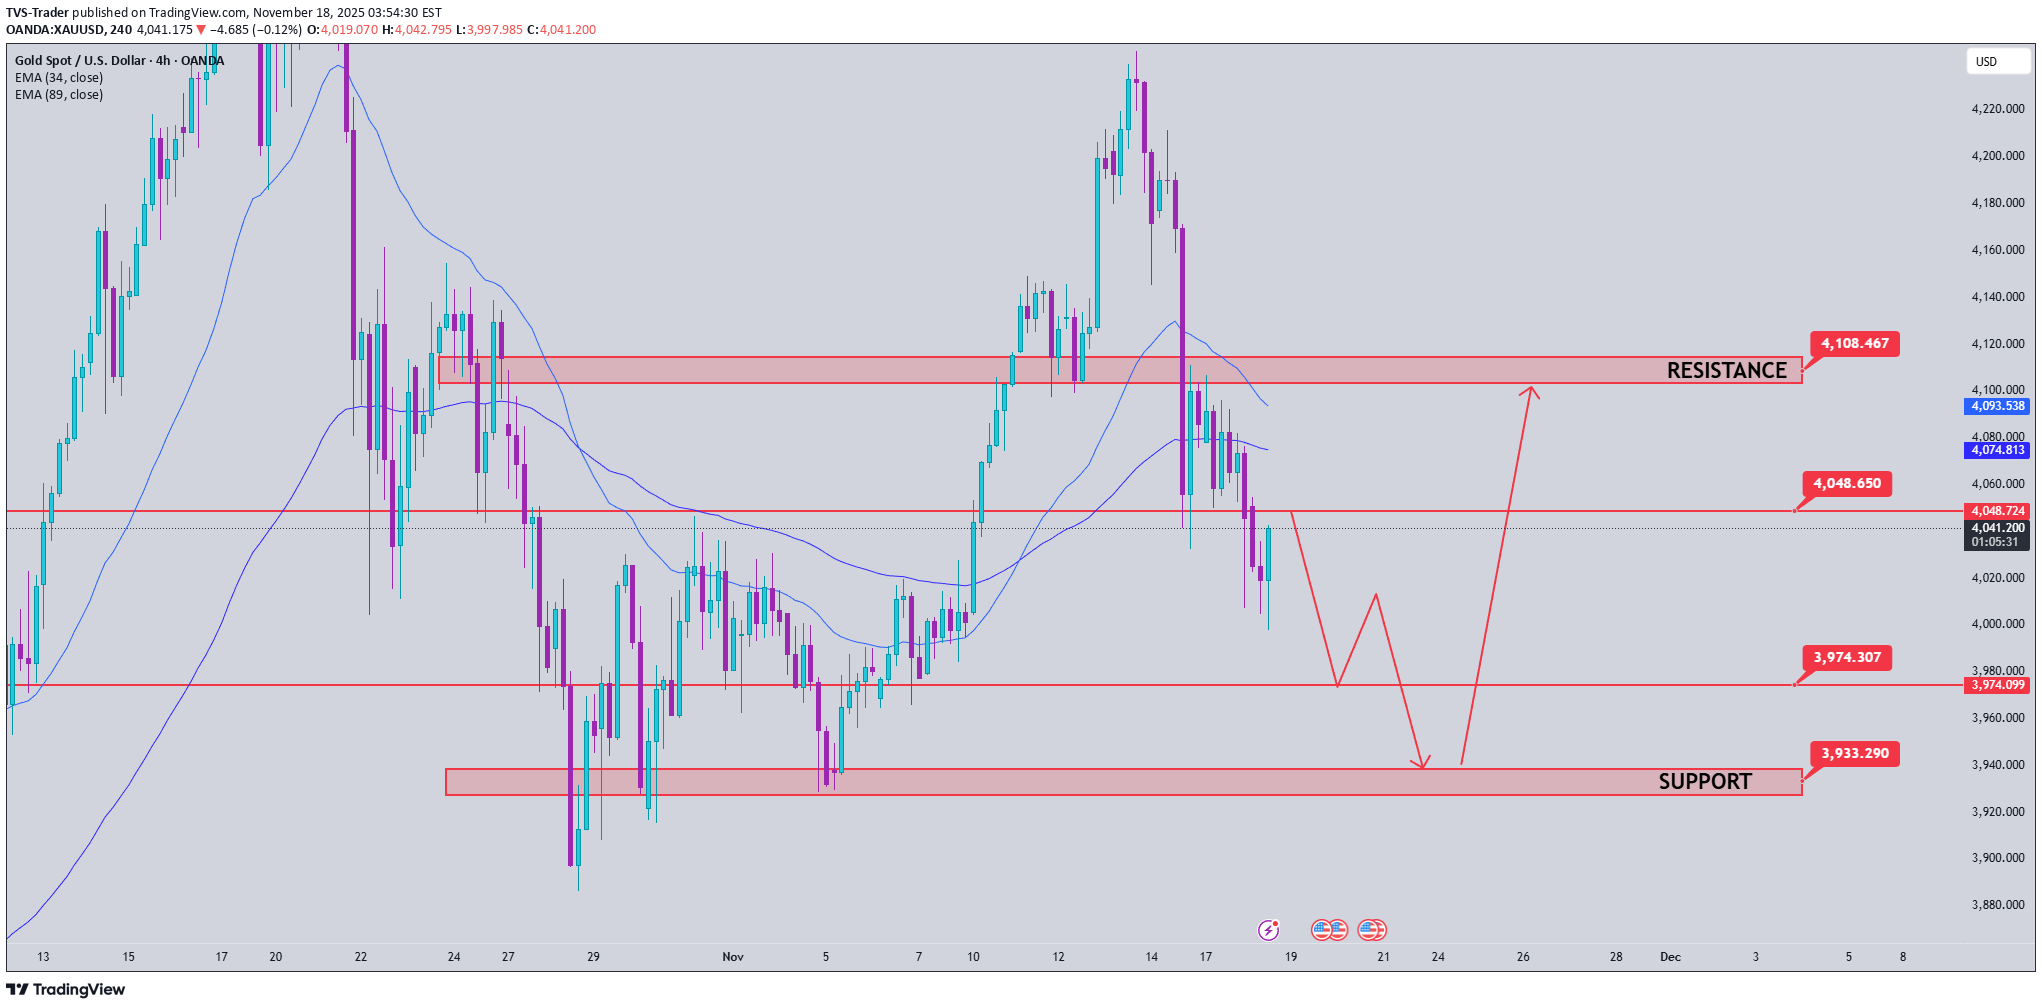
XAUUSD continues to be under downward pressure as the sellers have a clear advantage, pulling the price down to the support zone of 3933. The buyers' efforts to hold the price at the trendline are quite weak, indicating that this support structure is at risk of being penetrated and the market may extend its decline to lower areas. At this point, observing the price reaction at important support levels on the chart is the key factor to find a safe entry point. Preferred trading scenario: BUY when the market refuses to fall deeply and there is a clear reversal signal at the zone of 3973 - 3933. Target: immediate target towards 4104, further extension to 4203. Risk note: the uptrend will be invalidated if the H4 candle closes below 3933.Gold bounced back after breaking the resistance zone of 4048.

TVS-Trader
تحلیل طلای 13 نوامبر: گام بعدی خریداران به سوی اوج تاریخی (4250)
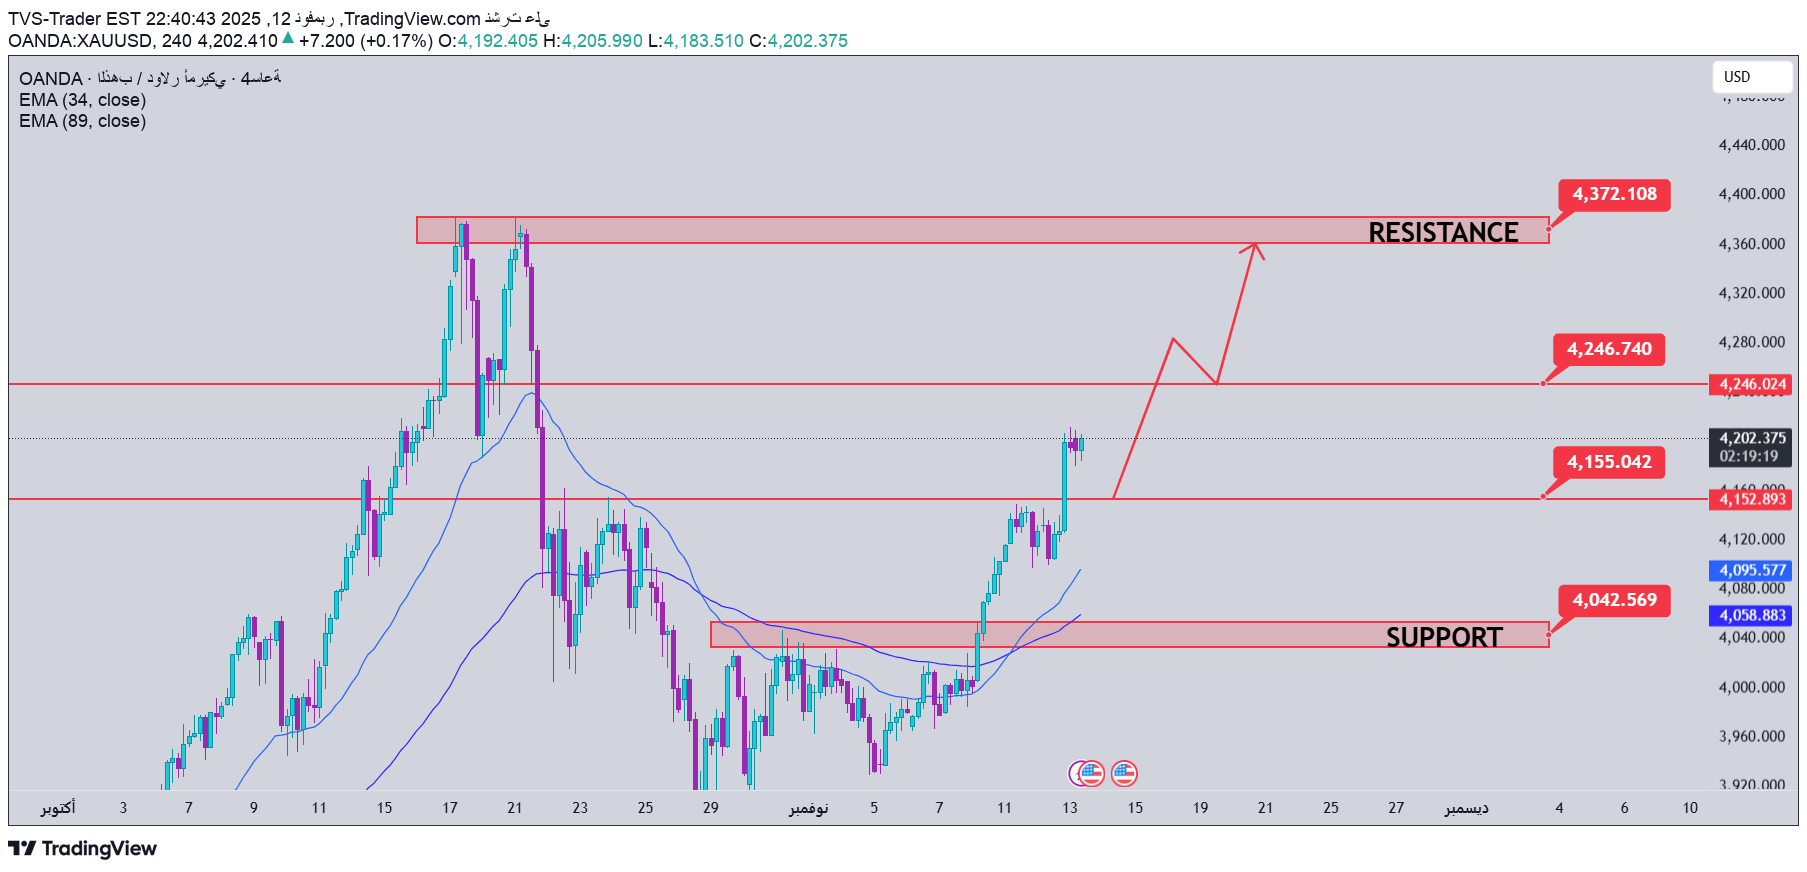
Gold continues to maintain its upward momentum after its successful breakout of the 4150 resistance level. This breakout confirms the strength of the uptrend, as the recently broken area forms a strong support base. Buyers are likely to target the next target at 4,250, before testing the historical high. From a trading perspective, the focus remains on buying options – whether at breakout entry points or on pullbacks towards support. As long as the price holds above the 4150 level, the bias will remain bullish, and traders can consider holding their positions to increase their profits as the trend continues. Buying options: Watch the price reaction around the 4150 support level 💬 Share your thoughts and analysis with us below. I'd love to hear different opinions from the trading community!

TVS-Trader
تحلیل طلا: آیا قیمت به مرز ۴۲۵۰ میرسد؟ (پیشبینی ۱۳ نوامبر)
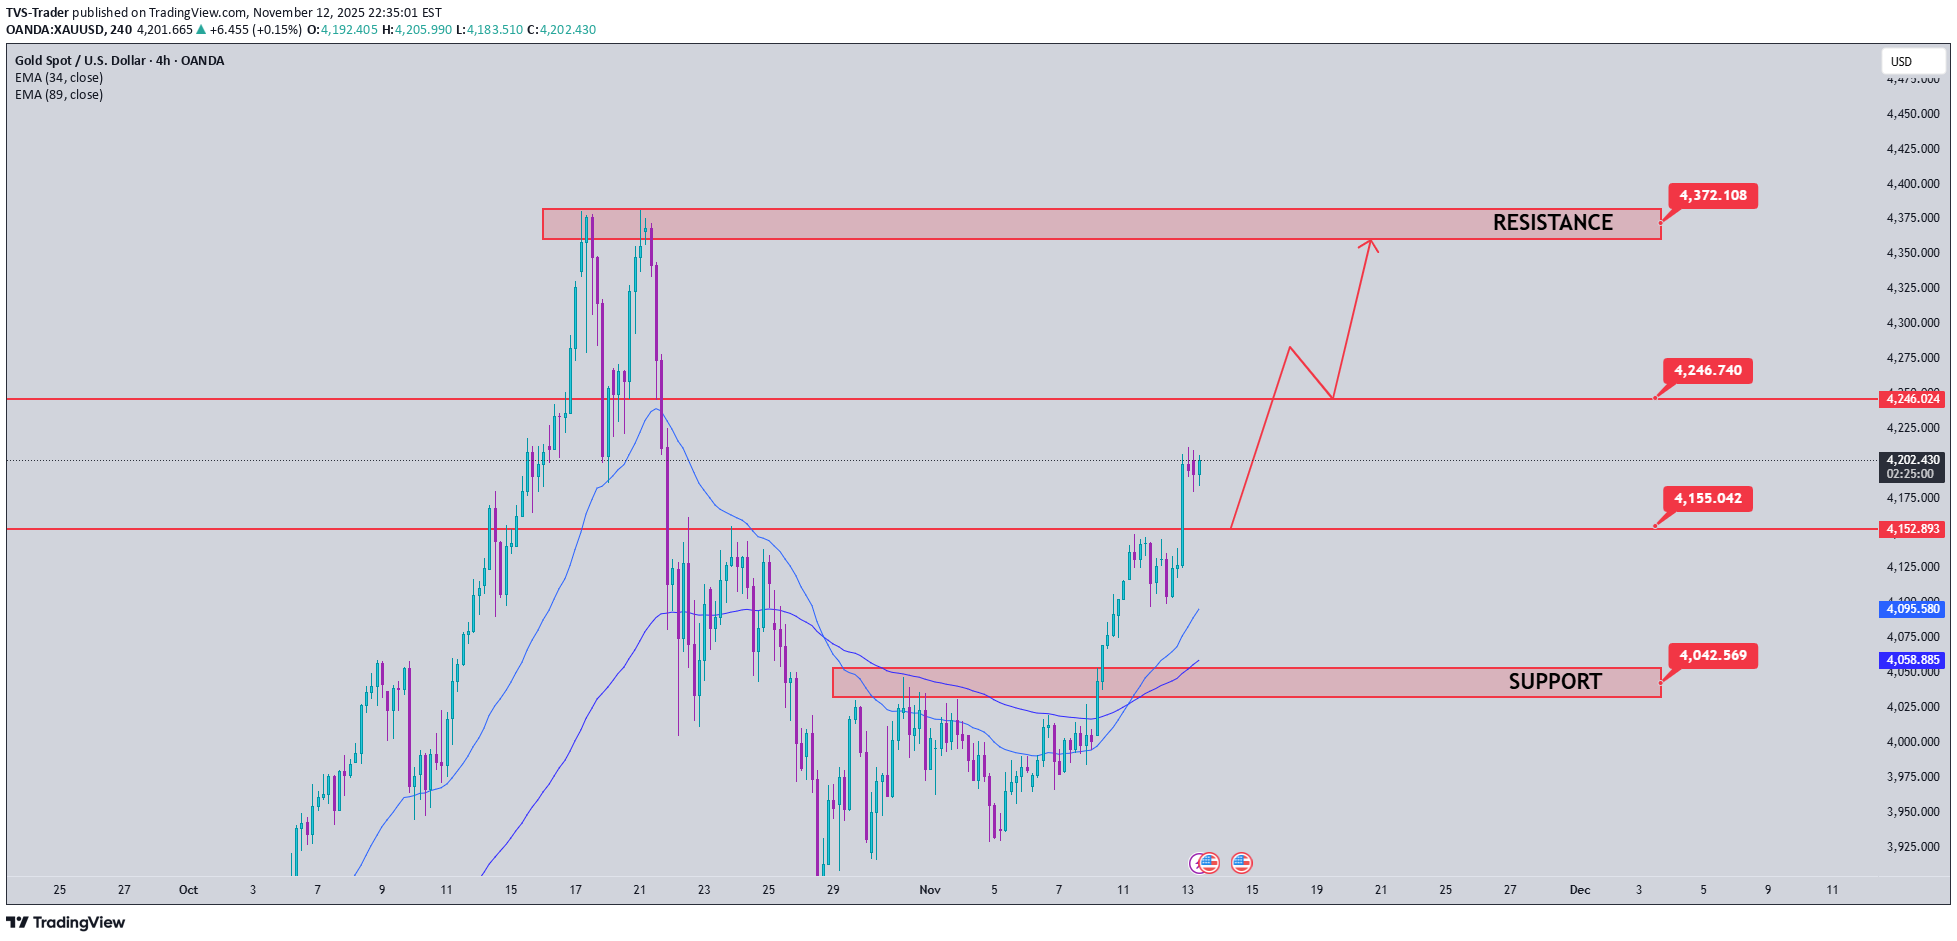
Gold continues to maintain its bullish momentum after successfully breaking above the 4150 resistance zone. This breakout confirms the strength of the uptrend, with the recently broken area now acting as a solid support base. The next target that buyers are likely aiming for is around 4250, before testing the all-time high zone. From a trading perspective, the focus remains on BUY setups—either on breakout entries or pullbacks to support. As long as price holds above 4150, the bias stays bullish and traders can consider holding positions to extend profits along the trend. BUY setup: Watch for price reaction around 4150 support 💬 Feel free to share your thoughts and analysis below. I’d love to hear different perspectives from the community!Gold attracts safe-haven flows amid sustained USD selling Gold attracts dip-buyers during the Asian session on Friday, stalling the previous day's pullback from a three-week high amid risk-off sentiment. Moreover, economic concerns weigh on the US Dollar and support bullion. However, reduced bets for a Fed rate cut in December may limit gains for the non-yielding metal, which still remains set for strong weekly gains.

TVS-Trader
تحلیل طلای امروز: صبر، منطقه خرید حساس و استراتژی دقیق برای سود!
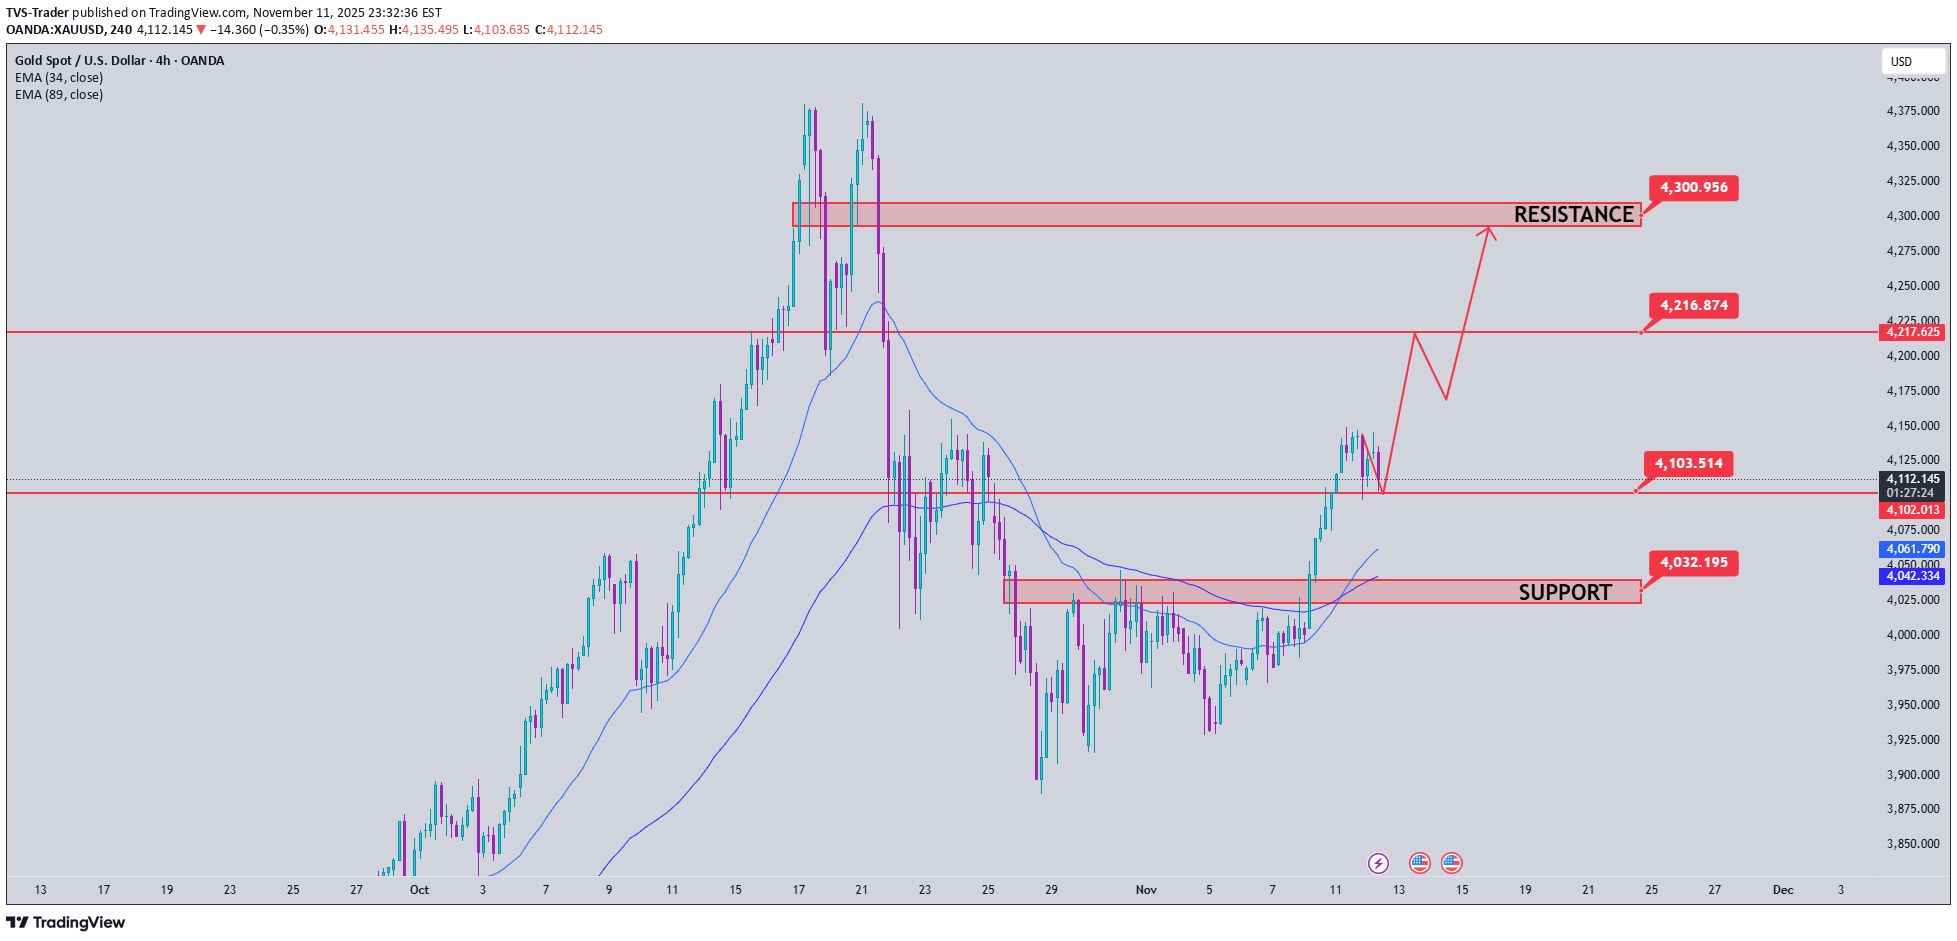
XAUUSD Update — Hold the structure, wait for a quality BUY setup Currently, the gold chart has no major structural changes — the market is in a correction phase at an important resistance zone. This is a “consolidation” phase before the next trend becomes more obvious, so the priority is to be patient and wait for a high probability setup. If you are holding a SELL position from the resistance zone, the current strategy is to hold the order and manage profits — wait for a reaction at the support zones to decide to close/open more. For those looking for BUY opportunities, wait for signs of price rejection (rejection / wick / bullish price action) at the indicated support zone before entering the order. Important zone: 4075 — 4031 (support zone to find BUY signal) Strategy: Enter BUY when there is a clear price rejection signal + volume/price action reaction. Target: 4300 Risk management: stoploss placed below support zone if price action breaks and closes deep below.

TVS-Trader
پیشبینی طلا (۱۱ نوامبر): آیا اصلاح موقتی در راه است؟ استراتژی فروش اسکالپ در مقاومت ۴۱۵۰!
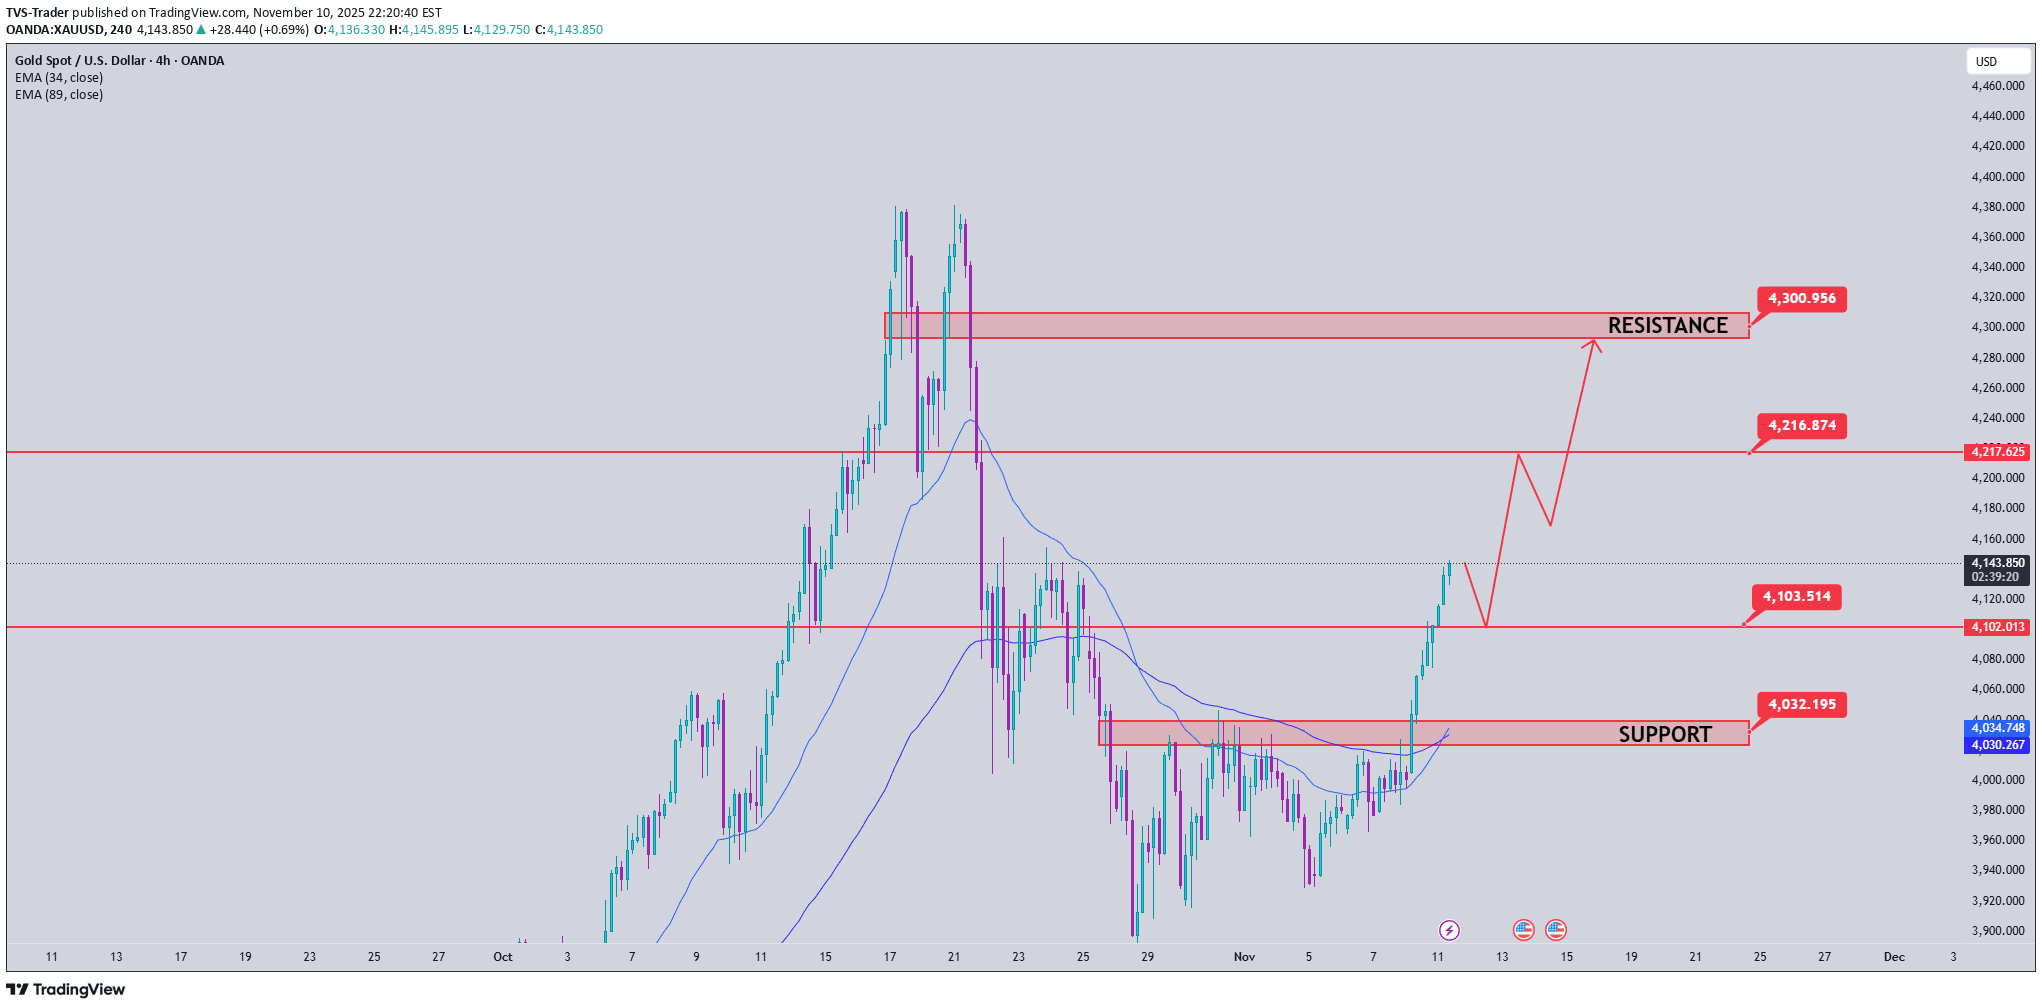
Gold continued to move as expected in yesterday's session, bringing impressive profits to traders who followed the previous strategy. Currently, the resistance zone of 4150 is acting as an important barrier as buying pressure starts to slow down. There is a high possibility that the market will see a short-term correction around this area. Current strategy: SELL GOLD (Scalping) around the resistance zone of 4145, expecting a short-term price reaction. When the buyers return and create a confirmation signal around the 4076–4106 area, wait to BUY in line with the main trend, with a further target towards ATH 4375, where the liquidity zone above is still empty. 📈 The overall trend is still up – the correction is only temporary for the market to gain momentum for the next wave.

TVS-Trader
پیشبینی انفجاری طلا: استراتژی خرید قطعی برای تاریخ ۱۱ اکتبر!
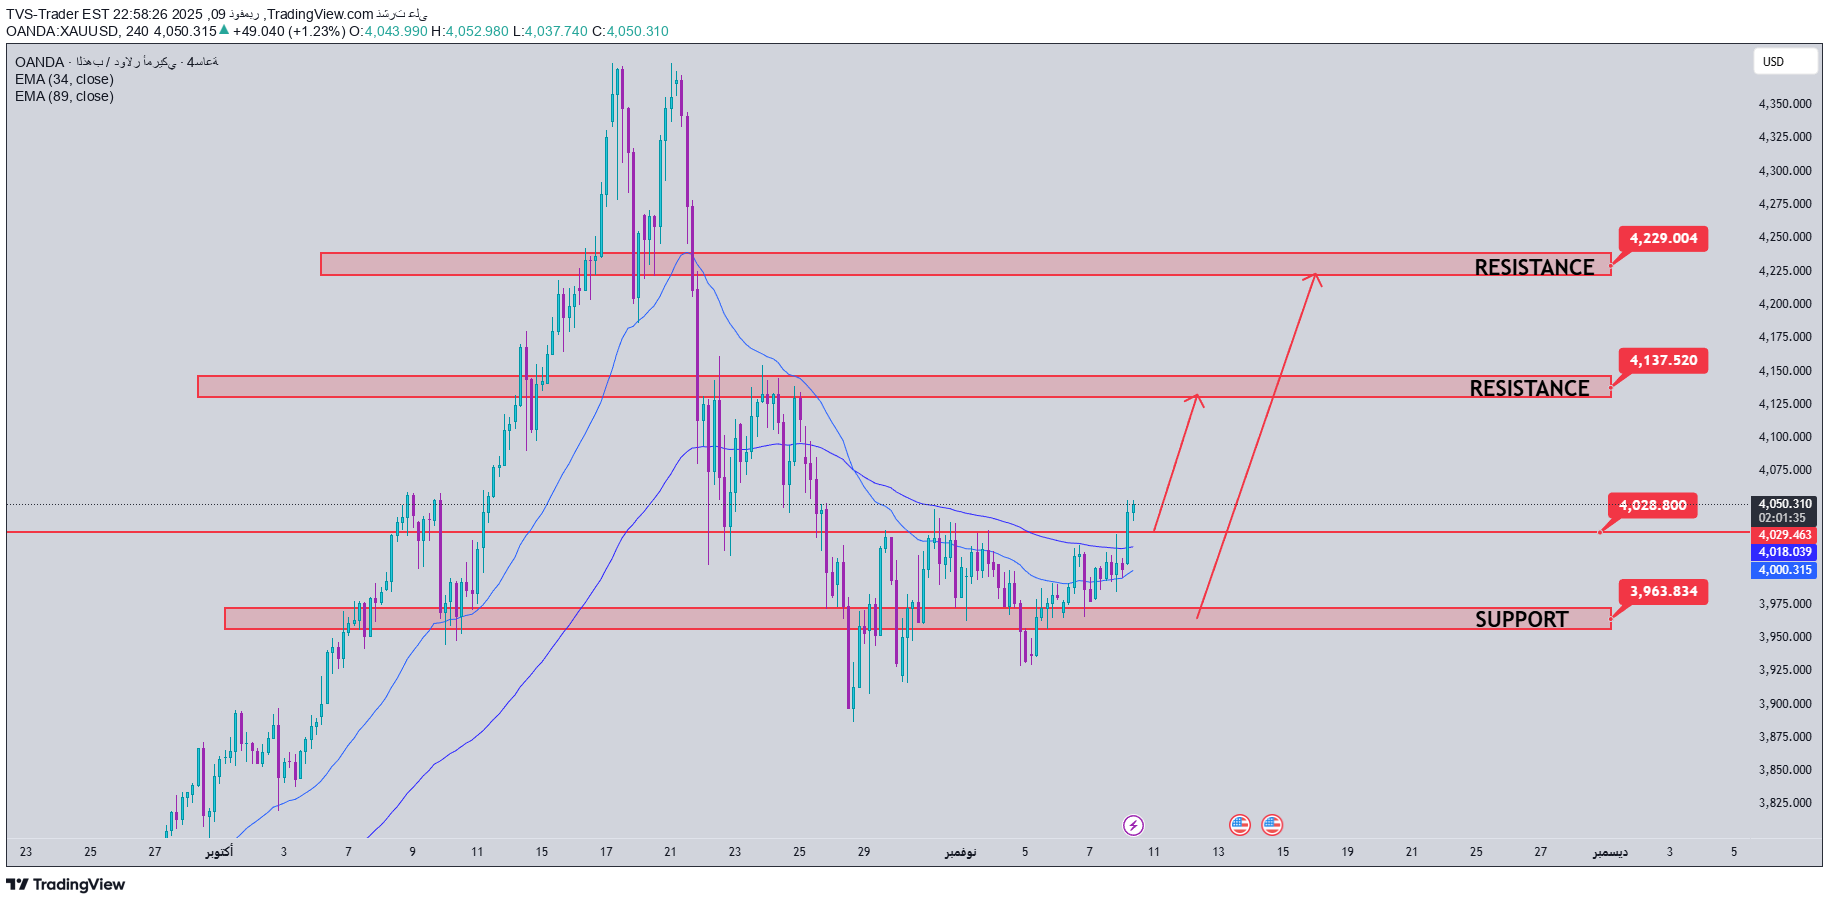
✨ Gold analysis of XAUUSD pair - 10/11/2025 Gold price has officially breached the key level area of 4031, confirming the formation of a strong bullish wave. This development makes the day trading strategy much more straightforward and useful when trend-following buy setups are fully prioritized. Main scenario: ✅ Buy at the price area 4045 ✅ Buy when a price rejection signal appears around the 4031 support area 🎯 Profit target: 4150 Sub-scenario (low risk): ❌ It is recommended to sell only if a false breakout appears and the price of the candle closes below 3985 - however, this possibility is currently very low. 👉 Note: The 4031 breakout area is the perfect confirmation point for an uptrend. It is preferable to look for buying opportunities with the main wave rather than trading against the trend.

TVS-Trader
تحلیل طلای امروز: شکست حیاتی ۴۰۳۱ و استراتژی خرید قطعی!
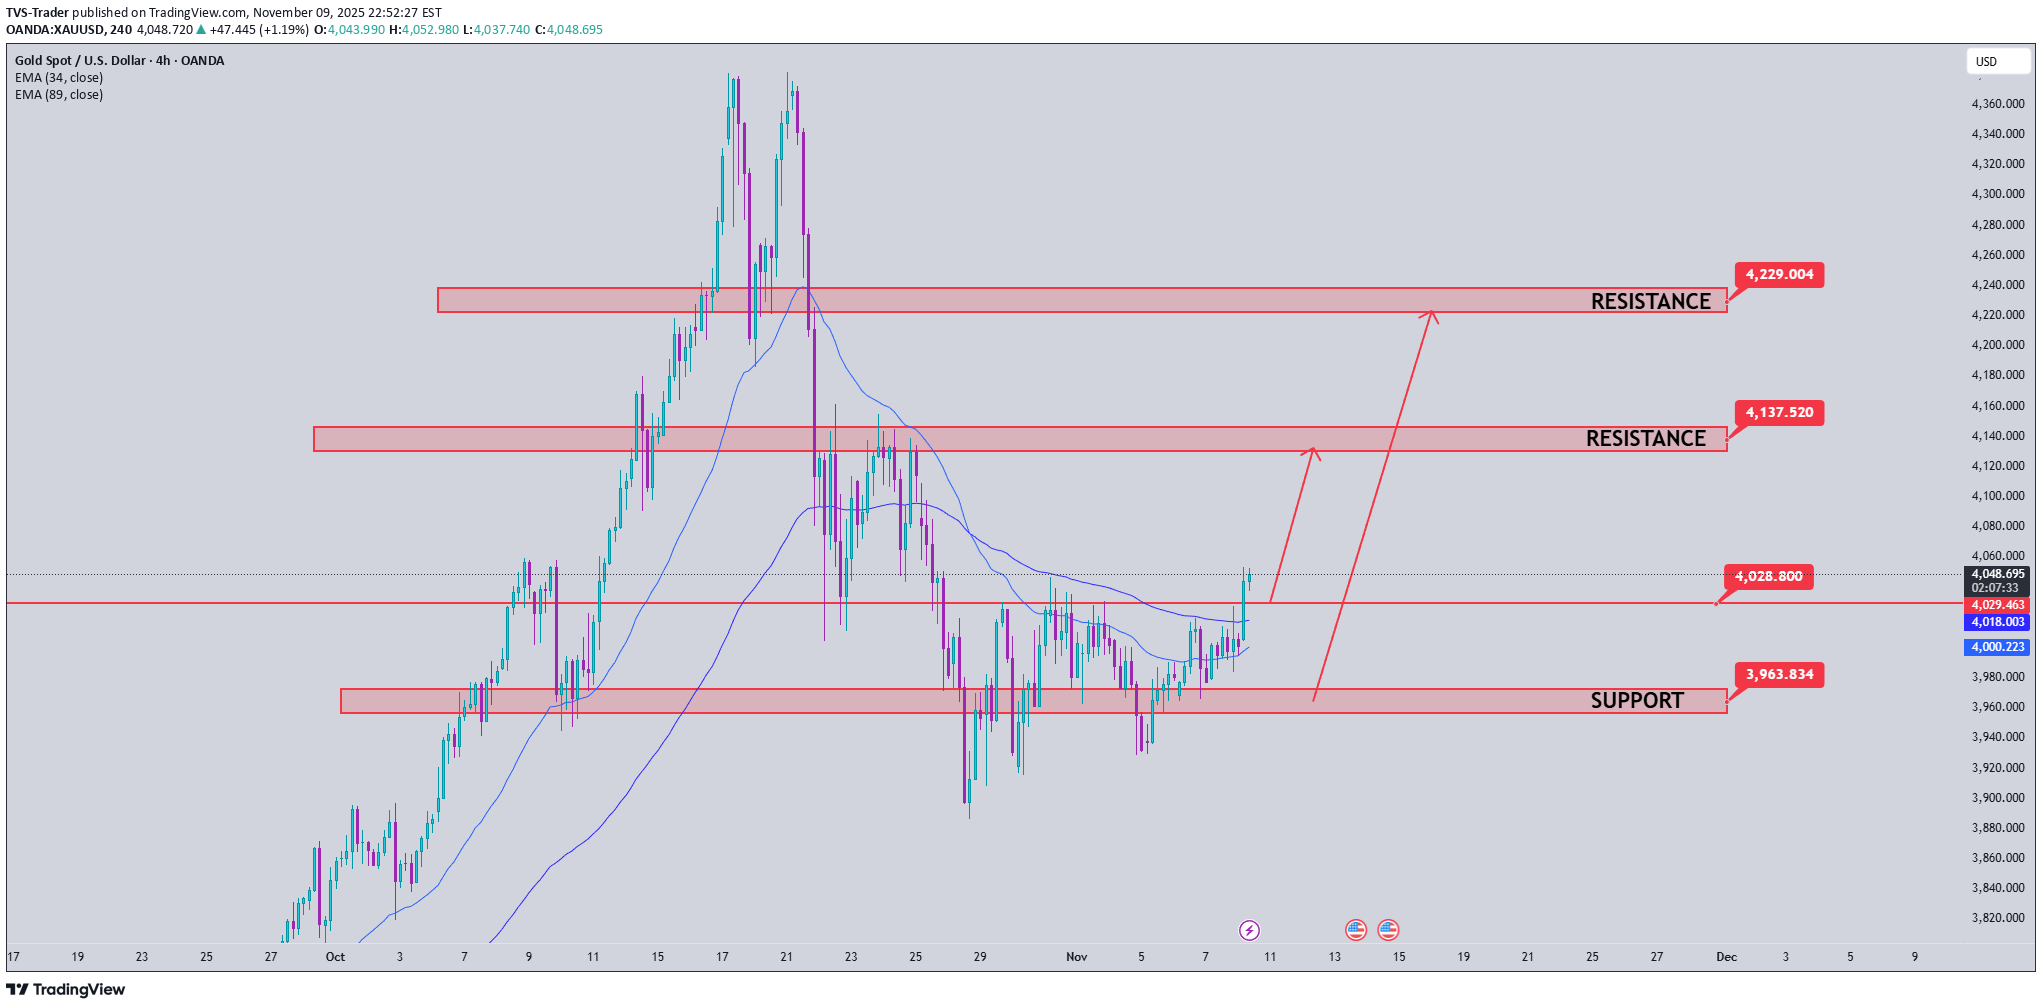
✨ Gold Analysis XAUUSD – 10/11/2025 Gold price has officially broken the Keylevel 4031 zone, confirming a strong bullish wave is forming. This development makes the intraday trading strategy clearer and more favorable when giving full priority to BUY setups following the trend. Main scenario: ✅ BUY right at the price zone 4045 ✅ BUY when the price rejection signal appears around the support zone 4031 🎯 Profit target: 4150 Sub-scenario (low risk): ❌ SELL is only considered if a false break appears and the price closes the candle back below 3985 – however, this possibility is currently very low. 👉 Comment: The break zone 4031 is the perfect confirmation point for the uptrend. Prioritize looking for buying opportunities with the main wave instead of trading against the trend.+ 500 pipsGold holds gains near $4,150 as focus shifts to the weekly ADP jobs report. Gold price holds positive ground near $4,150 in the Asian session on Tuesday. The precious metal edges higher after reaching a two-week high in the previous session, amid prospects for rate cuts by the US Federal Reserve in December and a softer US Dollar. The US ADP Employment Change Weekly will be in the spotlight later on Tuesday.

TVS-Trader
تحلیل طلای ۱۱ خرداد: فرصتهای خرید و پیشبینی نوسانات حساس قیمت
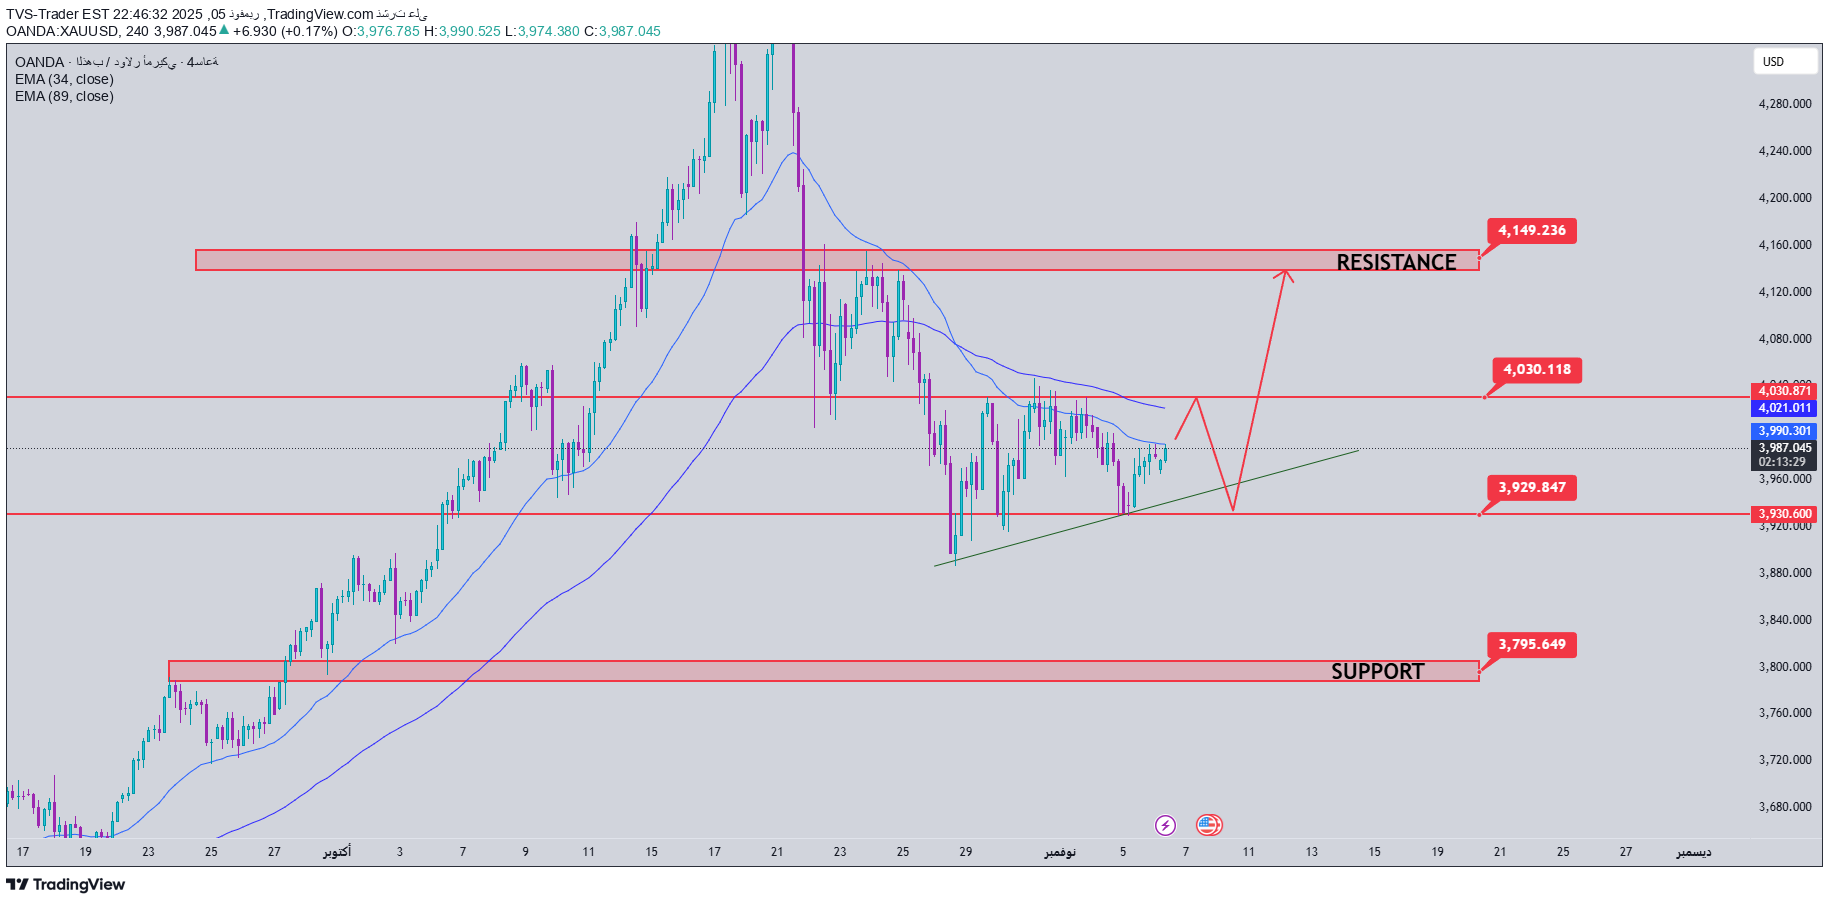
✏️ Analysis of the GOLD/USD pair - 11/06 Today, gold is trading within a 100 price range, confined between the 4031 resistance area and the 3931 support area. The main trend is still up, so the strategy of buying, following the market momentum, will be most appropriate in this period. The key level area of 4031 still plays an important role – if the buying force is strong enough to break it, the next target will be 4150. On the other hand, it is necessary to monitor the price reaction around the trend line and support area of yesterday's Asian trading session to determine whether the buying power is still there or not. Trading plan 📈 Buy at 3984 Buy when a price rejection signal appears at the support level 3931 Buy when the price breaks the 4031 level Target: 4150 ⚠️ Risk: When the price breaks the trend line and the candle closes below the 3930 level
Disclaimer
Any content and materials included in Sahmeto's website and official communication channels are a compilation of personal opinions and analyses and are not binding. They do not constitute any recommendation for buying, selling, entering or exiting the stock market and cryptocurrency market. Also, all news and analyses included in the website and channels are merely republished information from official and unofficial domestic and foreign sources, and it is obvious that users of the said content are responsible for following up and ensuring the authenticity and accuracy of the materials. Therefore, while disclaiming responsibility, it is declared that the responsibility for any decision-making, action, and potential profit and loss in the capital market and cryptocurrency market lies with the trader.