
TRADERASLIHAN
@t_TRADERASLIHAN

What symbols does the trader recommend buying?
Purchase History
پیام های تریدر
Filter
TRADERASLIHAN
GOLD ANALİZ
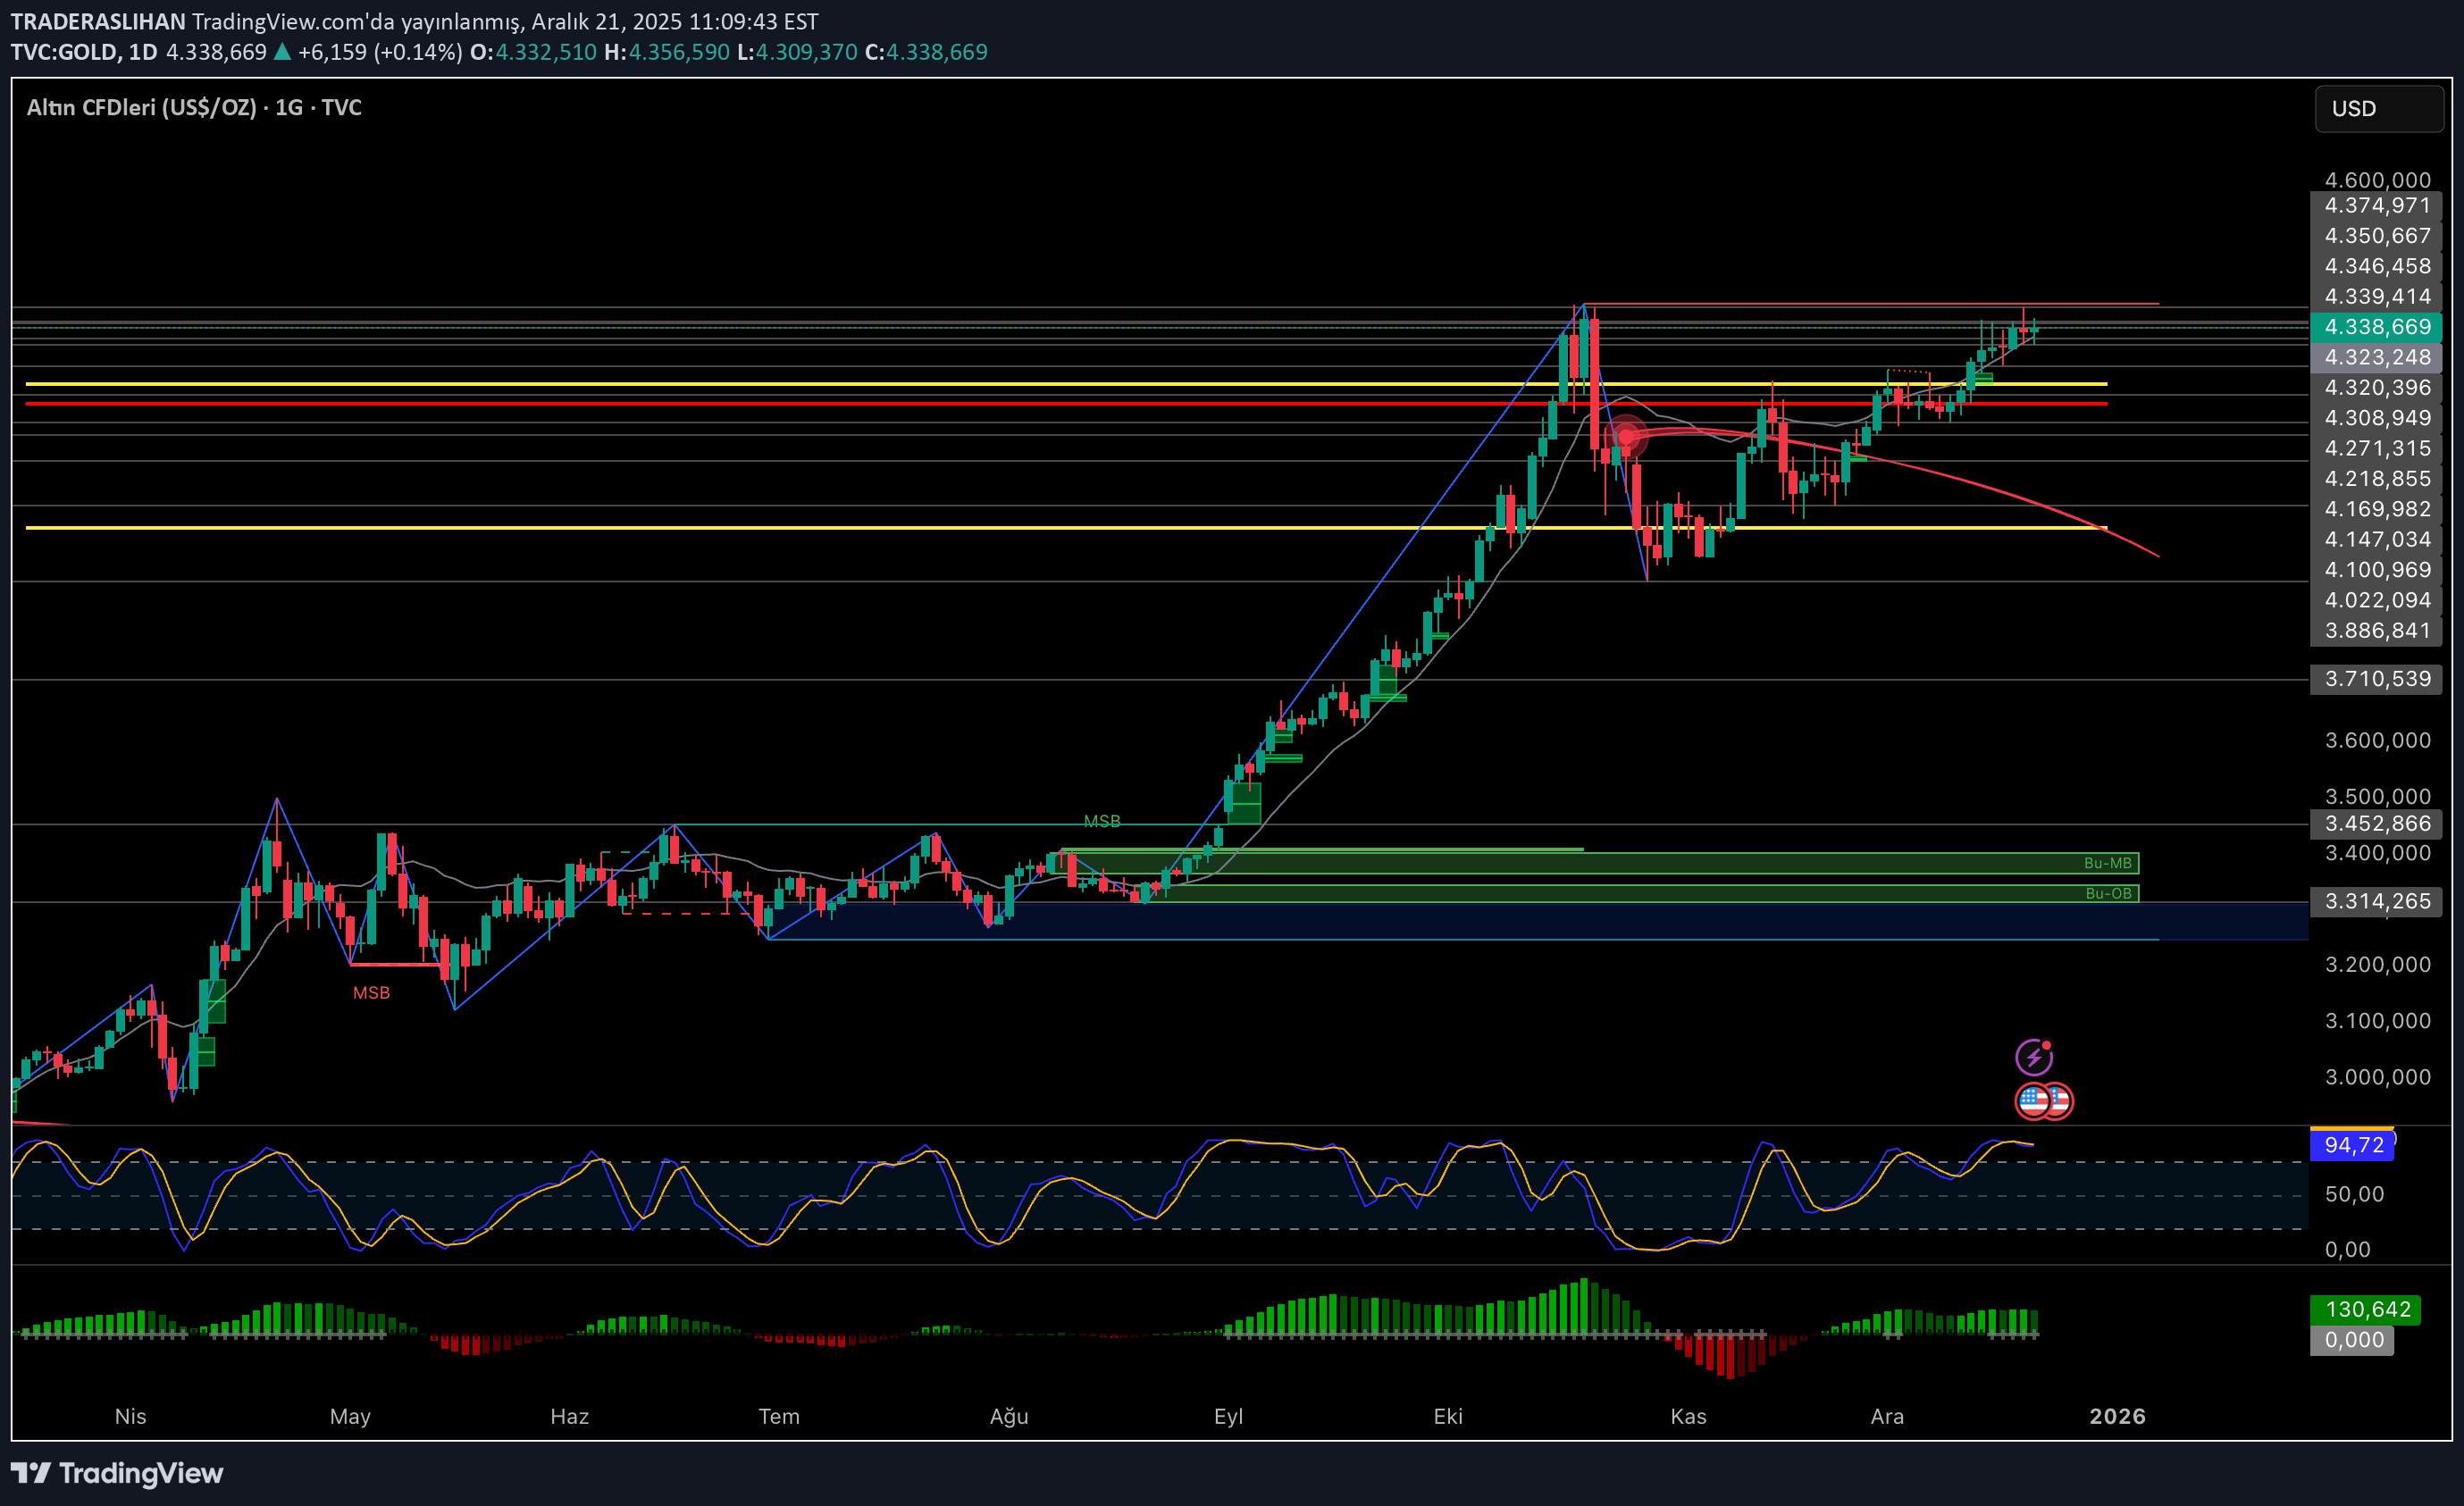
The big picture is very clear on the #GOLD daily chart. The main trend is still up and the price is now in the 4,330–4,340 band, just below the major resistance area that was previously challenged. 🤩This region is important because there was a hard sell here before. The current movement shows that the upward desire continues, but let me say this clearly: I wouldn't say a new rally is starting without seeing a daily close above 4,350. 🤩The 4.300–4.270 band below is the main support. As long as this zone can be maintained, pullbacks would be in-trend corrections for me. The place that destroys the real structure is much lower.🤩 The trend is strong but the price is right at the resistance. Here, the winner is not the one who rushes, but the one who waits for the closing. Gold currently says: There is strength, but patience is required.YTD
TRADERASLIHAN
GOLD ANALİZ

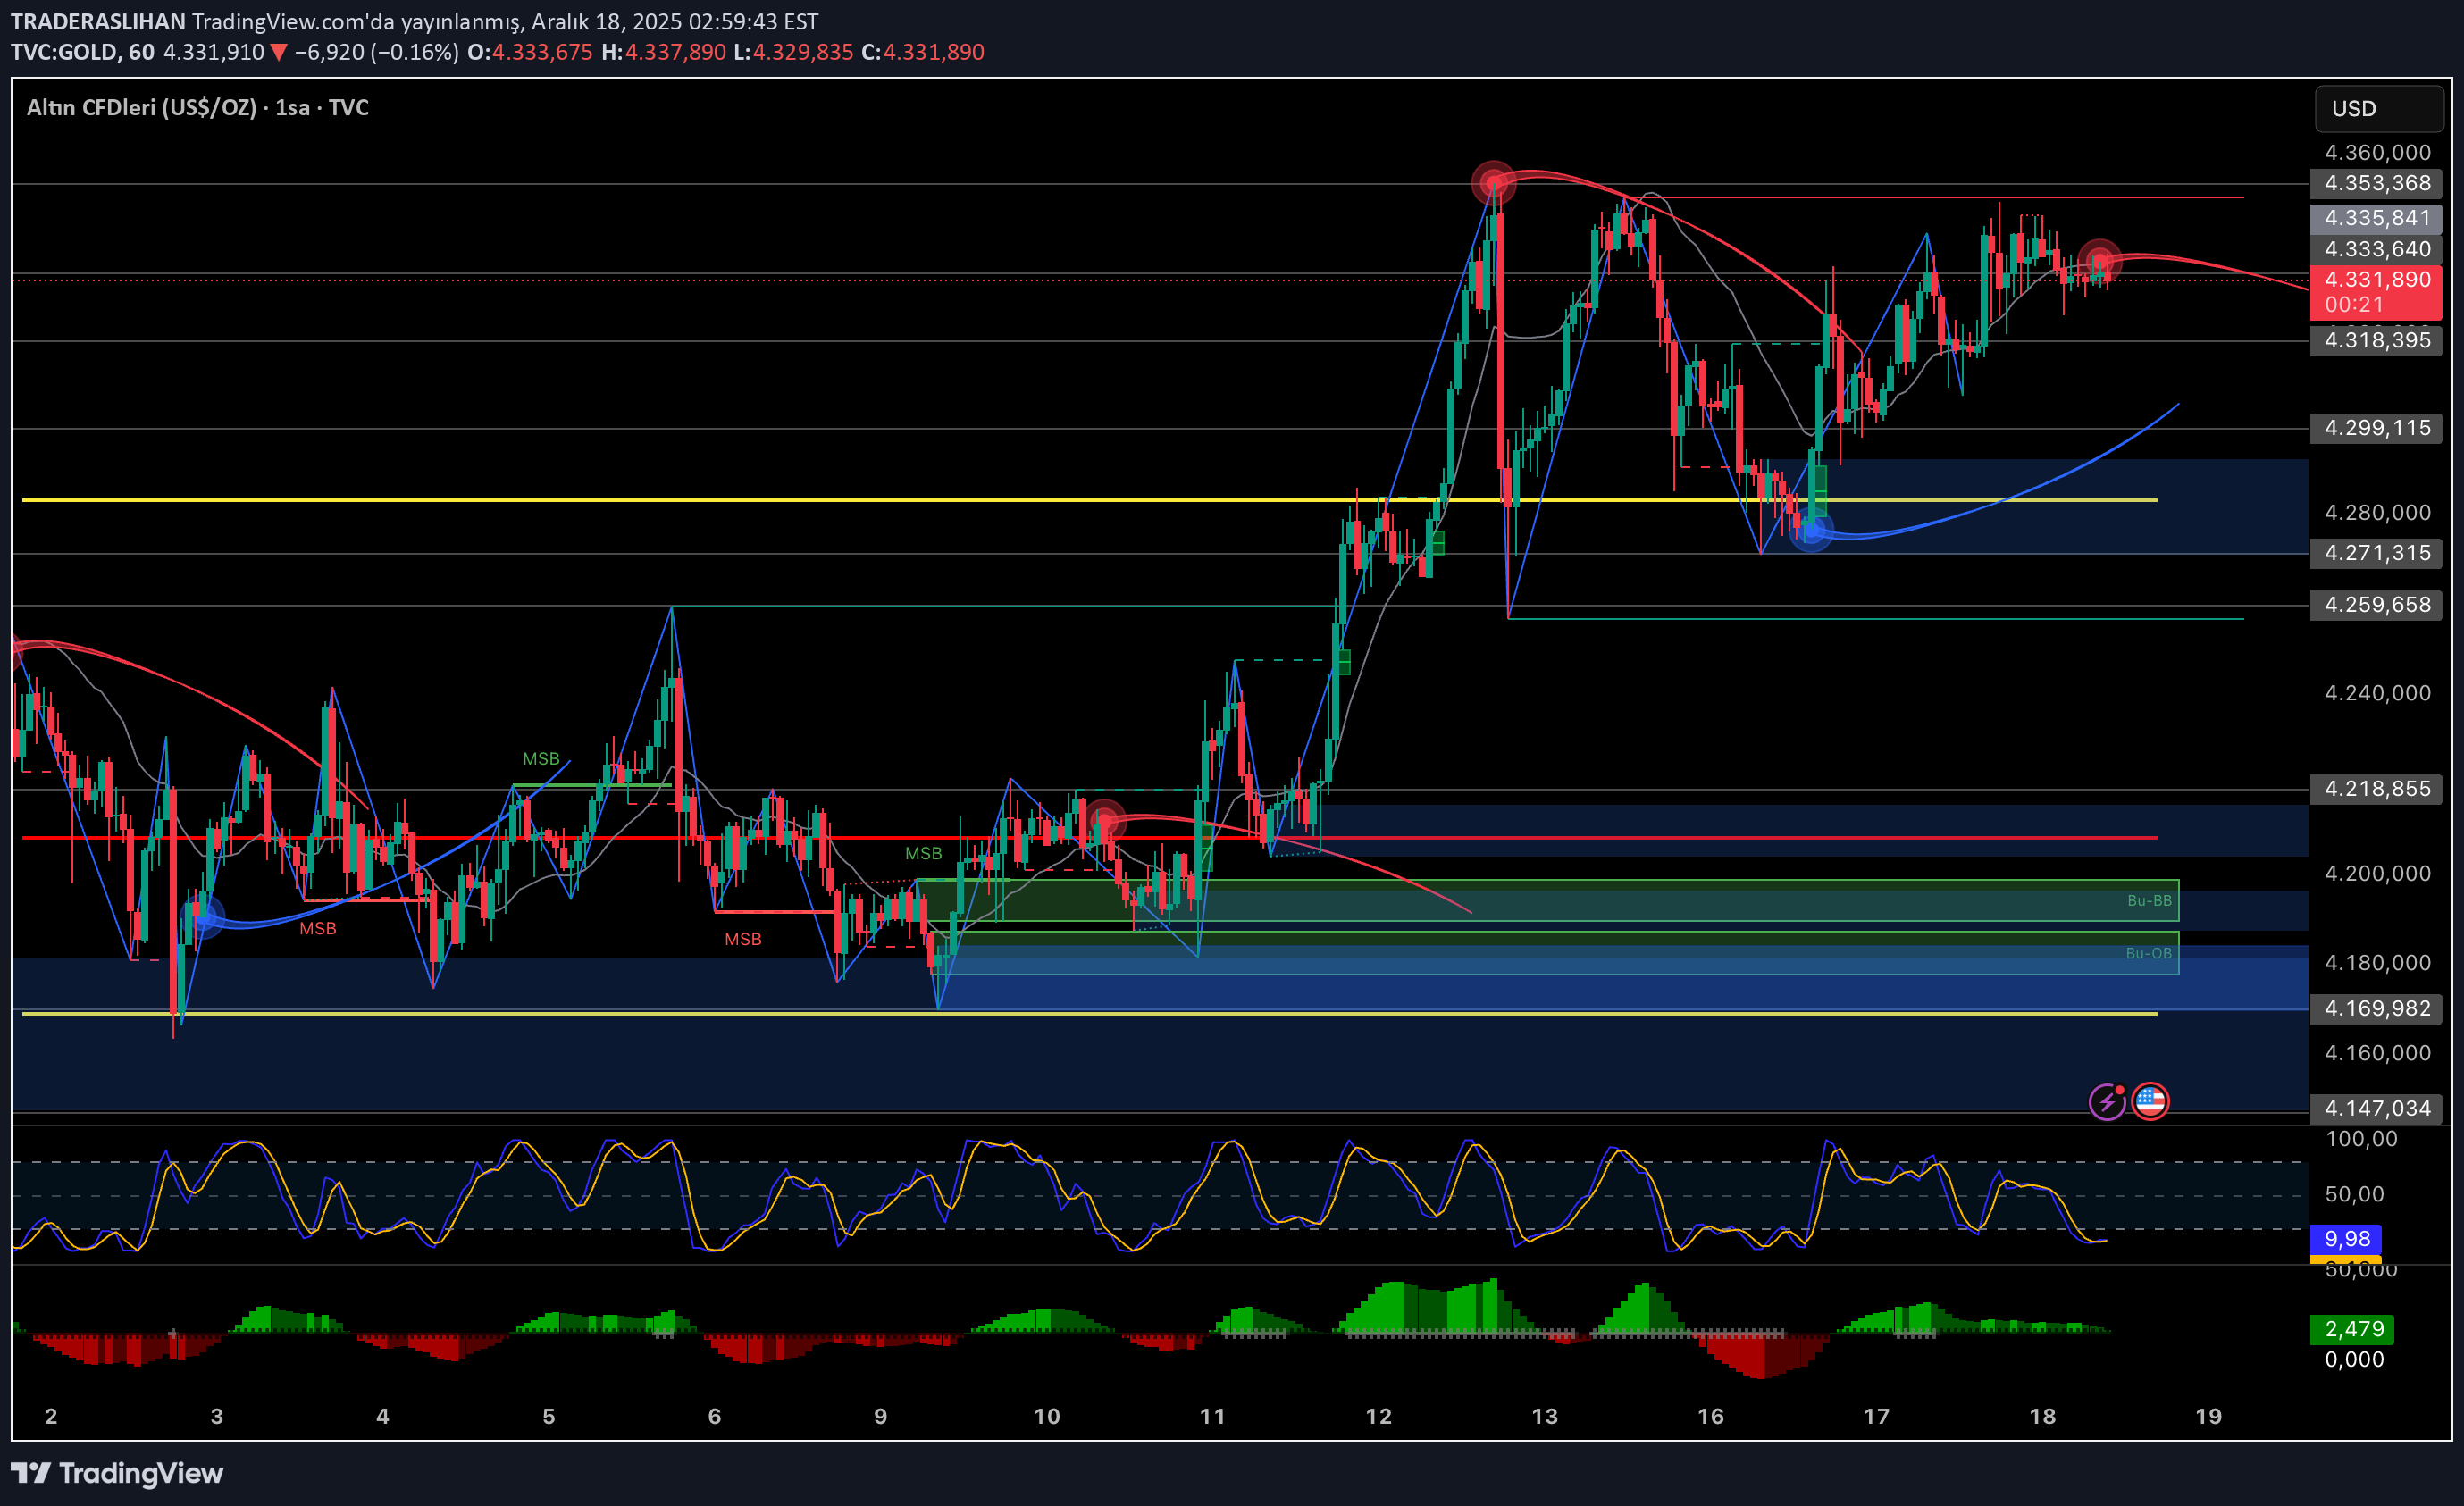
#GOLD Purchases from below worked and the price has now moved up to the 4,350 band. This move, in my opinion, is a clean demand zone response. 🍀But let me say this clearly: The 4.355–4.360 region is an area that will be difficult in the short term. This is where the sell-off came from before, and now the price is lingering just below this area. Chasing aggressive longs here is not right in my opinion. ↗️The 4.330–4.320 band below is still very critical. This region is both the building support and the area where the trend is nourished. As long as the price stays above here, I read pullbacks as corrections. 🍀 If there is a clear break above 4.360, the upward momentum will continue. Otherwise, it would not be surprising to see a respite towards the 4.330–4.320 region. 🧲In short, the market says this: A place not to run, but to watch patiently. IT IS NOT INVESTMENT ADVICE.
TRADERASLIHAN
تحلیل طلای امروز: آیا قیمت در آستانه ریزش است یا صعود؟ (سطوح حیاتی حمایت و مقاومت)
#GOLD After the strong rise, the price encounters supply in the 4.353 – 4.360 band. There is a weakening in momentum indicators, and a consolidation process is being monitored in the short term. 🔴 Resistance: 4.353 – 4.360 🟢Support: 4.299 → 4.280 (critical demand) If the 4.280 – 4.300 region is maintained, the upward structure will continue. Six-hour close at 4,299 could deepen the correction. Patience and post-breakout direction confirmation are important between these two regions. ⚠️ It is not investment advice.
TRADERASLIHAN
GOLD ANALİZ
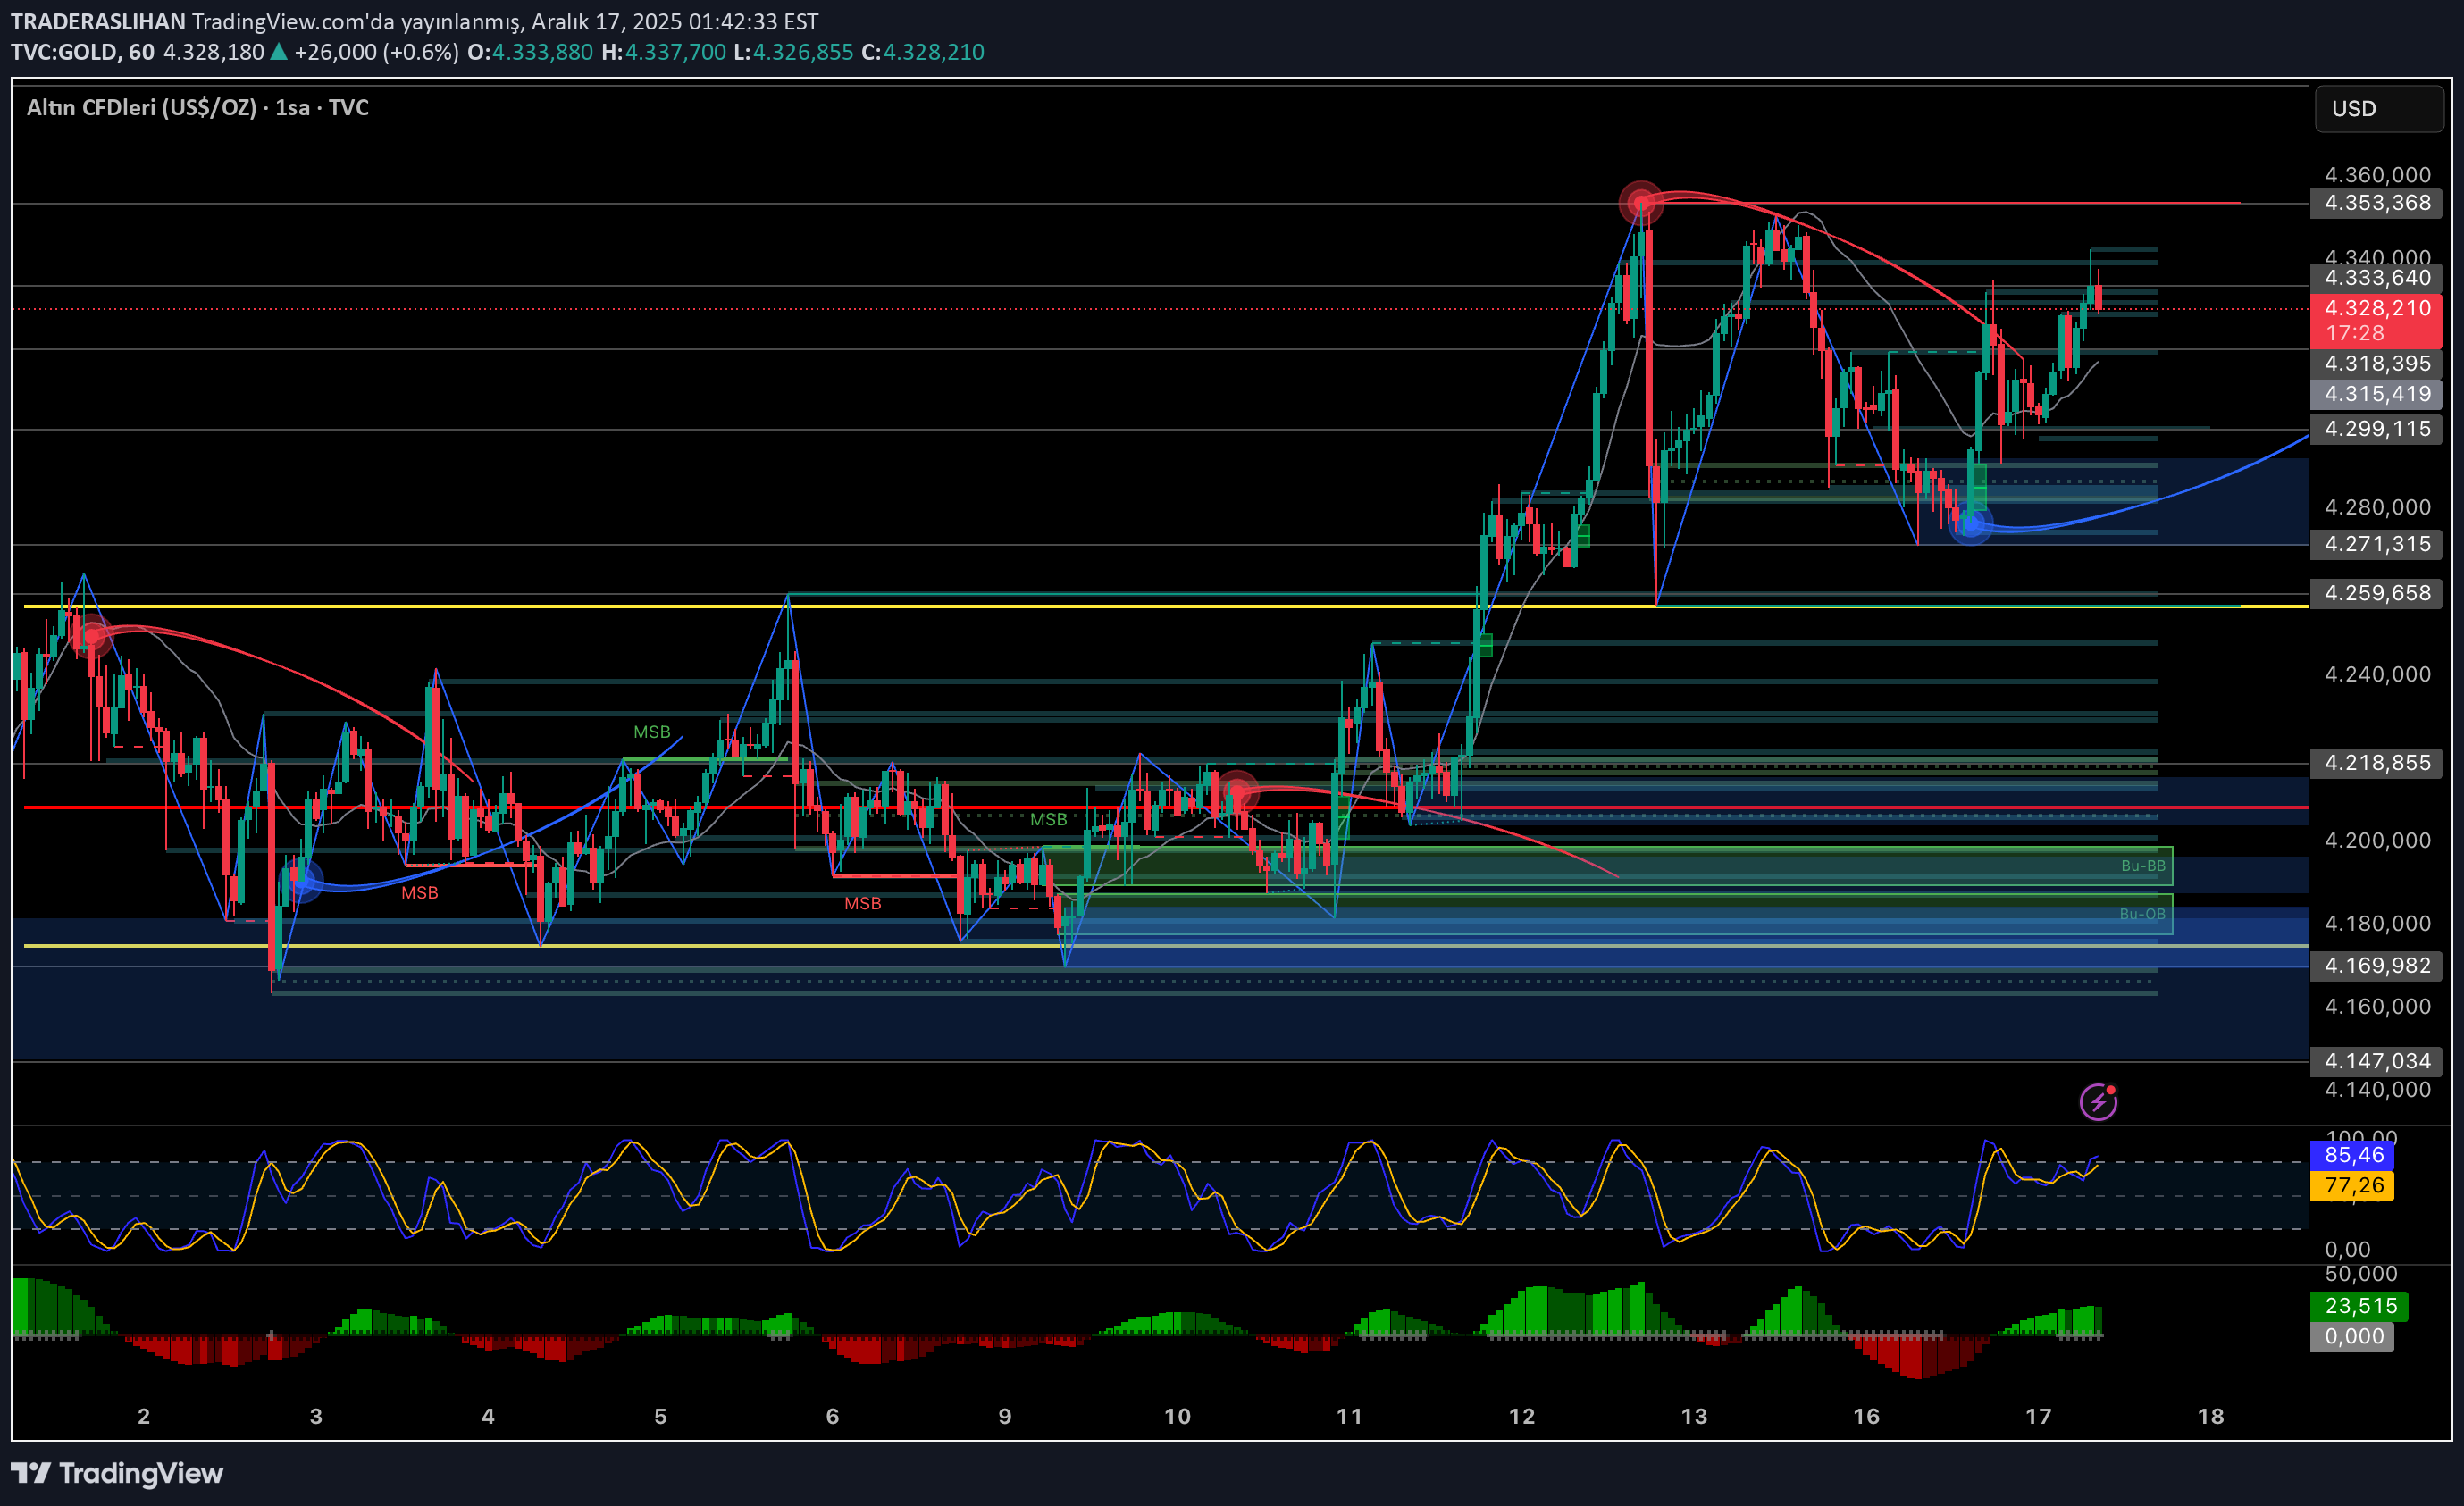
#GOLD The price was clearly under selling pressure above after the harsh sales from the 4.350 region. 🛫This area is the main supply area right now and unless it is exceeded, I do not see the rises as the beginning of a permanent trend. 🌎Although the price is trying to hold on to the 4.328–4.330 band, the movements are more of a reaction nature. 🧲In the short term, the 4,300–4,290 band is a critical balance area. As long as this zone remains above, upward attempts may continue, but appetite will remain limited until 4,350 is broken. The 4,270 level below is the most important intraday support. If there is an hourly close below this level, it would not be surprising if the correction deepens first towards 4.218, then 4.200 and 4.180. 🛡On the momentum side, there is an upward recovery attempt in short-term indicators, but we see that it is approaching the overbought zone. The volume side is still weak, indicating that the upward moves are more of a technical reaction and not a strong trend at the moment. 🍀 Gold is under pressure as long as it remains below 4.350, holding above 4.300 only creates a short-term buying opportunity. To determine the real direction, it is necessary to see either a clear break above 4.350 or a closing below 4.270. THIS IS NOT INVESTMENT ADVICE.
TRADERASLIHAN
GOLD ANALİZ
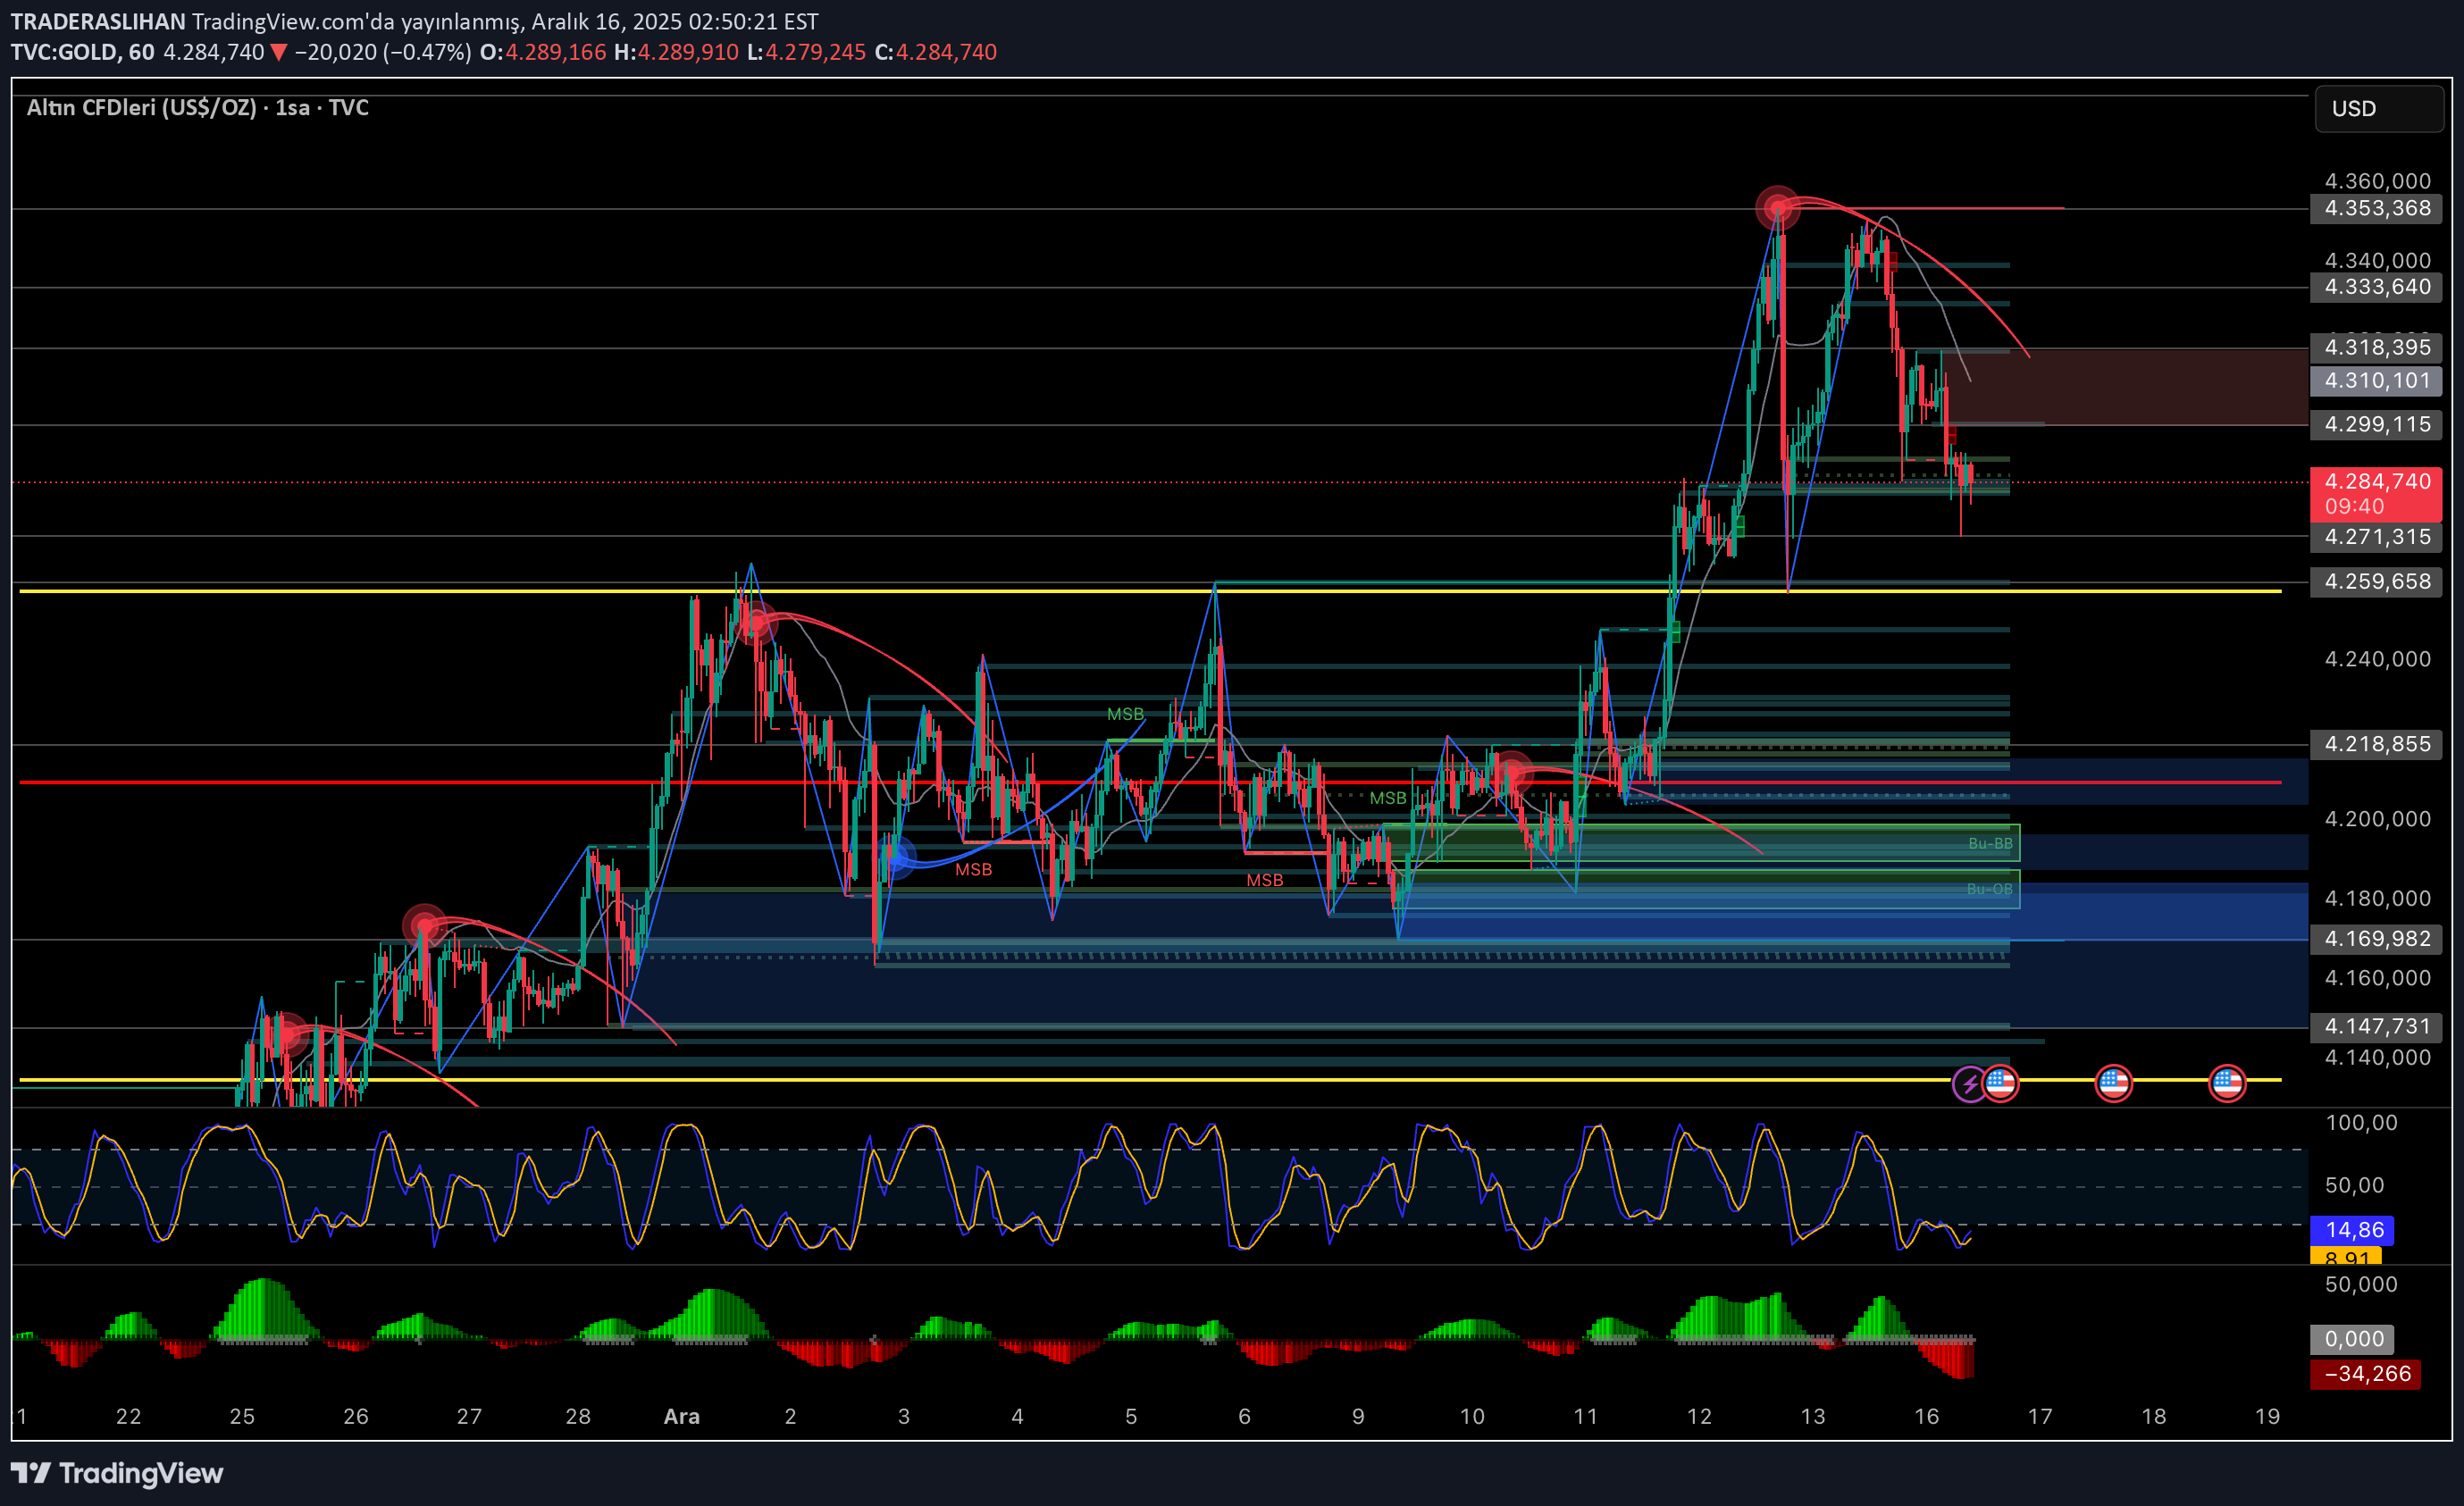
#GOLD After the net sales from the 4.353 region, the price retreated to 4.287 levels. This area is intermediate support in the short term, but the reaction in the main picture is weak. 🔴 4.318 – 4.335 band is a strong sales area. As long as it remains below this area, I continue to read the rises as corrections. 👑4.271 – 4.260 is the first important support. If this zone is broken, the main demand area below 4,220 – 4,200 will operate. 📇Momentum and oscillators still support the downside. In-trend selling pressure is not over. As long as it stays below 4.318, selling pressure is at the forefront. 4,200 will not be a surprise if it closes below 4,260. IT IS NOT INVESTMENT ADVICE.
TRADERASLIHAN
GOLD ANALİZ
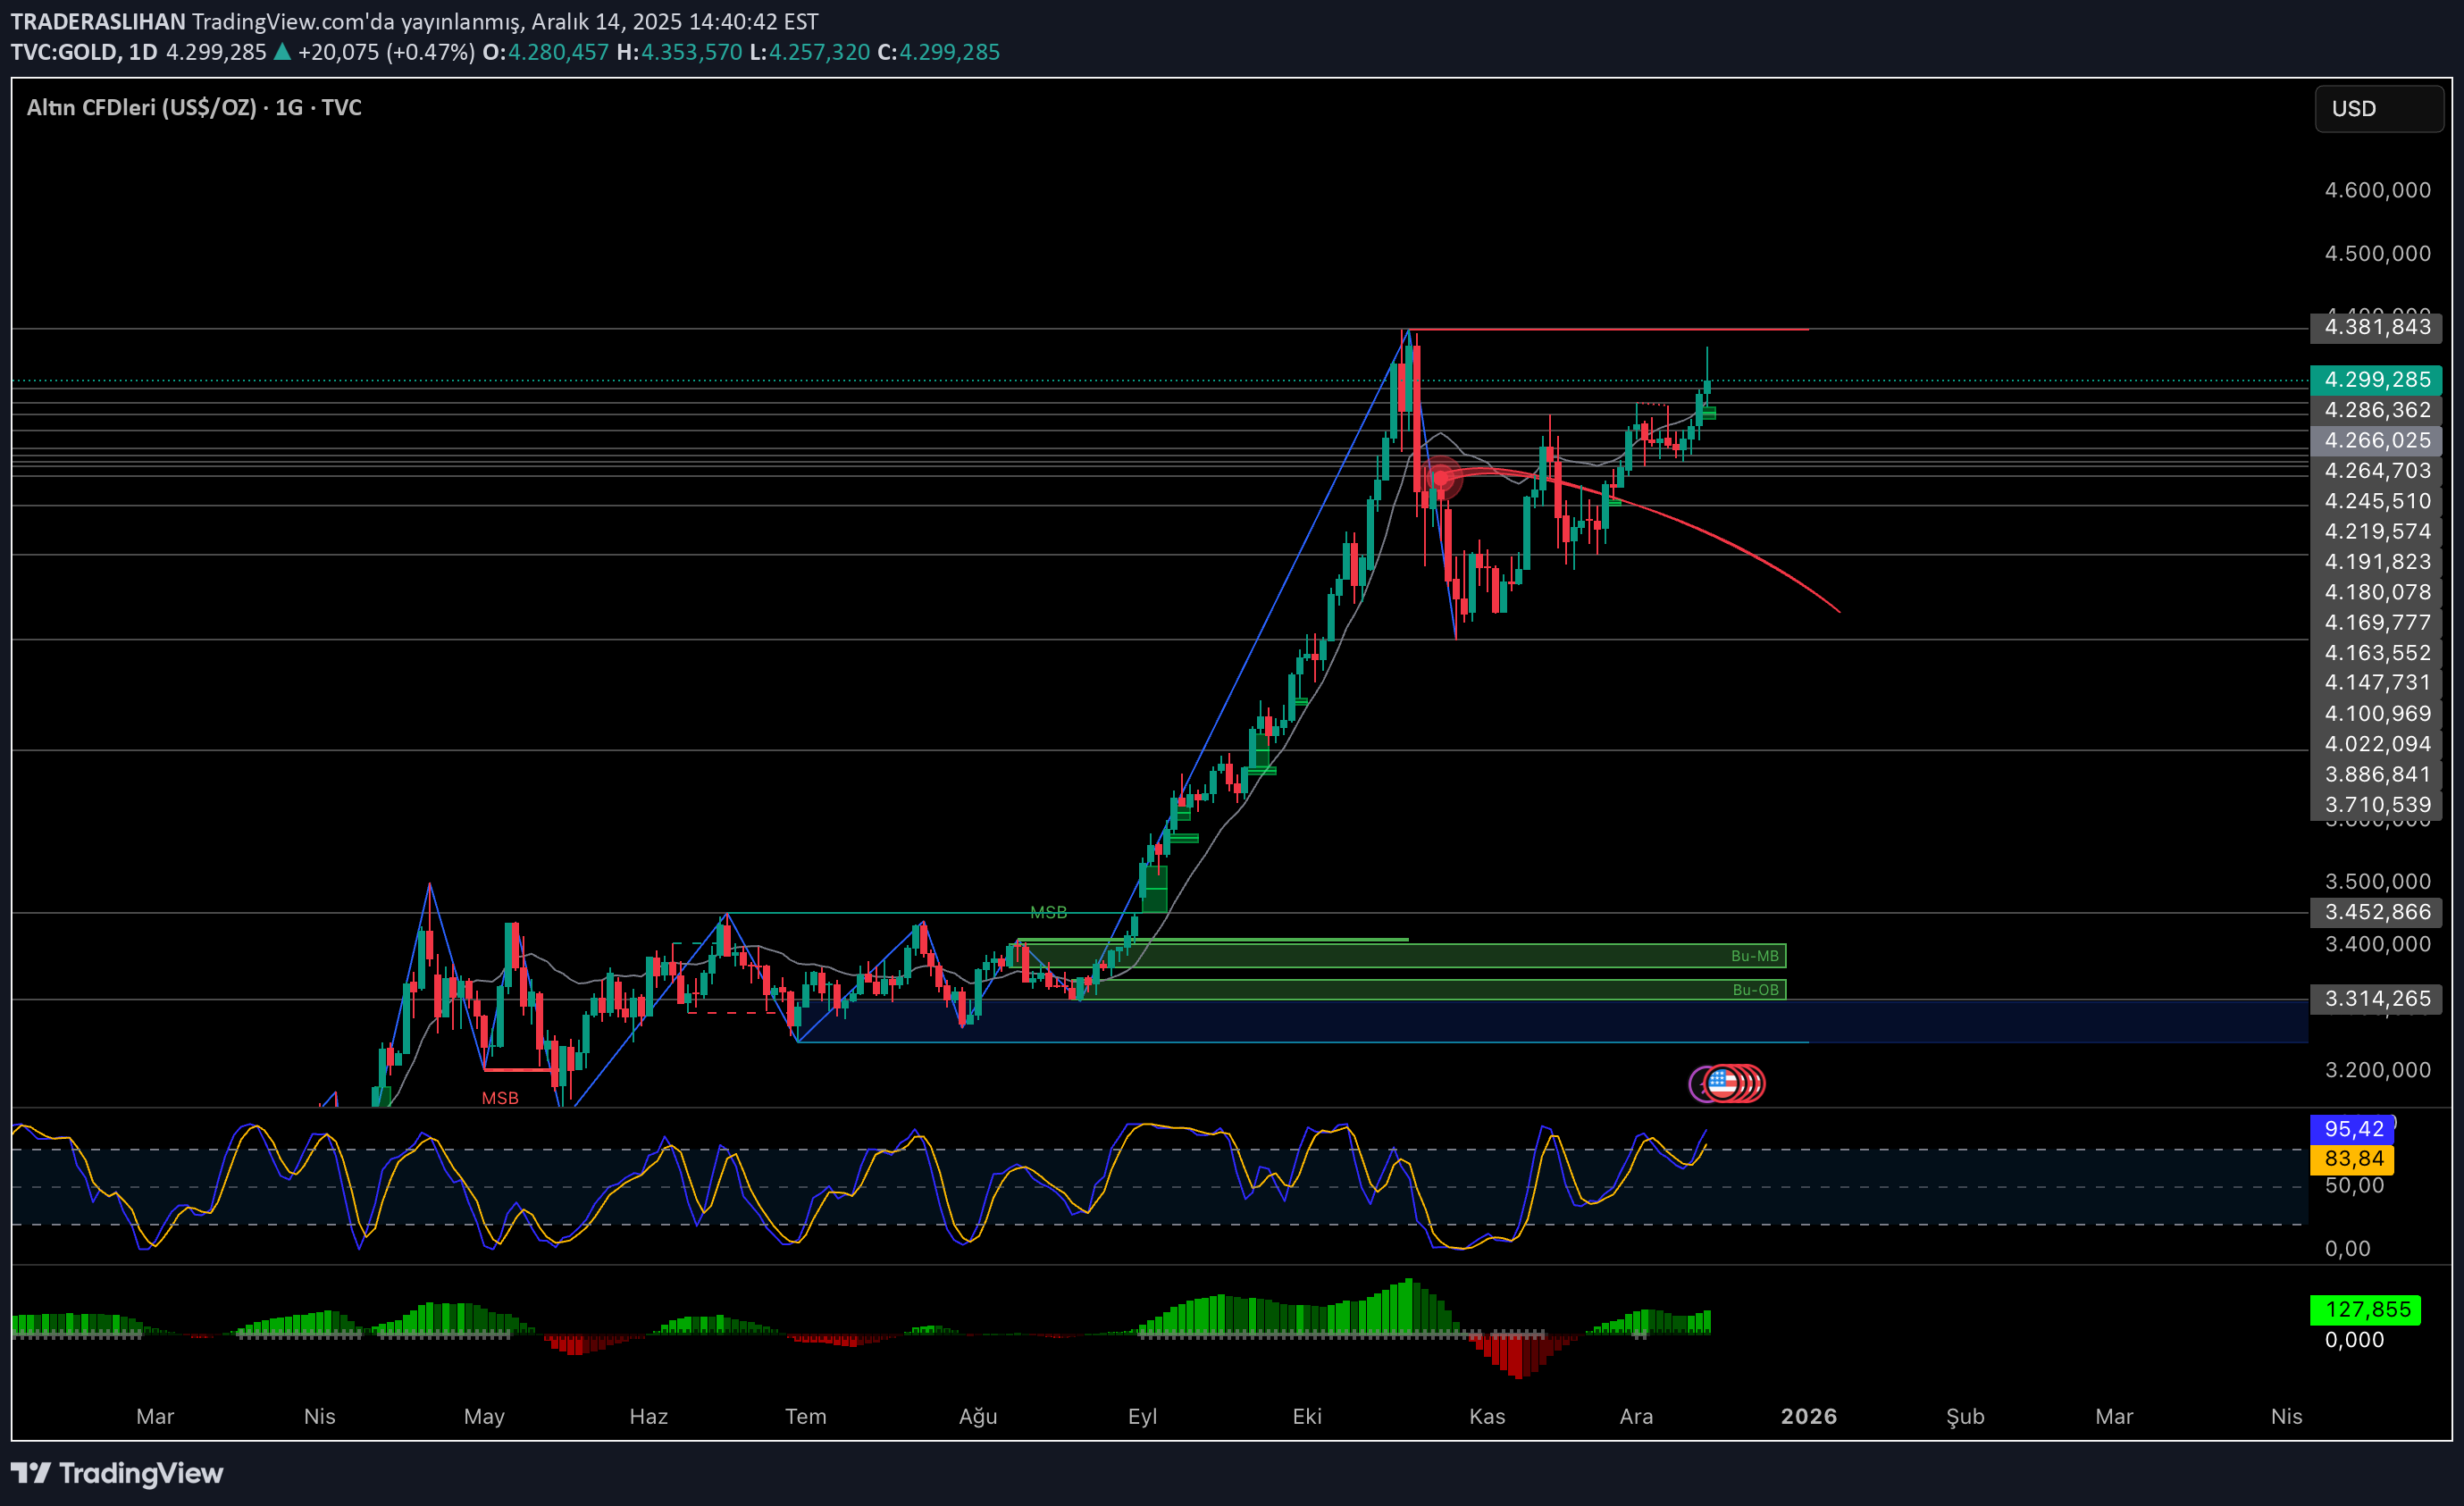
#GOLD main trend continues up. The price is holding in the 4,299 region and momentum is still maintained on the chart. 👑The 4.381 level above is a clear resistance, I am cautiously watching the upward movements before this region is exceeded. 💎If it persists above 4.381, a new acceleration towards the 4.400 band can be discussed. Below, the 4.286–4.264 range acts as the first support zone, and below this area, the 4.245 and 4.219 levels act as balance points. ☕️There is no structure that disrupts the main trend, possible retreats are currently read as intra-trend correction. ➕On the chart, the price is in a compression process after a strong rise and its direction depends on the reaction from the critical resistance area. IT IS NOT INVESTMENT ADVICE.
TRADERASLIHAN
تحلیل بیت کوین: سطوح کلیدی قیمت و مسیر حرکت بعدی BTCUSD
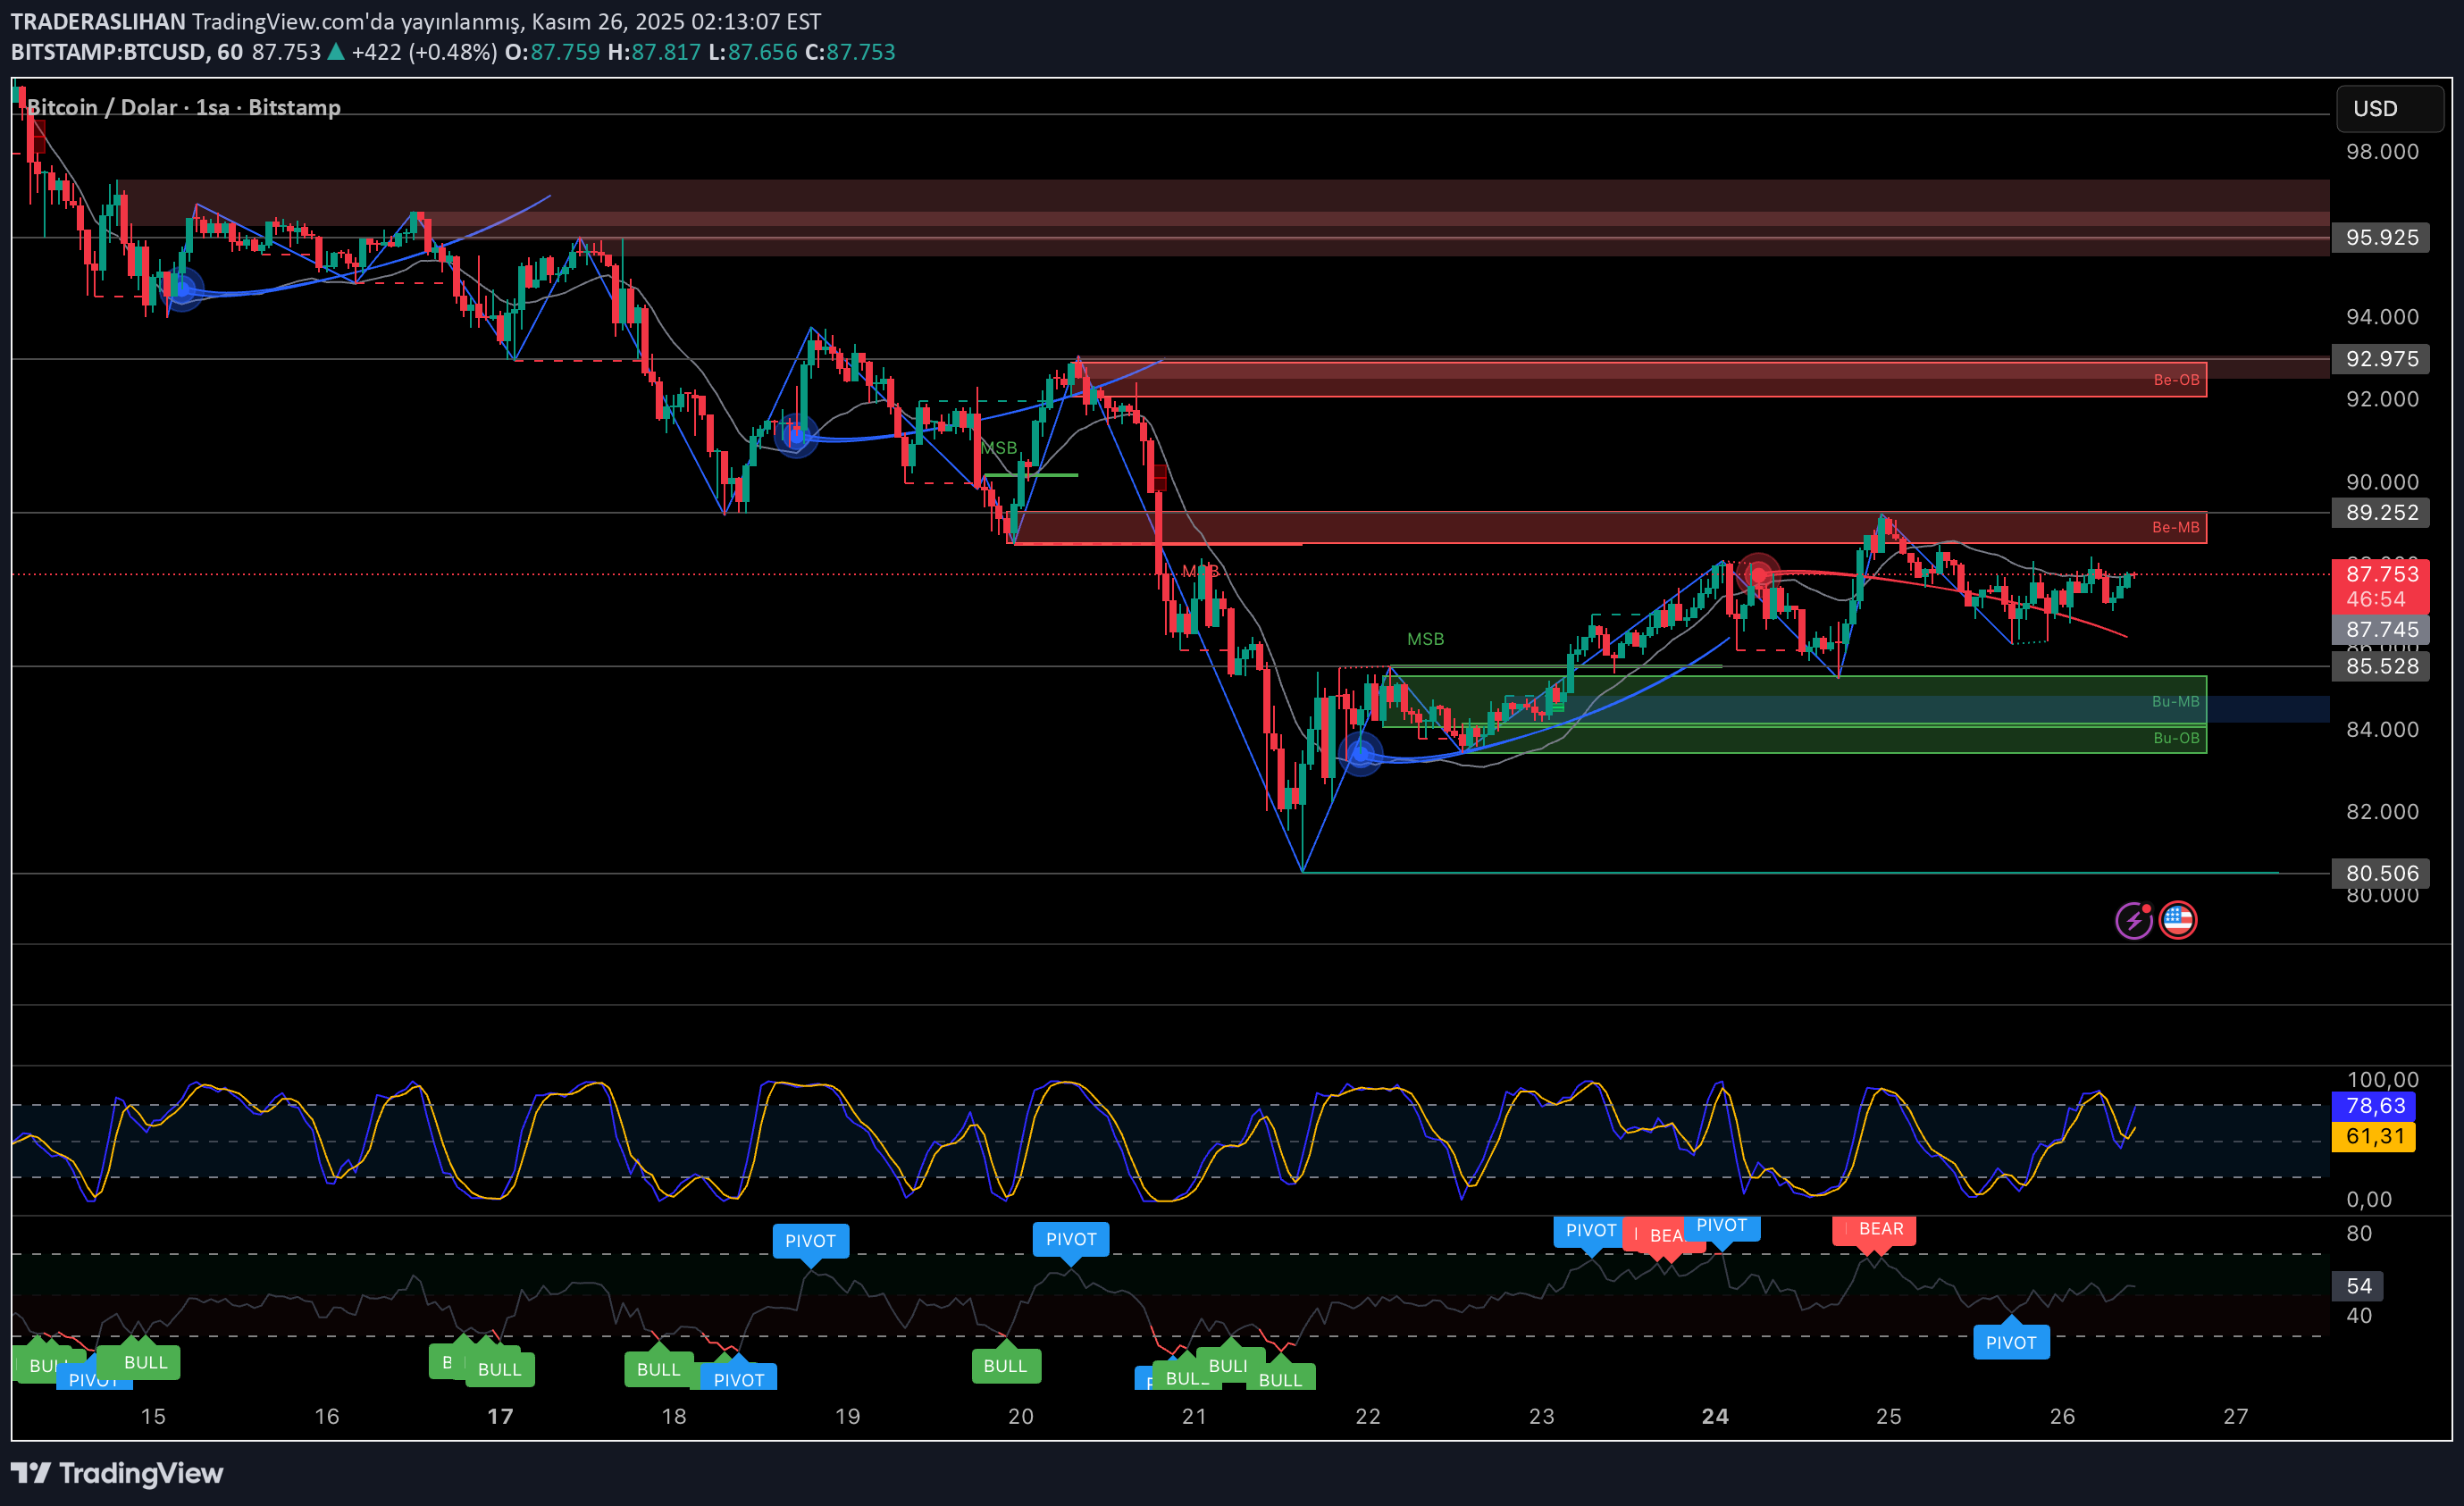
#Bitcoin again received a harsh reaction from the strong selling block between 89.25 – 92.97. Unless this zone is broken, upward movements remain only corrections. The area holding the price below is the demand blocks between 85.50 – 84.60. As long as the price remains above this area, buying reactions come from below. For me the direction is clear: 🪟As long as the price remains below 89.25 🎯 86.00 🎯 85.50 🎯 84.60 I expect another targeted withdrawal. 👉 Closing above 89.25 Thereupon the movement accelerates and 🎯 92.97 – 95.92 band is tested again. Levels are clear, OBs are working strongly. The direction will be determined by the breakdowns. IT IS NOT INVESTMENT ADVICE IN ANY WAY.
TRADERASLIHAN
تحلیل طلا: آیا ریزش ادامه دارد؟ سطوح کلیدی برای نوسانگیری امروز
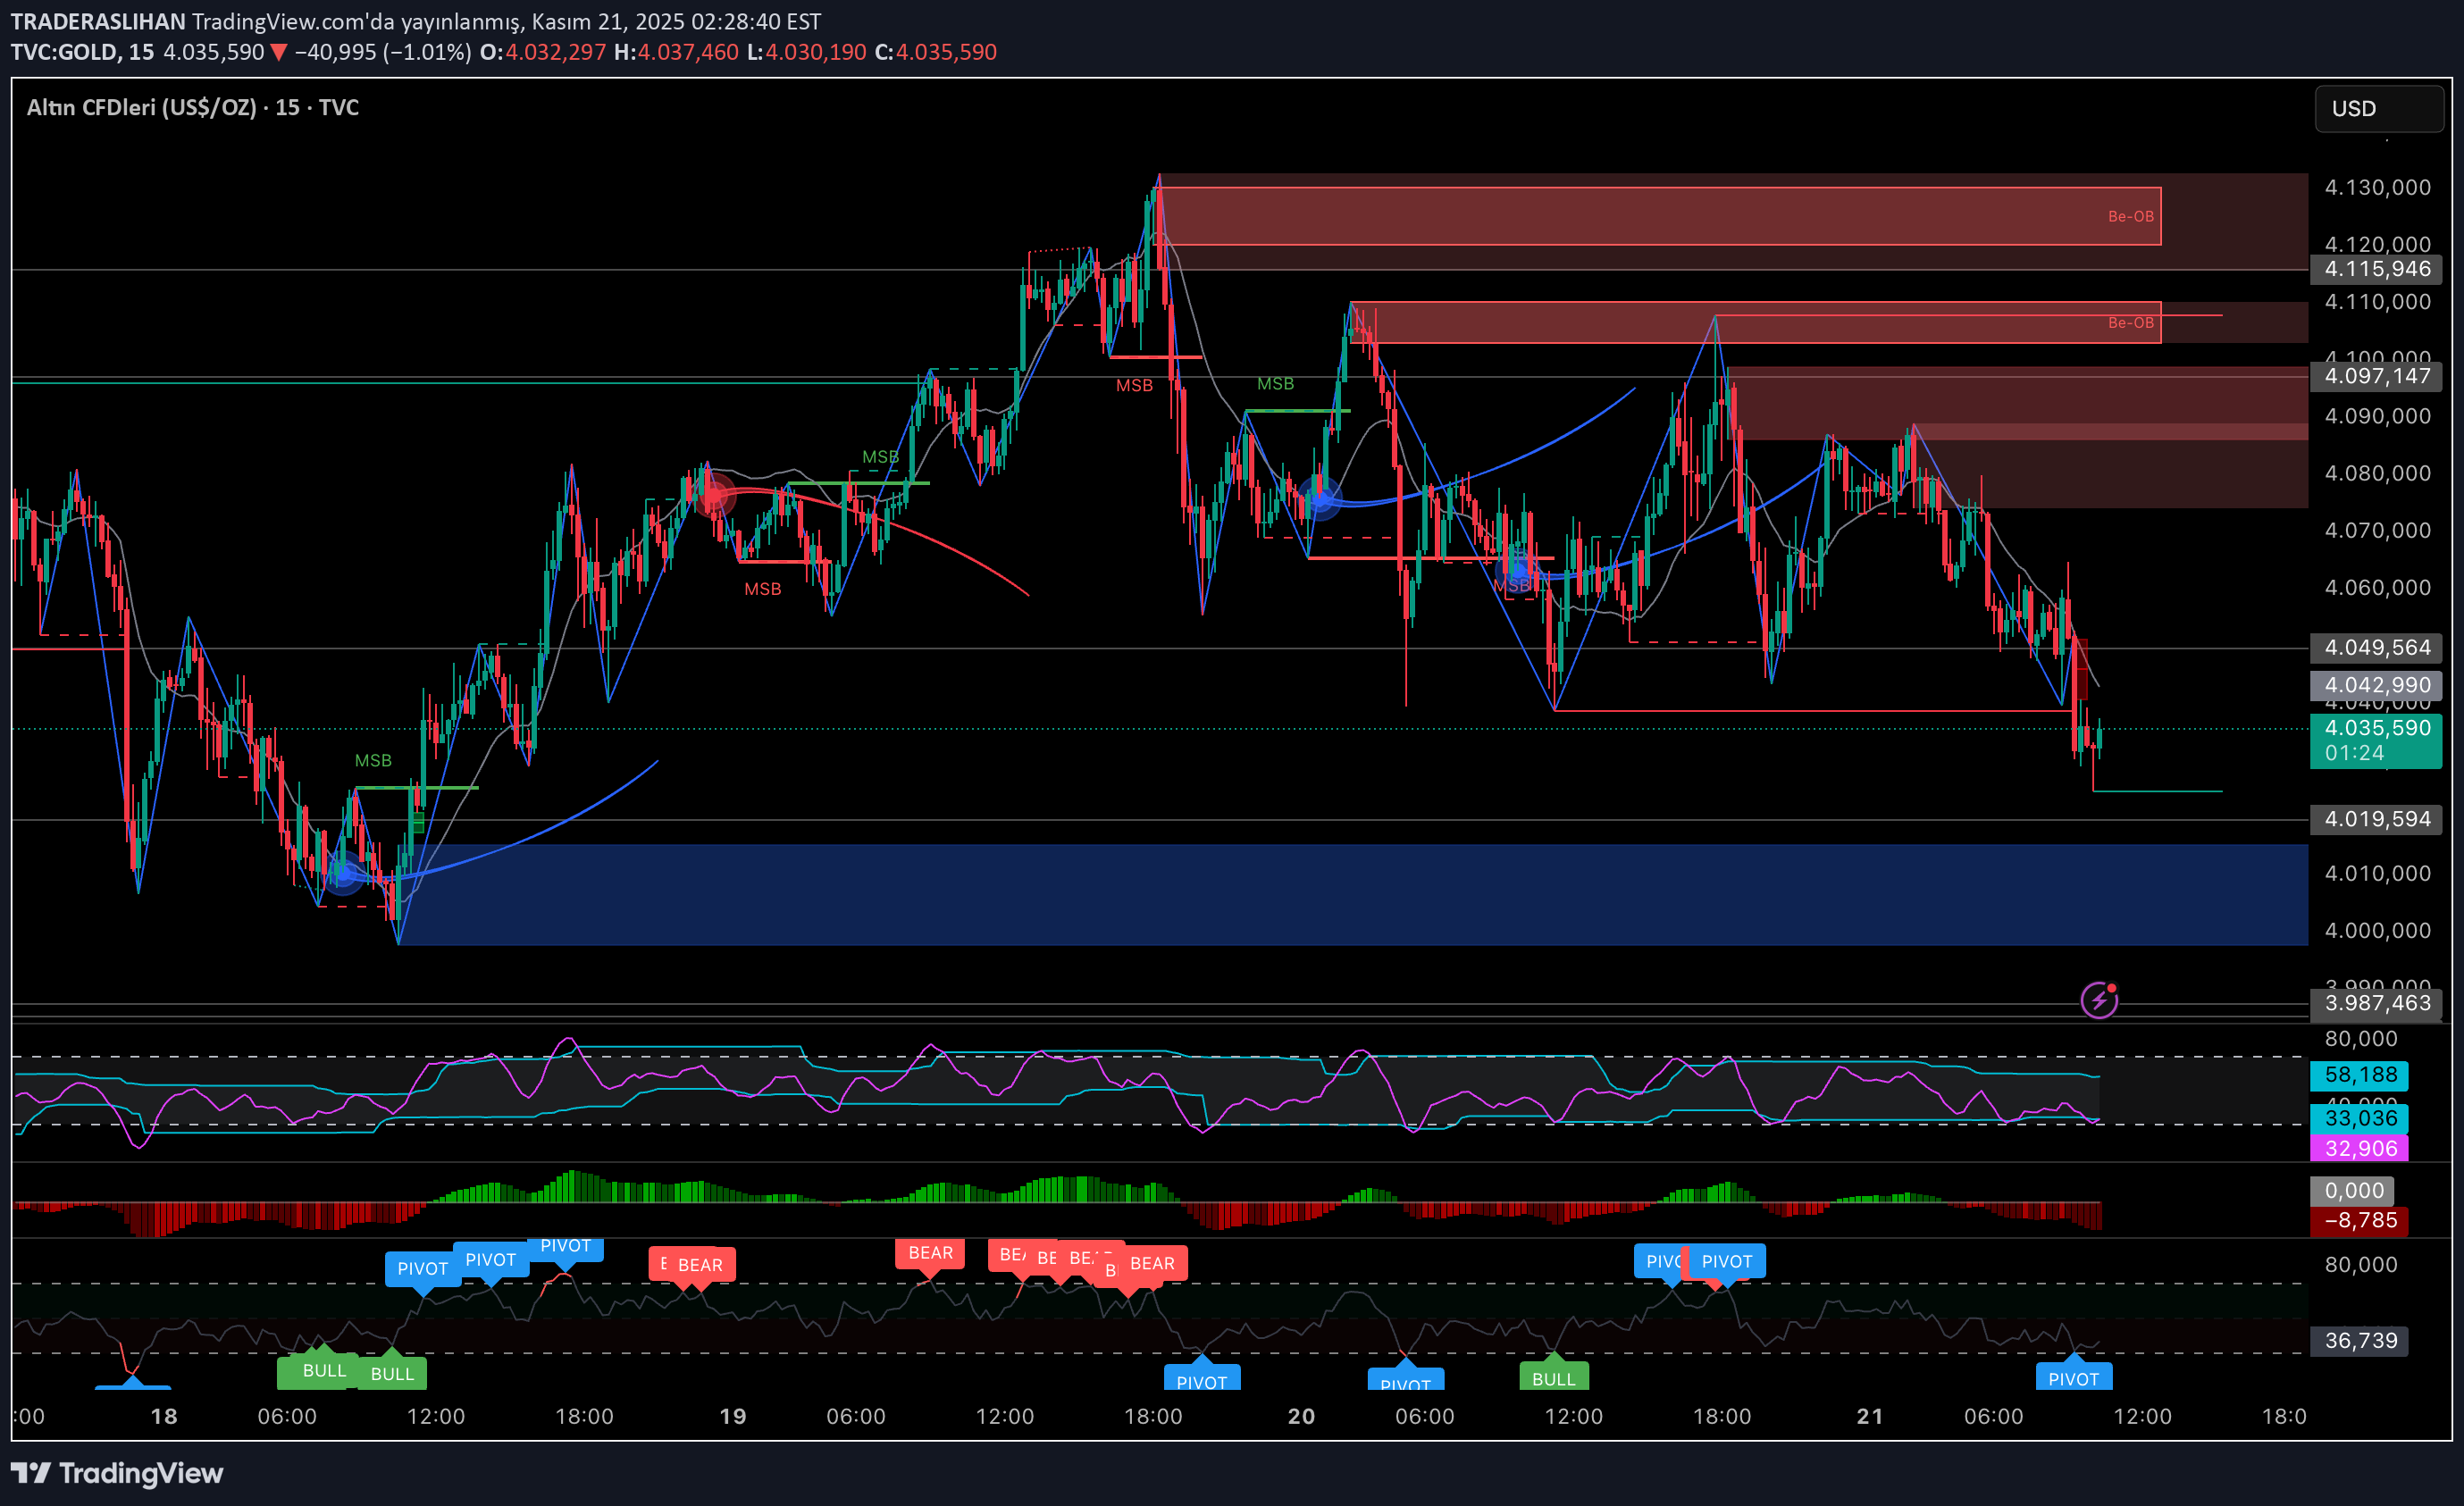
#GOLD Price has retreated to the 4,042 region and is trying to get a small reaction here. This area is already a micro liquidity zone compatible with previous bottoms. However, the Ministry of National Defense has not yet arrived to strengthen the reaction. 🍭The first upward critical level is the range 4.049 – 4.055. This is both the retest of the last broken structure and the alt band of the micro bearish OB. Unless this zone is tested and there is a 1 candle close on it, the rises will remain only as a reaction. ❤️The 4,070 – 4,090 range above is a strong seller area. The price sells hard every time it touches these areas. Especially unless there is a close above 4,097, the main direction is still down. 🎩The first support below is the 4.019 – 4.010 wide OB zone. If the price drops here, there is a possibility of a stronger buyer reaction. There is 3.987 major bottom support below this region. – Short-term direction is down. – Reaction increases are weak, selling pressure continues in OBs. – A candle close above 4,055 is required for an increase. – 4,019 regions are followed below. IT IS NOT INVESTMENT ADVICE IN ANY WAY.
TRADERASLIHAN
تحلیل بیت کوین: قیمت در چه محدودههایی گیر کرده و مقاومت اصلی کجاست؟
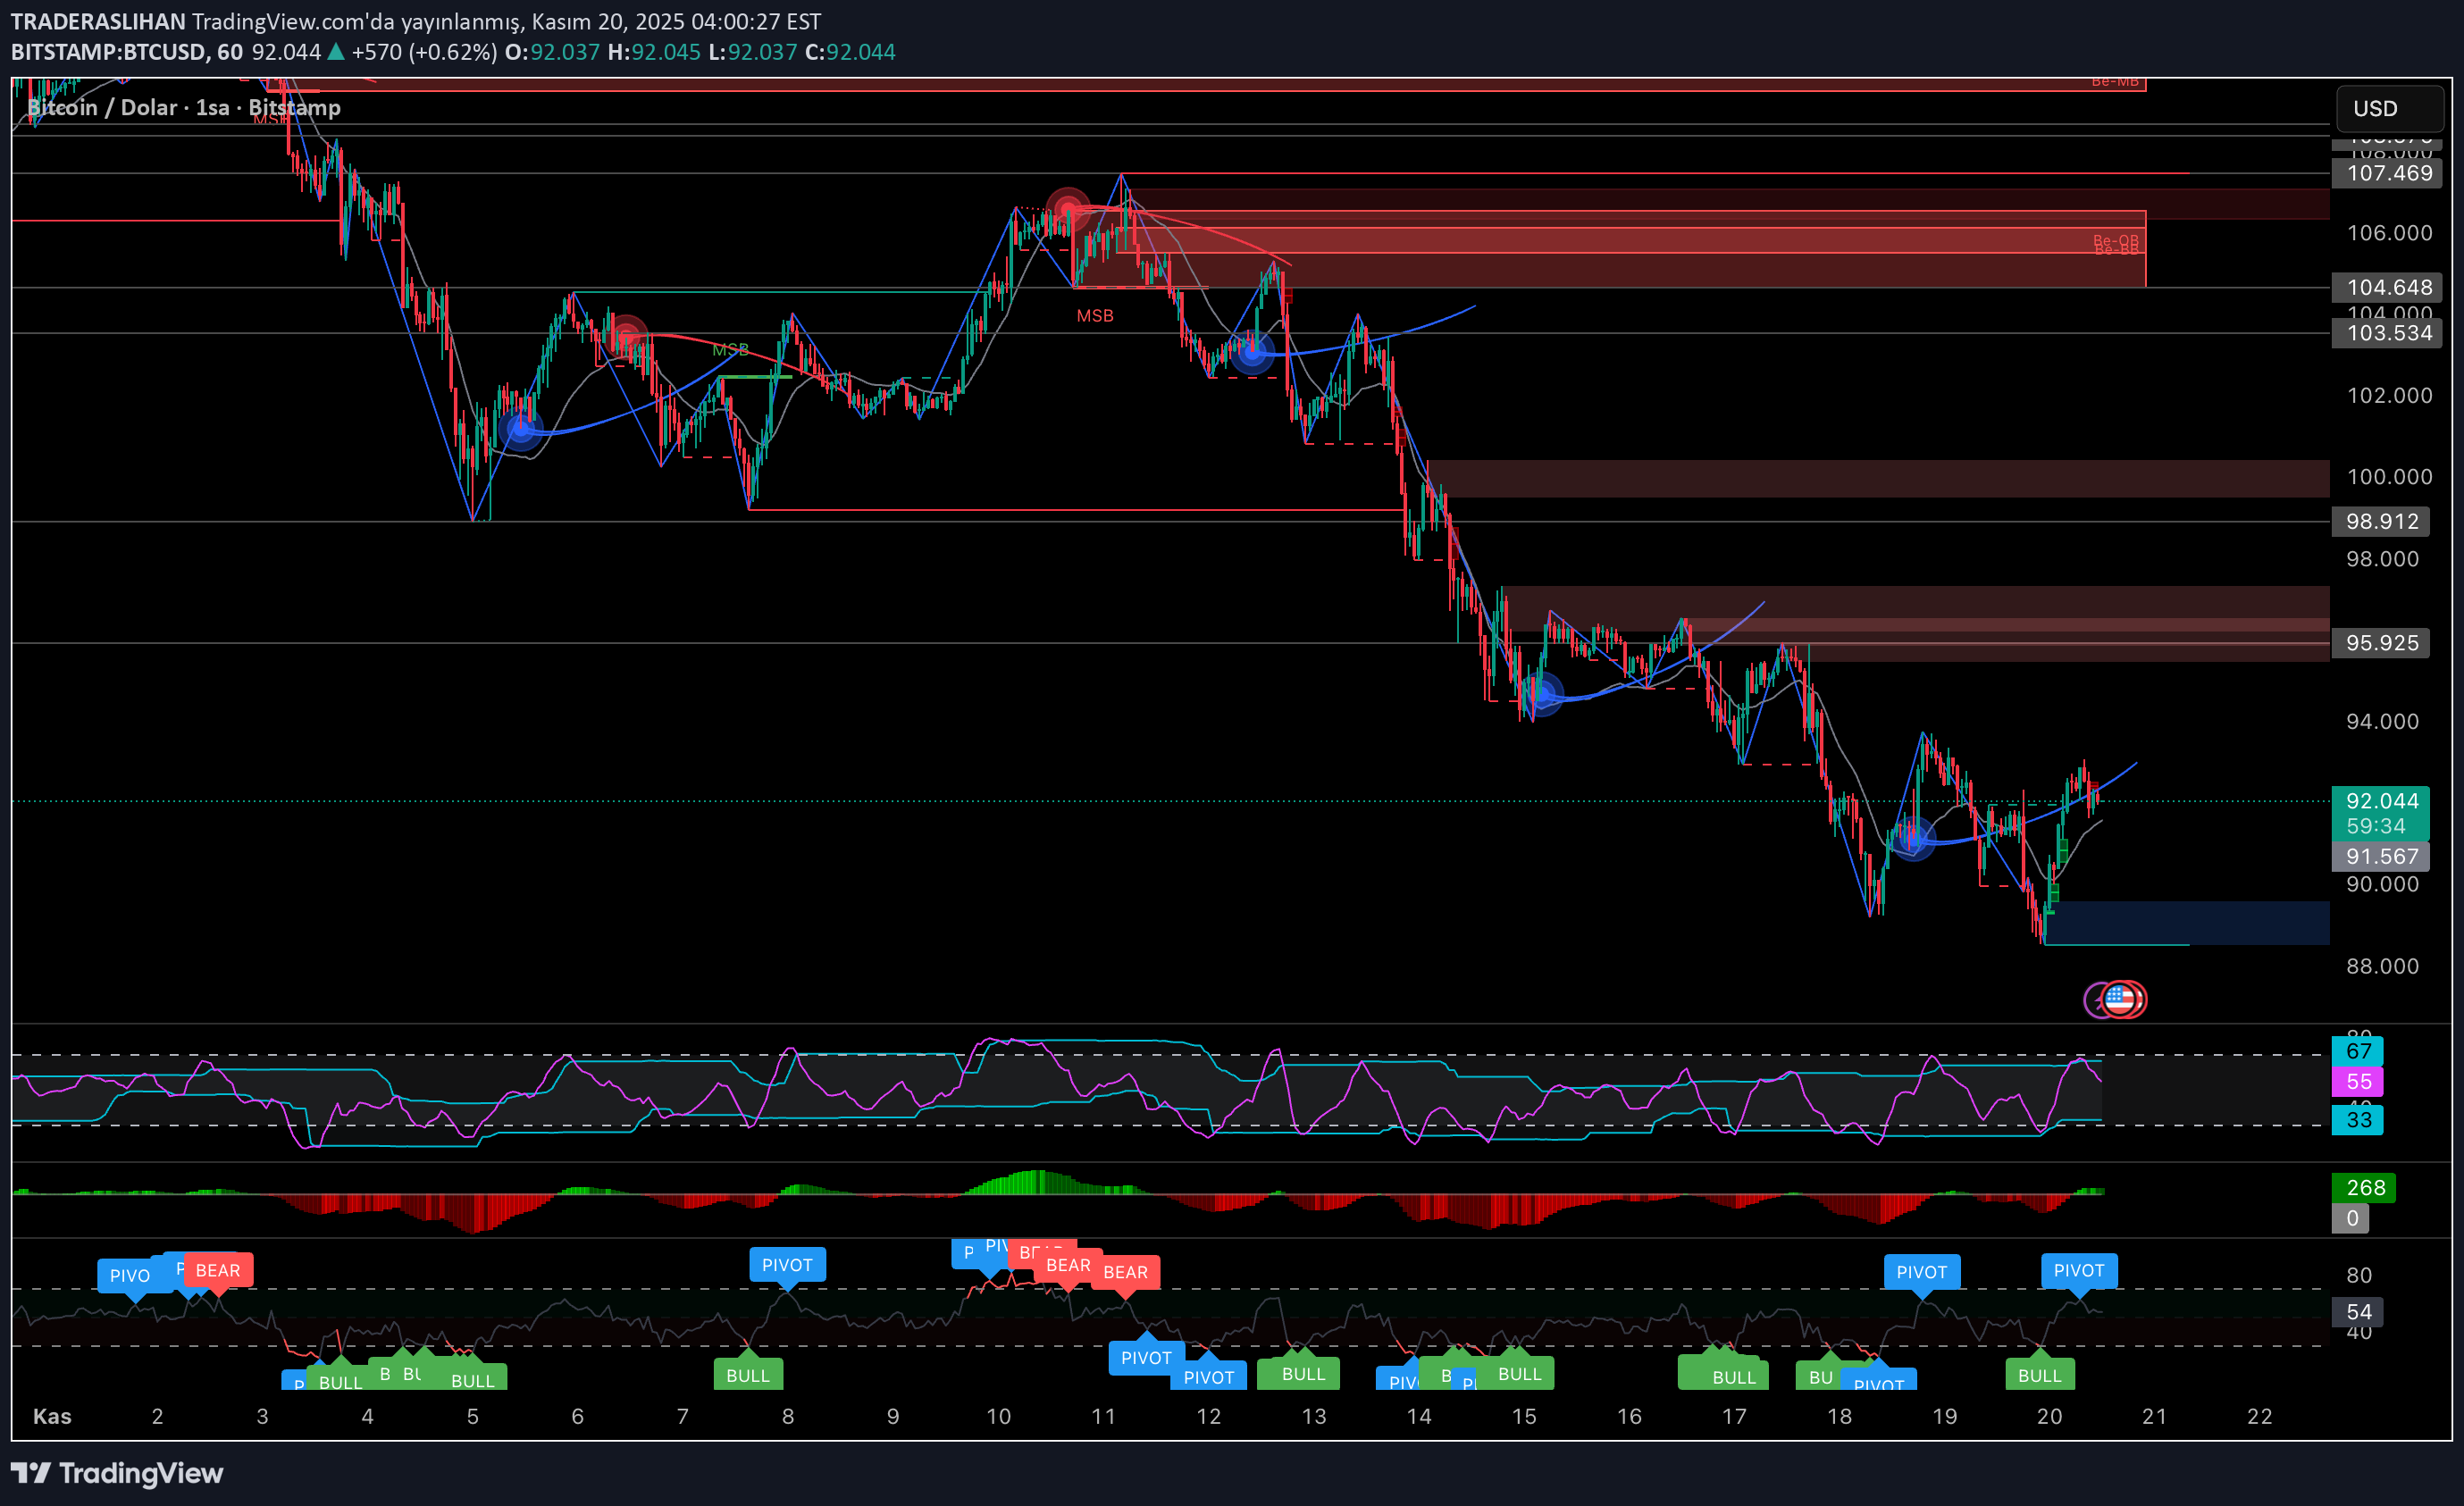
On the #Bitcoin side, the price has received a strong reaction from the liquidity zone in the 88,000 – 90,000 band for a while. This area was already the main demand area to which we had returned several times before, and it was no surprise that it worked again. 🎩Currently the price is stuck between 91,500 – 92,000. This band works as the first local resistance. As long as it is not attacked, the rise in reaction may remain limited. 🕯The range between 95,000 – 95,900 above is the most critical bearish OB region. I do not expect a strong trend reversal without a clear breakout as the price constantly sells when it touches this zone. Short term resistance between 92.800 – 93.500 95,000 – 95,900 main sales area above If these areas are broken, 98,000 will be on the agenda again. 🫐90,000 – 88,500 liquidity zone If it lands in this area again, I expect the buyers to be active again. IT IS NOT INVESTMENT ADVICE IN ANY WAY.
TRADERASLIHAN
تحلیل طلای امروز: آیا سقوط ادامه دارد؟ سطوح حیاتی 4020 و 4075 را از دست ندهید!
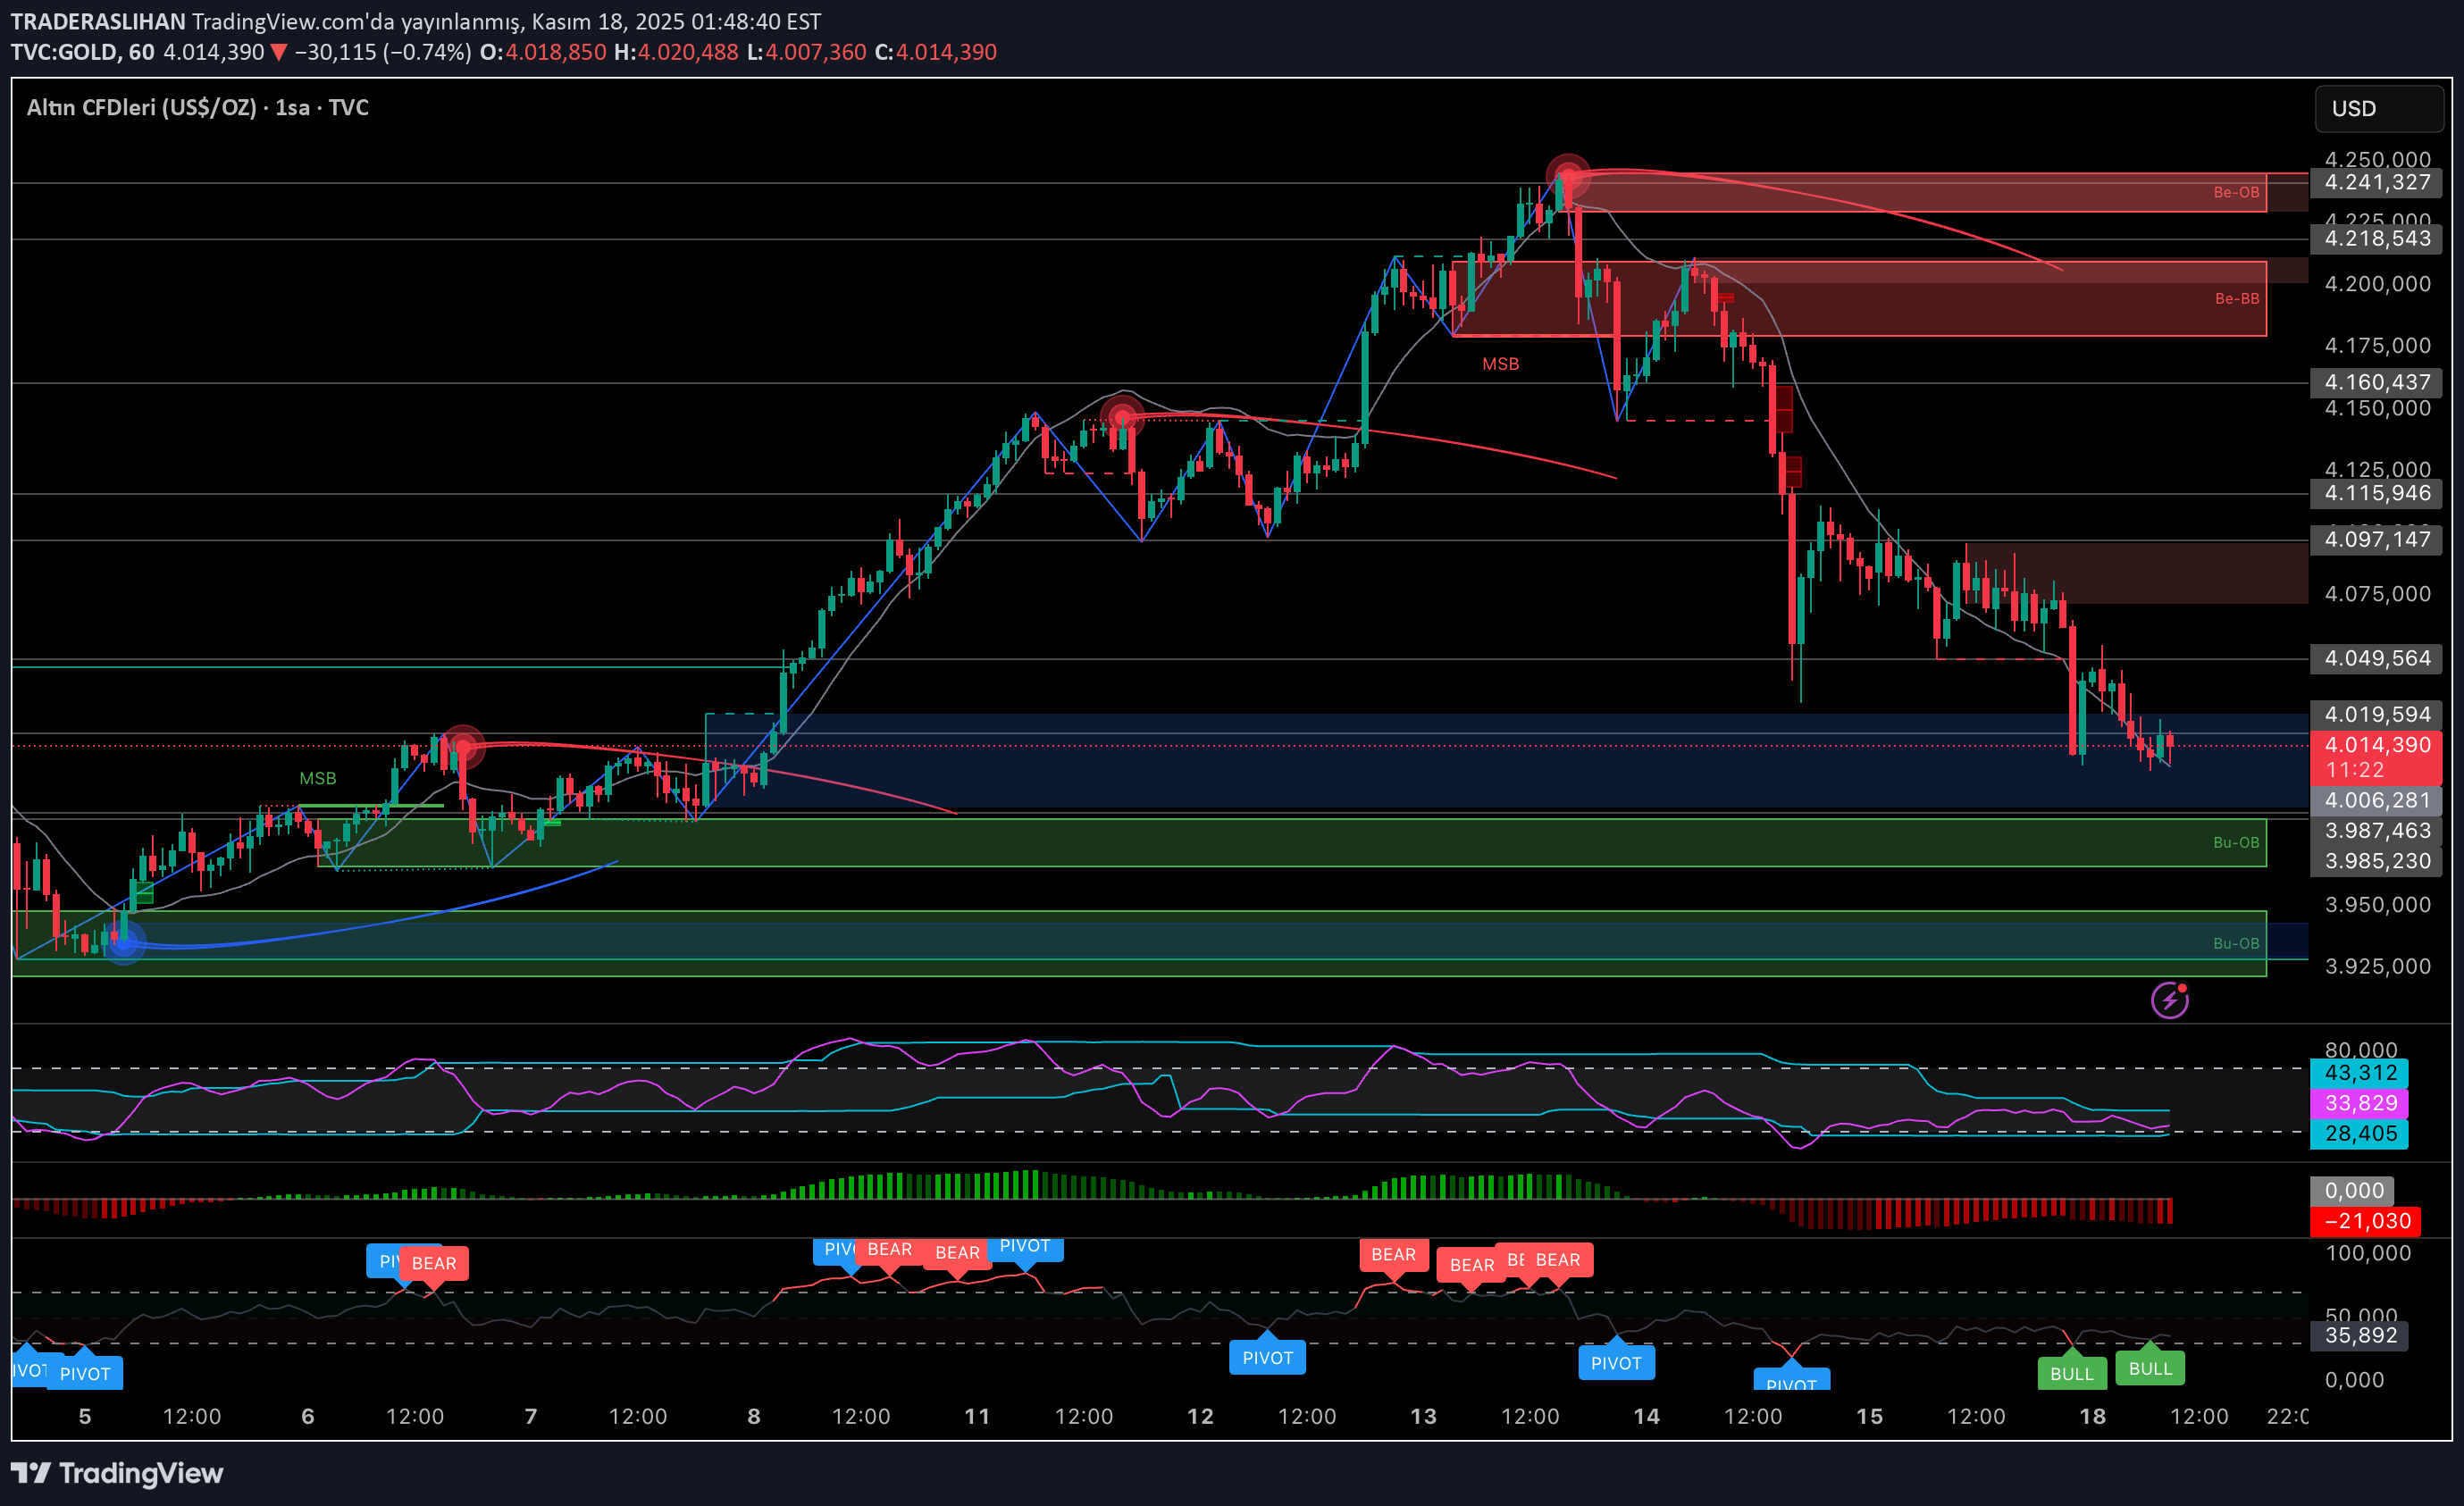
#GOLD decline structure continues to work step by step. All red OB zones coming from the top push the price down hard with every contact. Currently, the price is trying to hold on exactly within the 4,020 – 🛷4,000 support band, but the outlook is still weak. As long as it doesn't break above 4.075, an upward move would only be a reaction for me, not a trend reversal. ☕️The 4.115 – 4.160 band at the top is still the intense selling area and every time the price goes there, aggressive selling pressure comes. ❤️There is a clear liquidity gap below that, if broken, will quickly take us to the 3.987 – 3.950 band. If this area cannot be taken, up to 3,925 doors will be opened. 😱The structure below is still down. The decline will continue as long as it remains below 4.020, and above, the trend cannot turn to the positive side until 4.075 is exceeded. IT IS NOT INVESTMENT ADVICE IN ANY WAY.
Disclaimer
Any content and materials included in Sahmeto's website and official communication channels are a compilation of personal opinions and analyses and are not binding. They do not constitute any recommendation for buying, selling, entering or exiting the stock market and cryptocurrency market. Also, all news and analyses included in the website and channels are merely republished information from official and unofficial domestic and foreign sources, and it is obvious that users of the said content are responsible for following up and ensuring the authenticity and accuracy of the materials. Therefore, while disclaiming responsibility, it is declared that the responsibility for any decision-making, action, and potential profit and loss in the capital market and cryptocurrency market lies with the trader.