
Soon-trader
@t_Soon-trader

What symbols does the trader recommend buying?
Purchase History
پیام های تریدر
Filter
Signal Type
Soon-trader
Signs of economic recession from Europe and Asia have increased demand for safe-haven assets like gold. The EMA 34 and EMA 89 are supporting gold prices. If prices hold above these EMAs, the uptrend will continue. Prices are fluctuating around the Bollinger Band average, indicating slight short-term volatility. If gold prices break the resistance at $2,420/oz and hold above this level, they may continue to rise in the short term.
Soon-trader
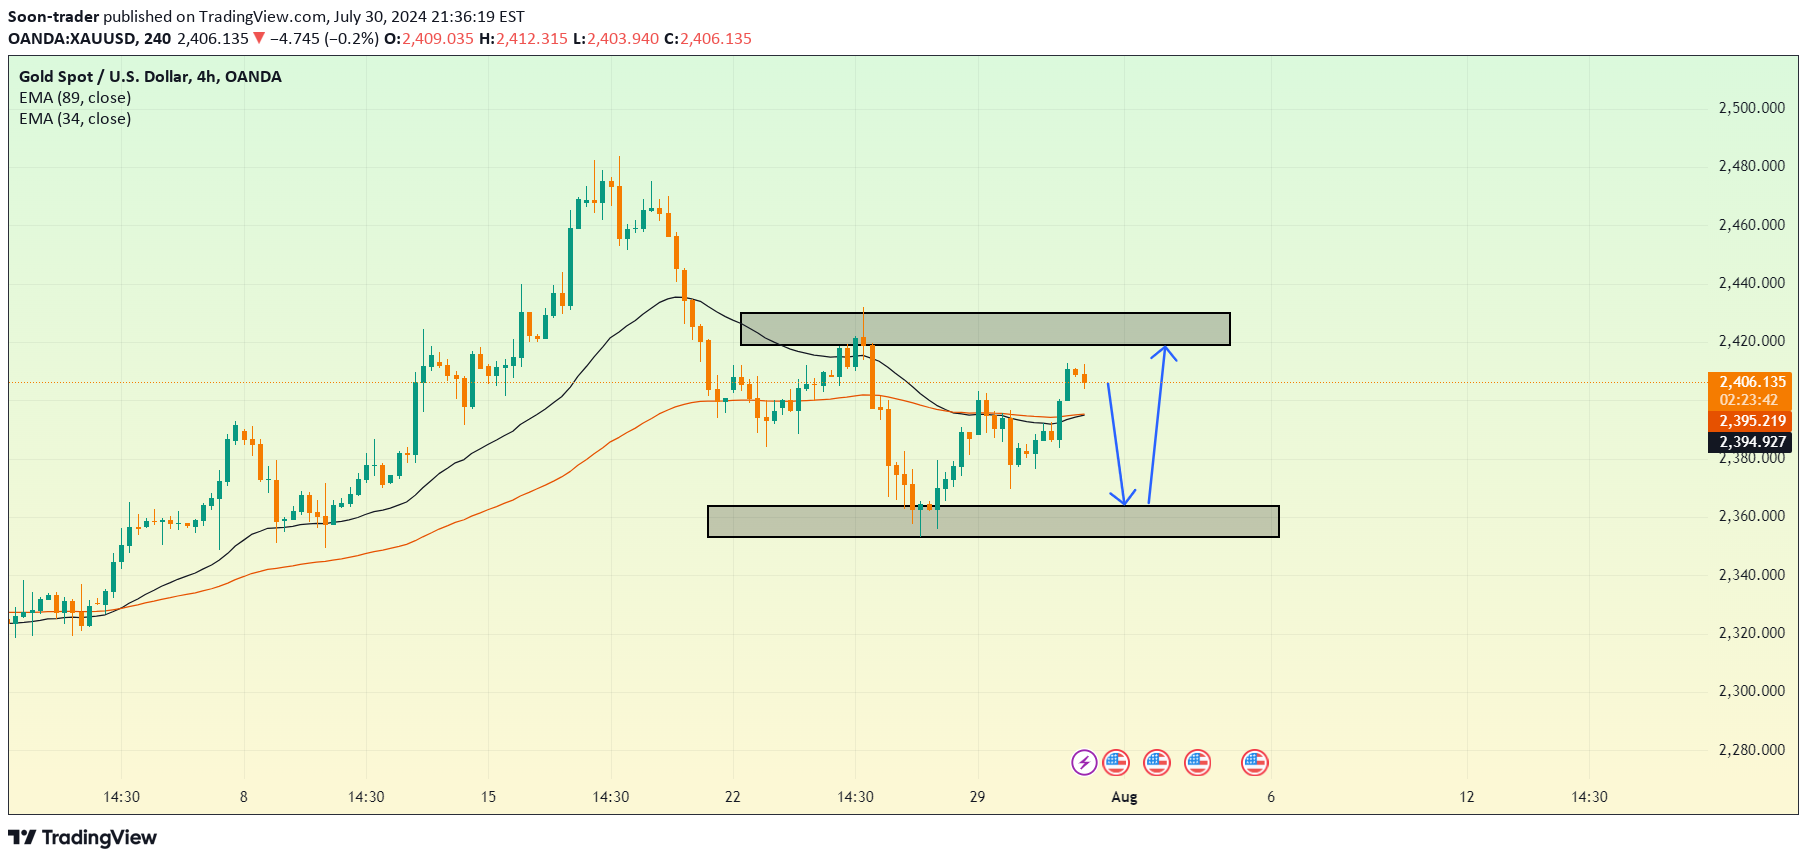
Currently, gold prices are fluctuating within a narrow range. The current price is below both EMA lines, indicating that the downtrend is still in effect. A reversal candlestick pattern has appeared near the resistance level, suggesting that prices might decline again. If the price cannot break through the resistance level and strong bearish signals appear, gold prices may return to the support level of 2,360.000 or even lower if selling pressure increases.
Soon-trader
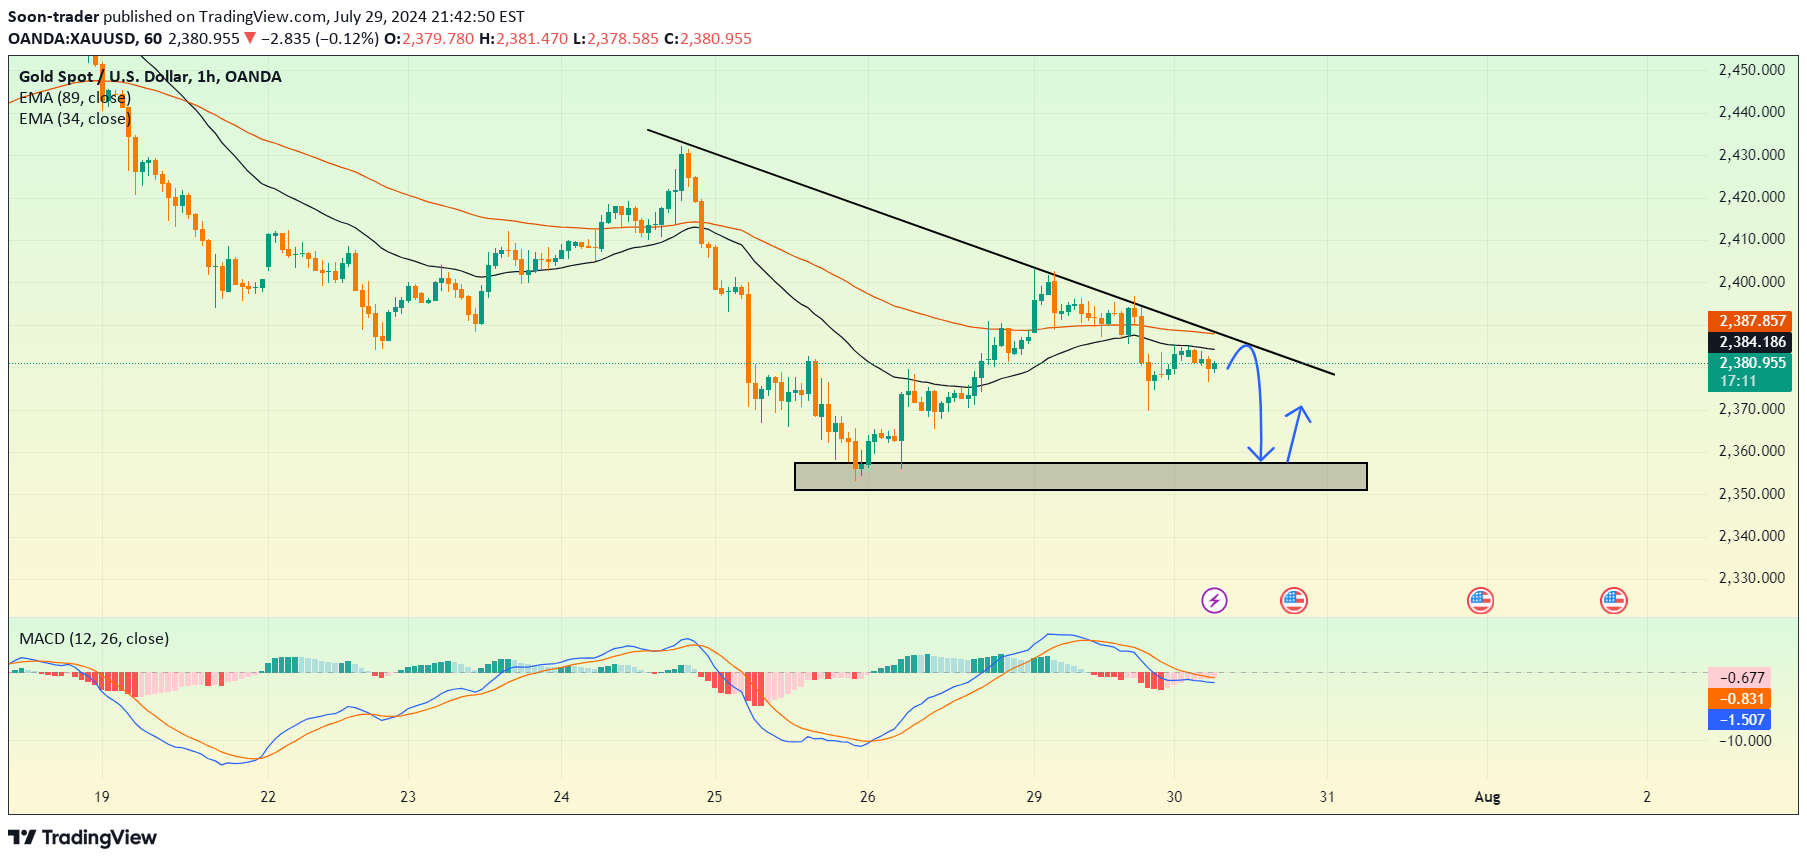
Key economic data from the US, such as unemployment rates and GDP, are about to be released. This information will directly affect the USD and consequently the price of gold. On the 1-hour chart, XAUUSD is moving in a short-term downtrend. The current price is below the 20, 34, and 89 EMA lines, indicating that the downtrend remains dominant. The MACD indicator is showing a bearish signal with the MACD line below the signal line, indicating strong selling pressure. XAUUSD is likely to continue its decline towards strong support levels and then see a slight recovery in the short term.
Soon-trader
This morning, gold prices experienced mild fluctuations following the release of new economic data from the United States. The EMA 34 and EMA 89 lines are trending towards a crossover from above, which is a strong sell signal. Currently, there is no clear reversal candlestick pattern, however, if the price continues to decline and forms strong bearish candles, a bearish pattern will be confirmed. It is predicted that gold prices will have a slight recovery up to the resistance zone of 2,424 USD/ounce before continuing a strong downward trend towards the support zone of 2,354 USD/ounce.
Soon-trader
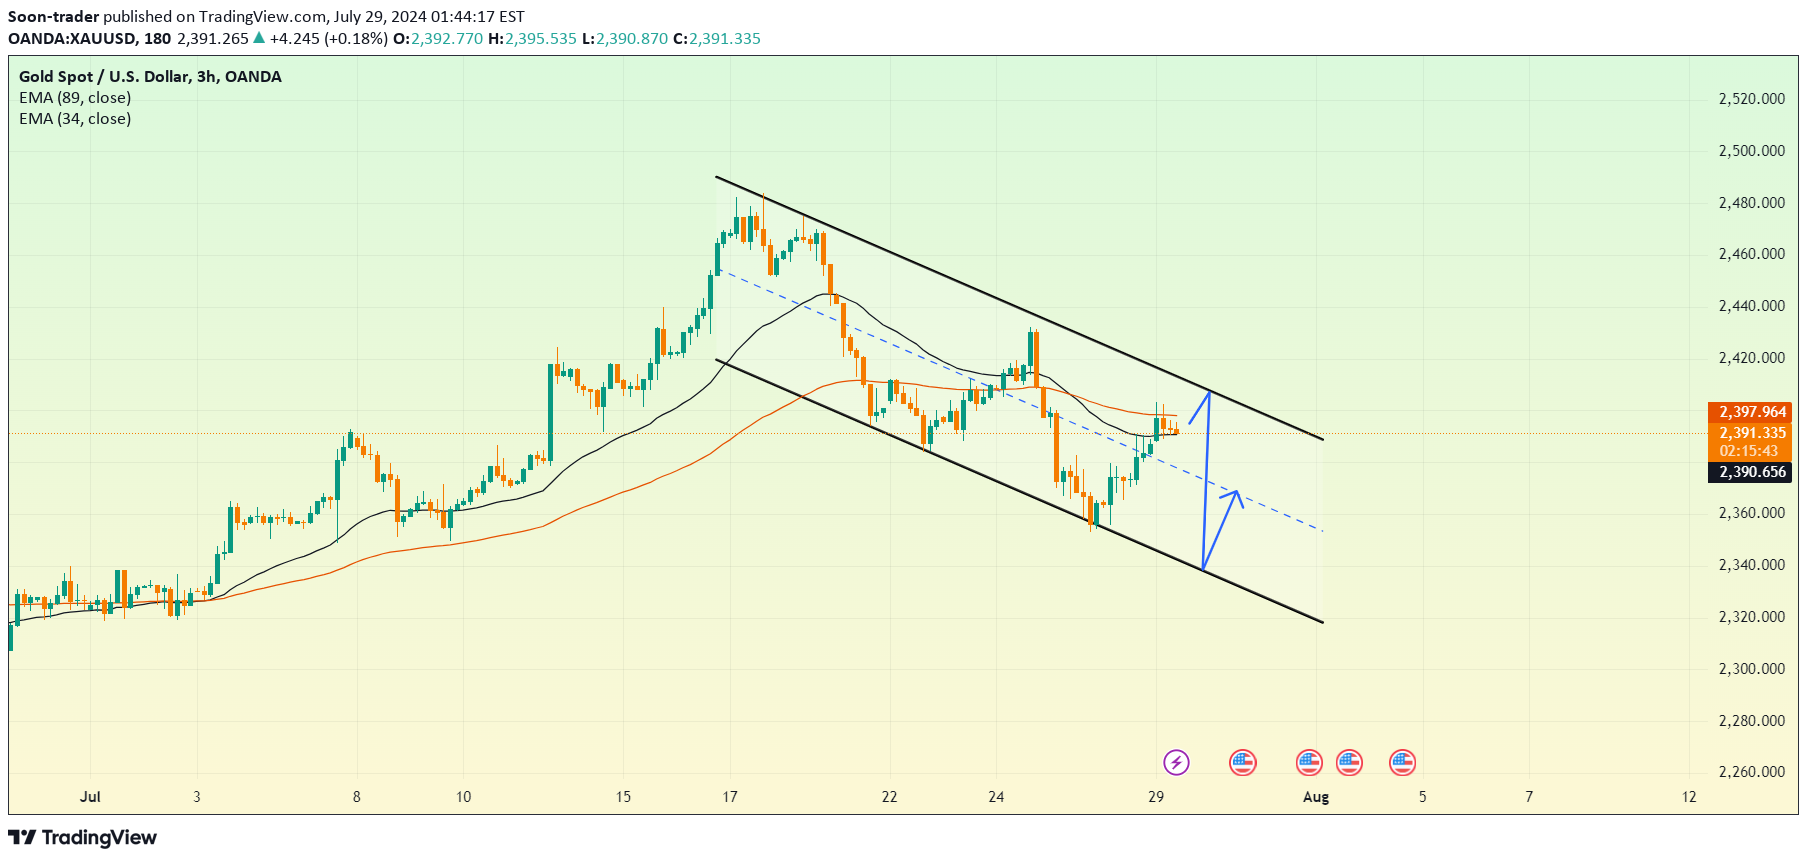
Recent geopolitical tensions in the Middle East and Eastern Europe have increased demand for gold as a safe-haven asset, supporting gold prices in the short term. Currently, the XAUUSD trend is in a correction phase within a descending price channel. The 34 EMA is crossing below the 89 EMA, indicating that the short-term downtrend is still intact. Gold is moving within a descending price channel, with clear resistance and support levels. Gold prices are likely to continue rising to retest the upper resistance of the descending channel. If the price surpasses this resistance level, a stronger rally can be expected.
Soon-trader
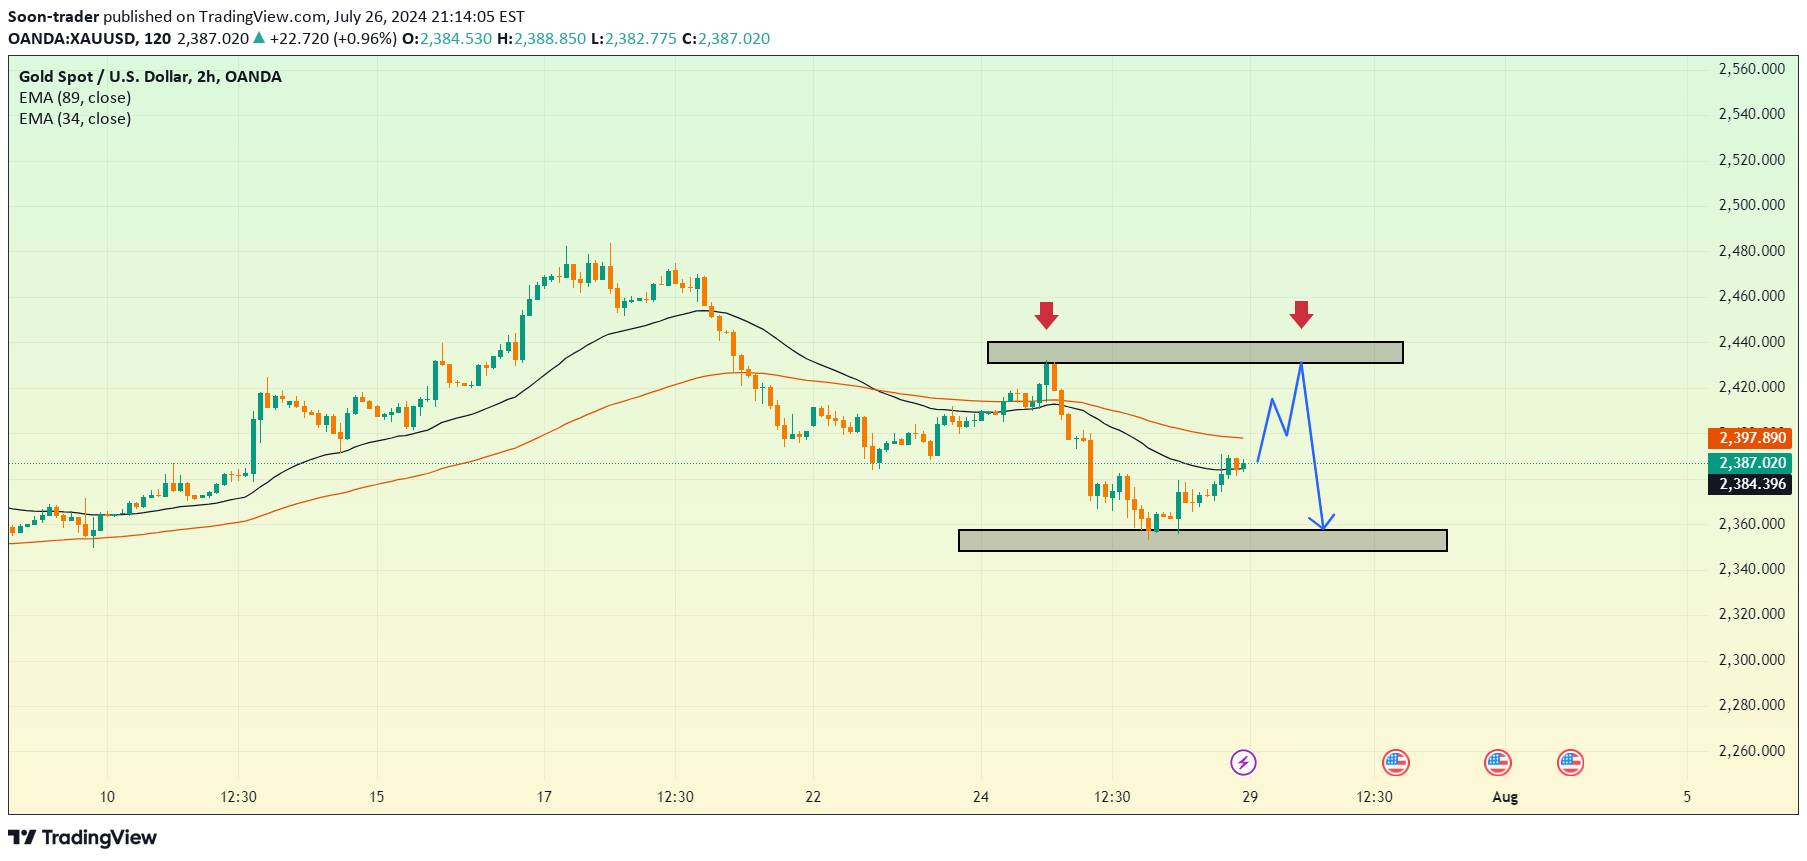
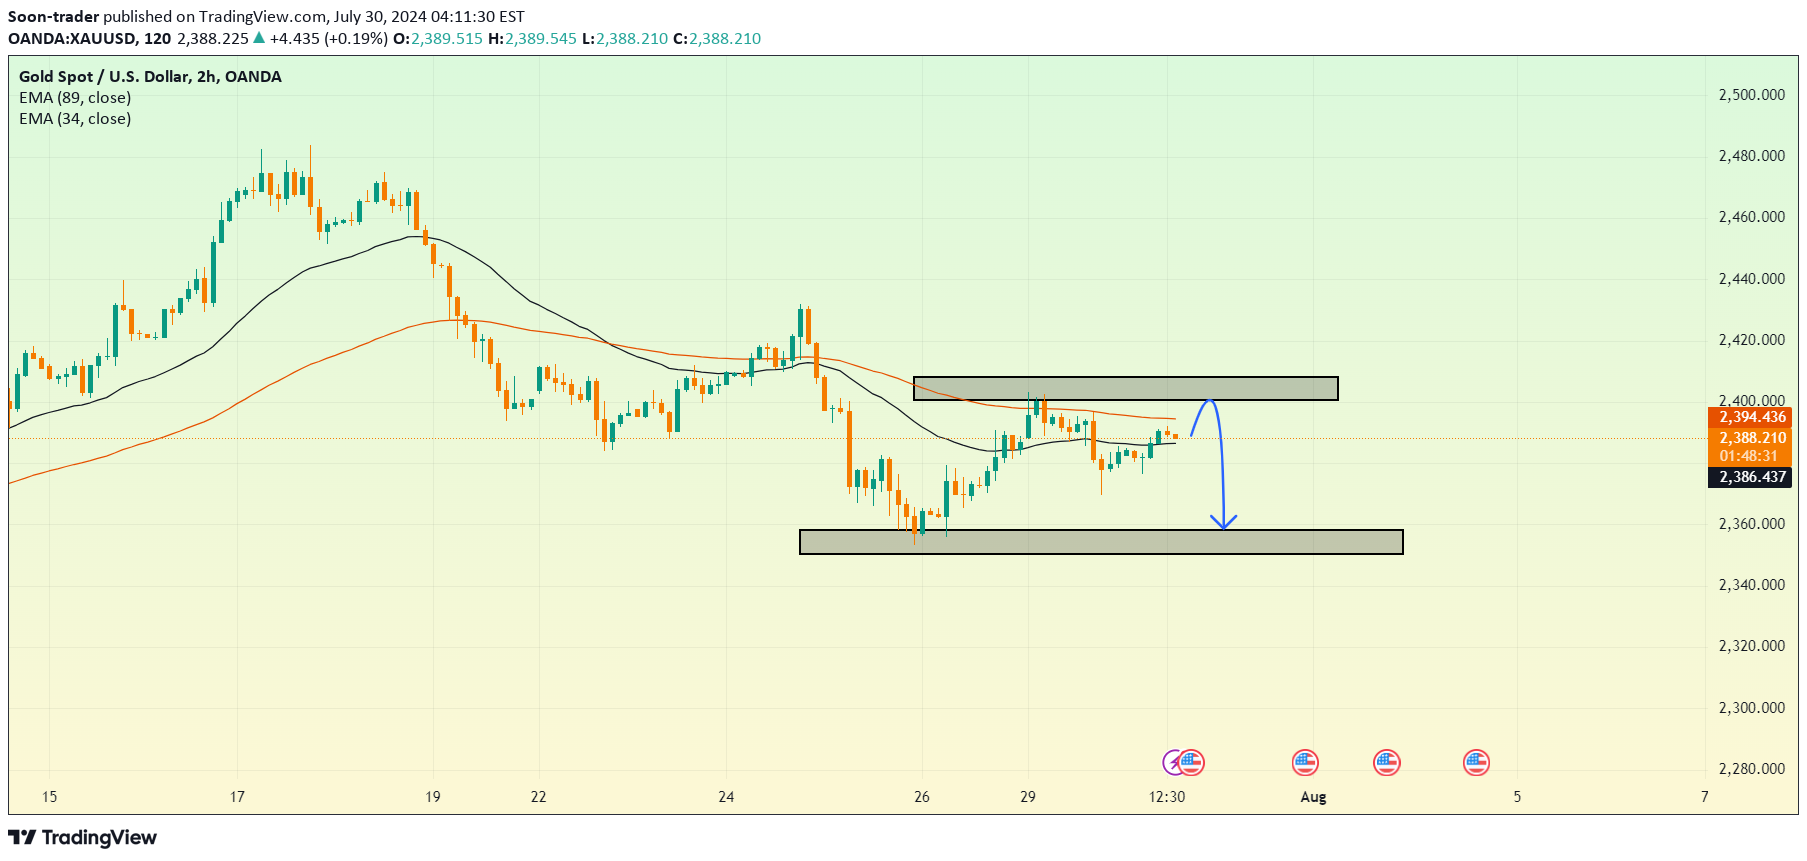
Currently, XAUUSD is trading around 2,387.020 USD. The price is near the 34 EMA and below the 89 EMA, indicating a short-term downtrend. The price is approaching the middle band of the Bollinger Bands, suggesting accumulation and high volatility in the near future. In the short term, if resistance is not broken, the price may correct further and test lower support levels.Trade active
Soon-trader
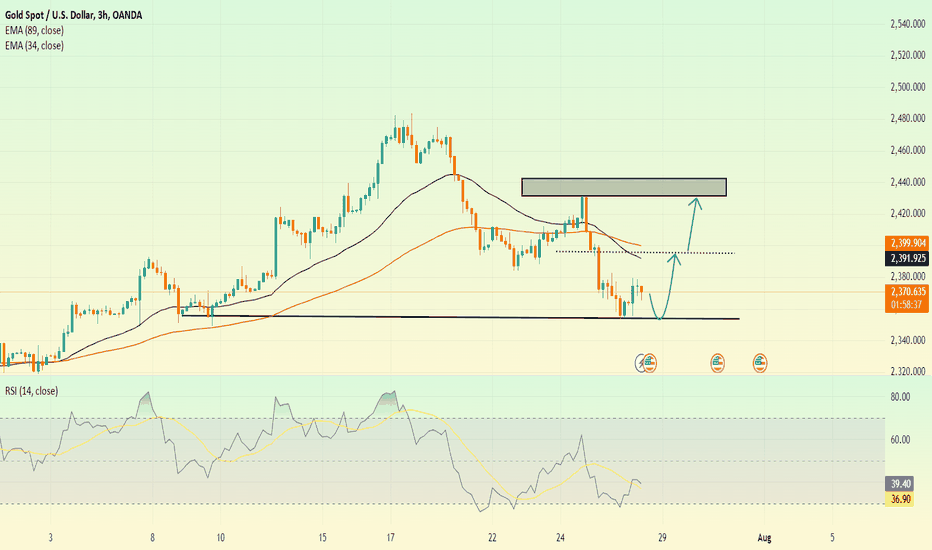
XAUUSD is in a slight uptrend after a recovery from a key support zone. Currently, XAUUSD is trading below the EMA 34 (black) and EMA 89 (orange), indicating that the long-term downtrend persists, but there is a short-term recovery. The RSI is currently at 39.04, suggesting the market is in an oversold zone, which may create short-term buying pressure. The future trend of XAUUSD may continue to rise if the price can break through the current resistance at $2430 and maintain above the EMA lines.
Soon-trader
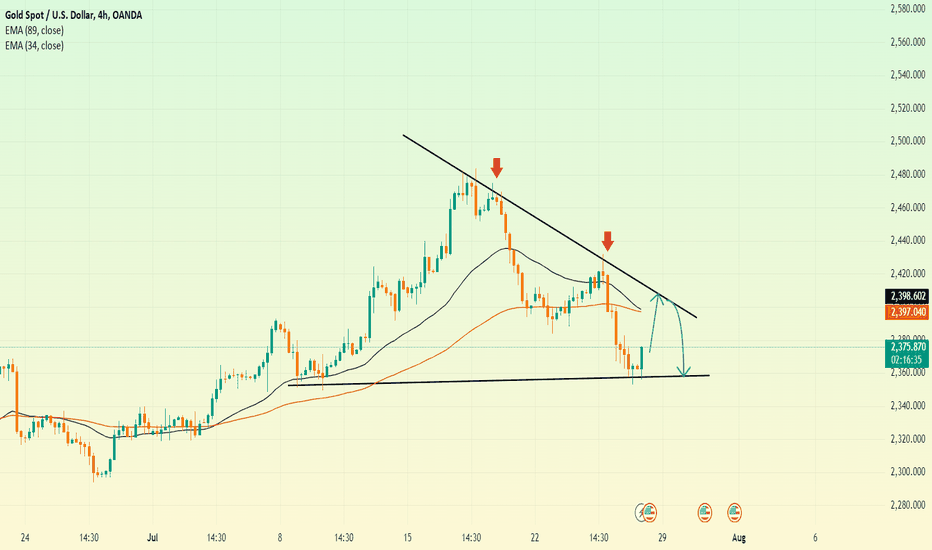
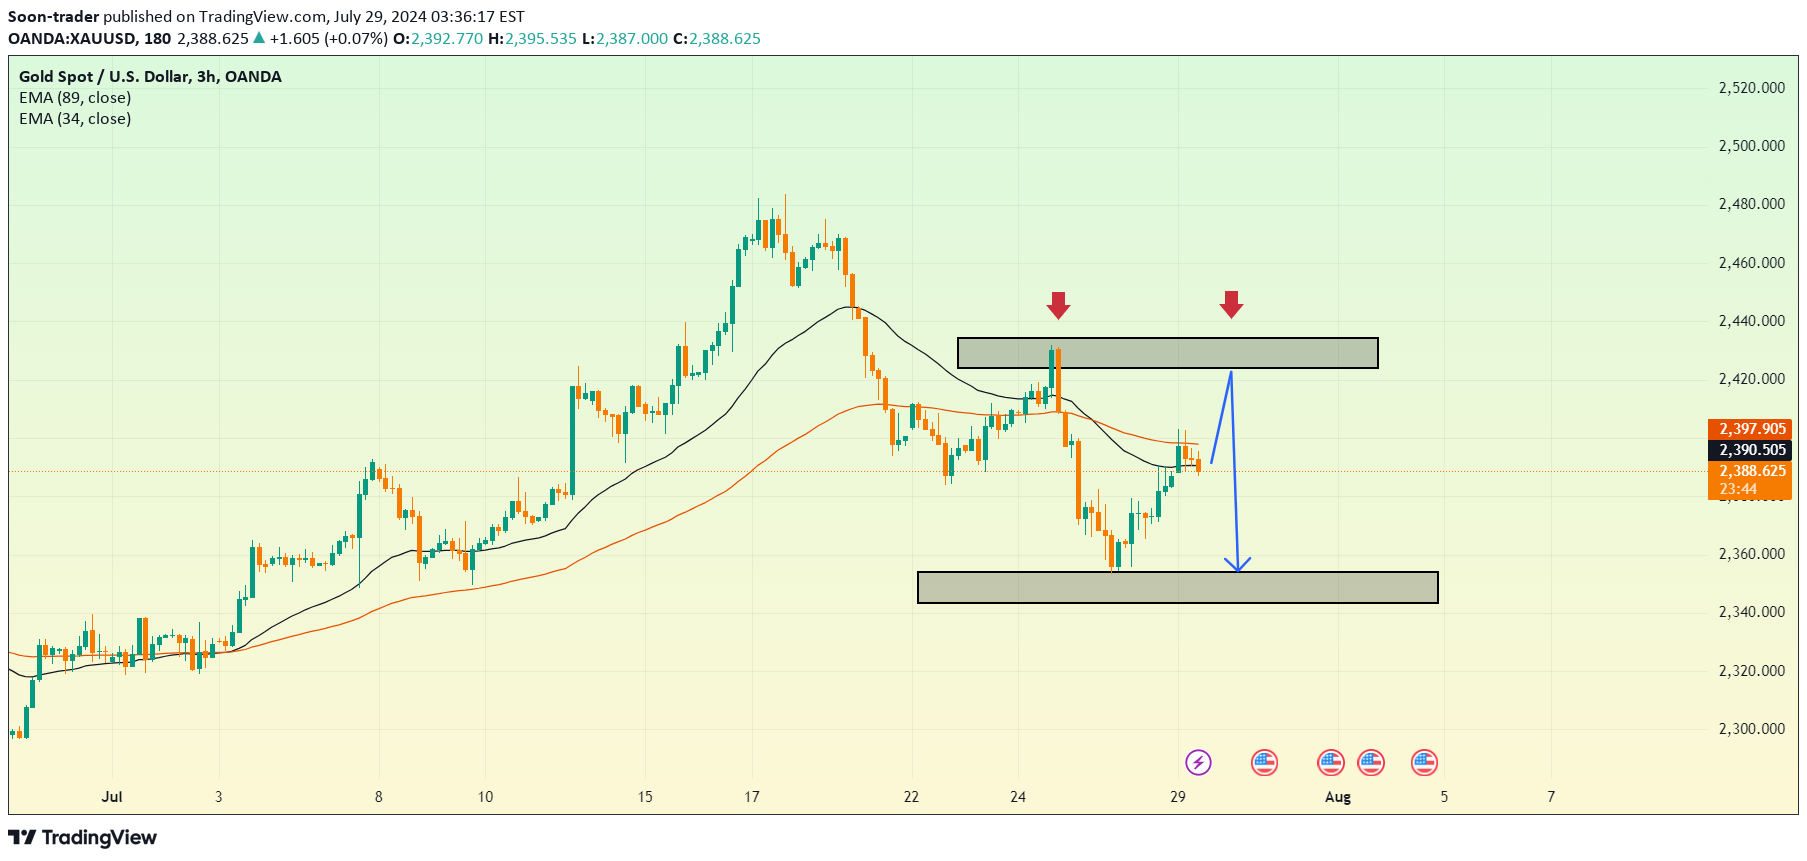
Geopolitical news and international trade relations are increasing the volatility of XAUUSD. On the 4-hour chart, gold prices are being constrained below a downward resistance line marked by two red arrows. Currently, gold prices are below the EMA 34 and EMA 89 lines, indicating that the downward trend is still prevailing. Recent candlesticks show strong selling pressure, with long upper wicks indicating rejection at higher price levels. The future trend of XAUUSD may continue to decline if the price cannot break through the downward resistance line.Trade active
Soon-trader
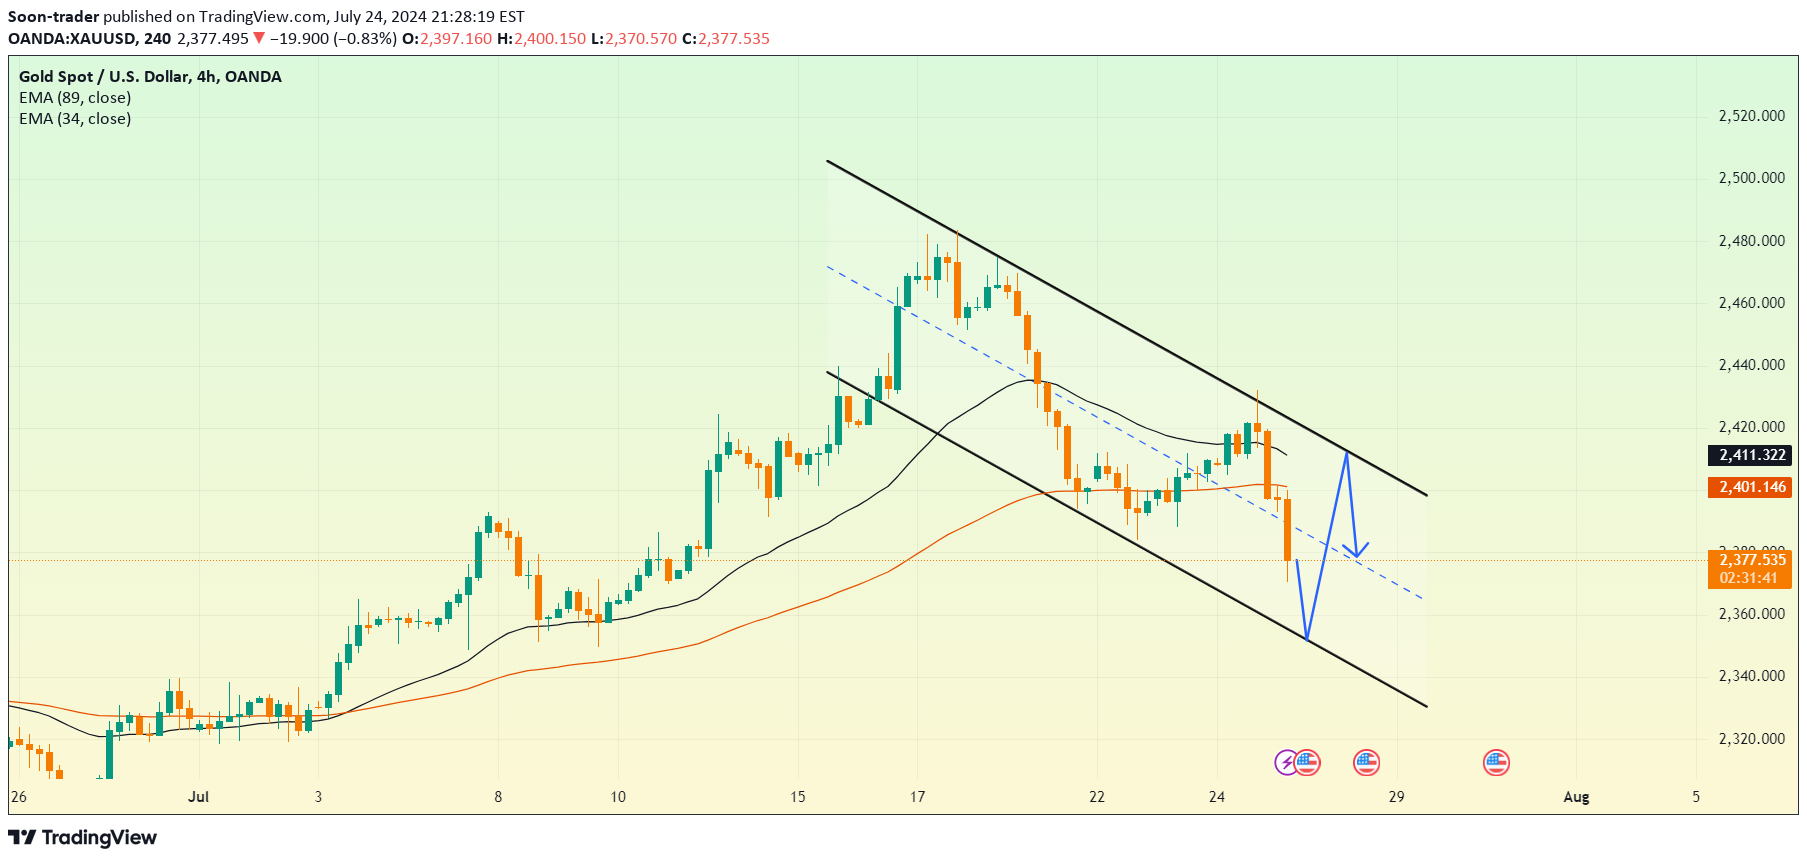
According to the 4H chart, the EMA 34 and EMA 89 are both sloping downwards, reinforcing the downtrend. The descending channel is defined by two parallel black trend lines. Gold is trading within this range, possibly finding support near the bottom of the channel and resistance at the top. Recent candlestick patterns indicate the formation of lower highs and lower lows, suggesting continued selling pressure. The price may experience a slight upward correction to test the resistance line of the descending channel before continuing its downward trend.Trade active
Soon-trader
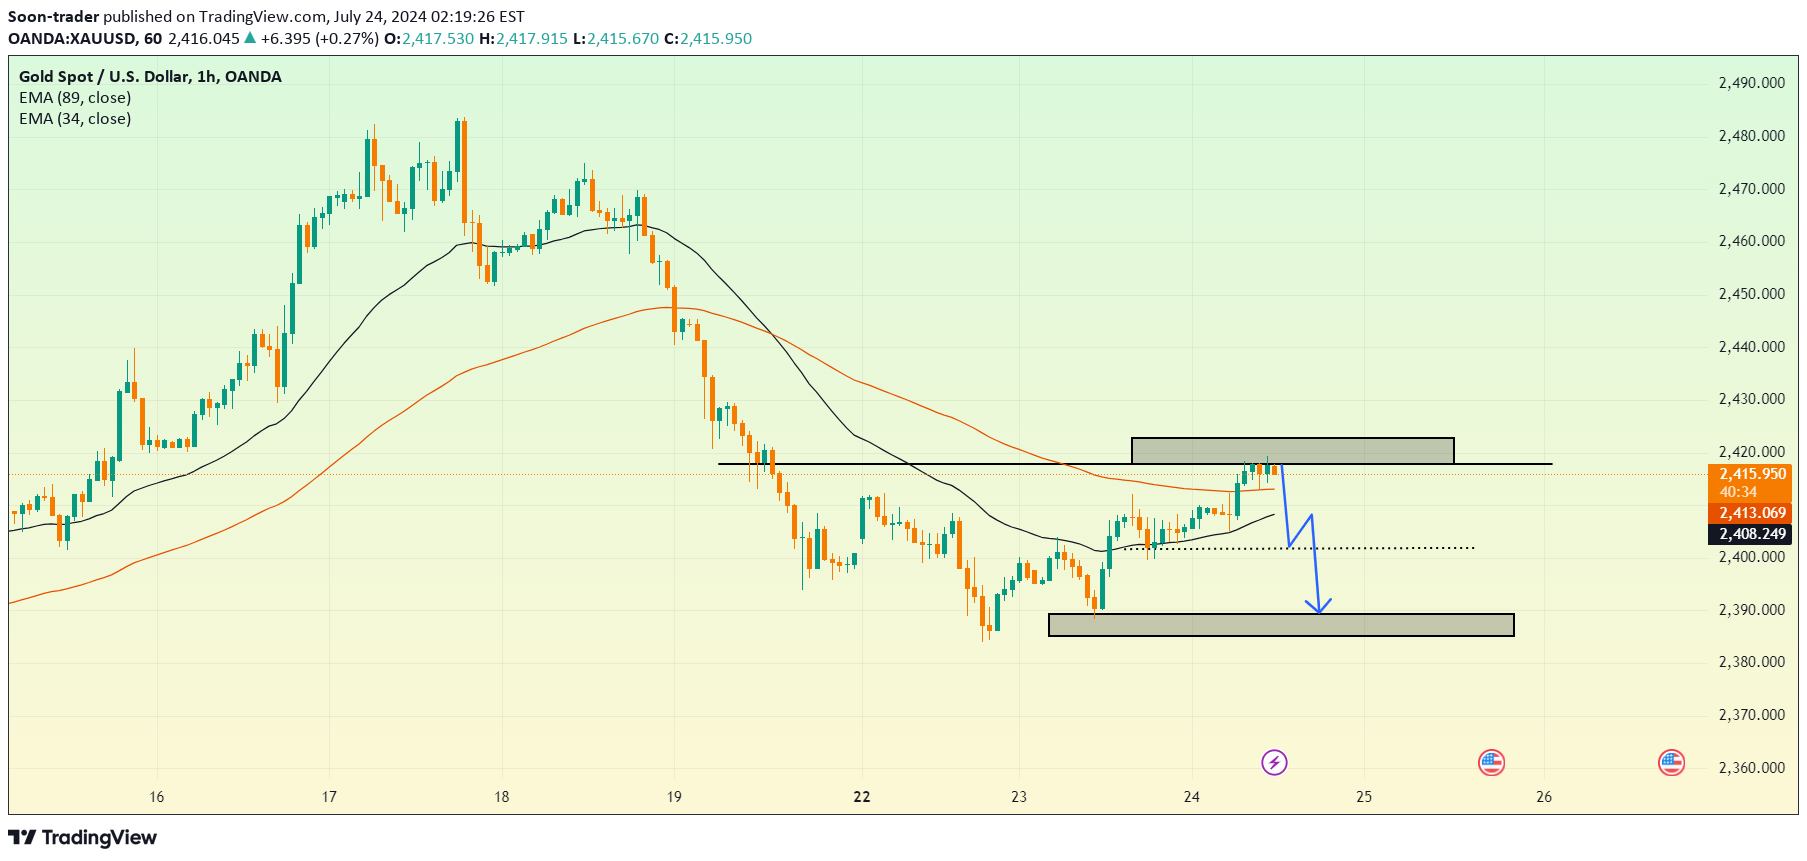
You can see on the chart that the price has broken below both EMA lines, indicating a strong bearish signal. Currently, the price is trading near the resistance level at the 2,419 region and is trending down towards the next support level around 2,390. The appearance of strong bearish candles in recent sessions confirms significant selling pressure. In the short term, the price may drop to the support region at 2,390.Trade activeTrade activeTrade active
Disclaimer
Any content and materials included in Sahmeto's website and official communication channels are a compilation of personal opinions and analyses and are not binding. They do not constitute any recommendation for buying, selling, entering or exiting the stock market and cryptocurrency market. Also, all news and analyses included in the website and channels are merely republished information from official and unofficial domestic and foreign sources, and it is obvious that users of the said content are responsible for following up and ensuring the authenticity and accuracy of the materials. Therefore, while disclaiming responsibility, it is declared that the responsibility for any decision-making, action, and potential profit and loss in the capital market and cryptocurrency market lies with the trader.