
SohailChaudhary
@t_SohailChaudhary

What symbols does the trader recommend buying?
Purchase History
پیام های تریدر
Filter
SohailChaudhary
Gold
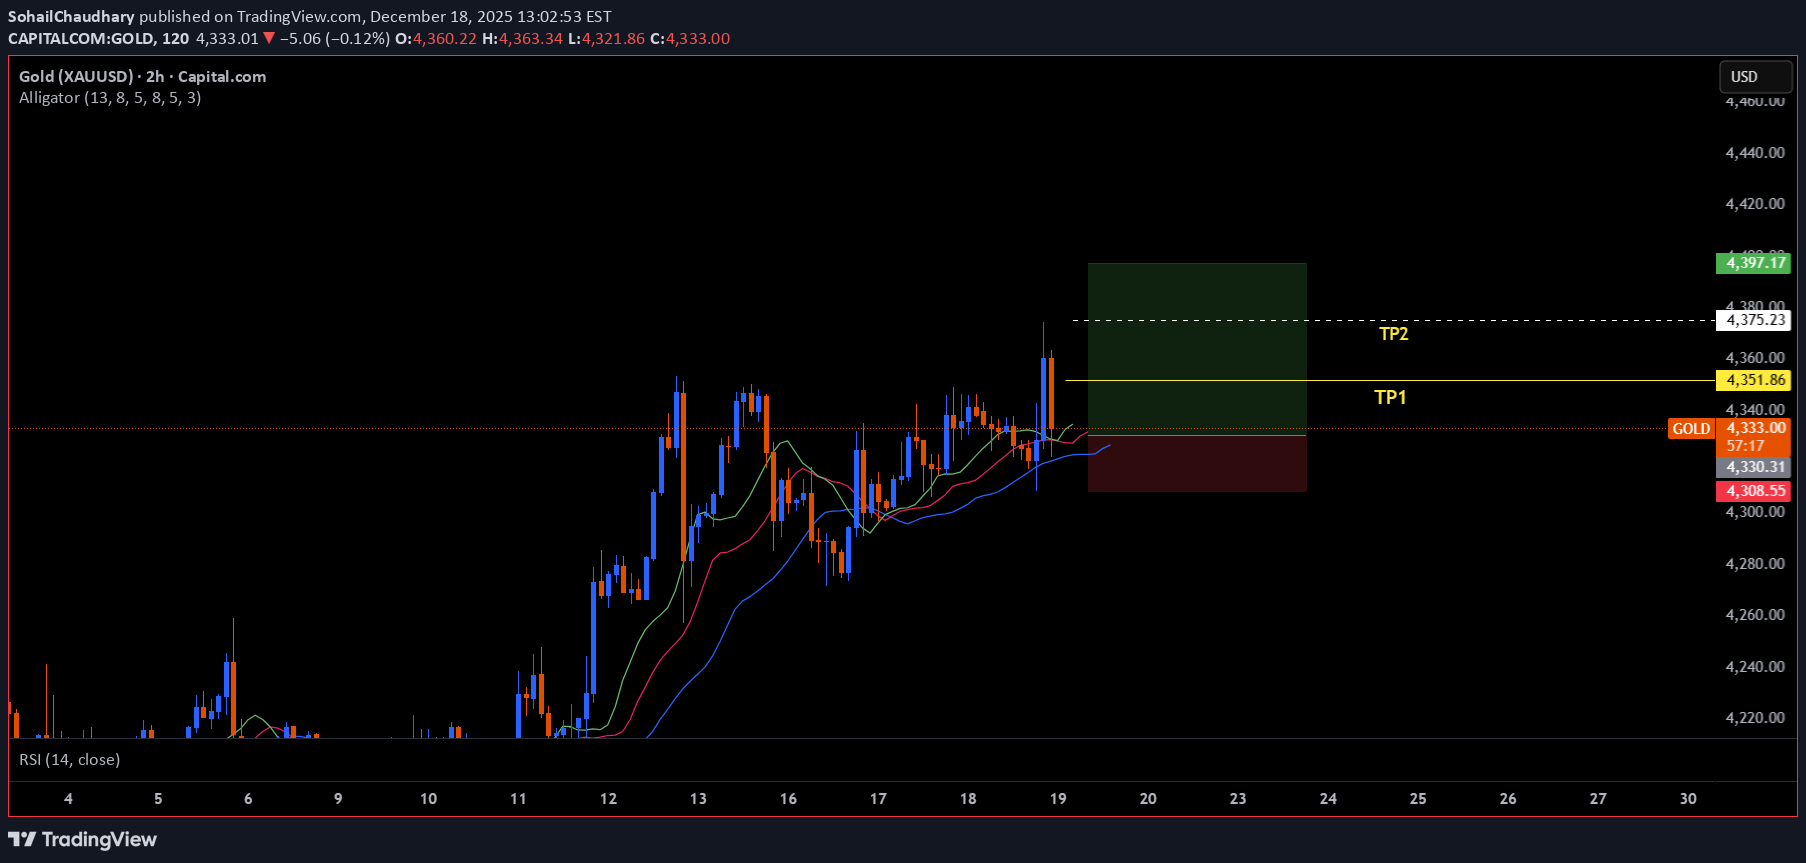
📈 Gold – Buy Setup Based on CWT The Alligator indicator (Jaw, Teeth, and Lips) is showing alignment in bullish directionTP1 HitTP2 & TP3 Hit
SohailChaudhary
SohailChaudhary
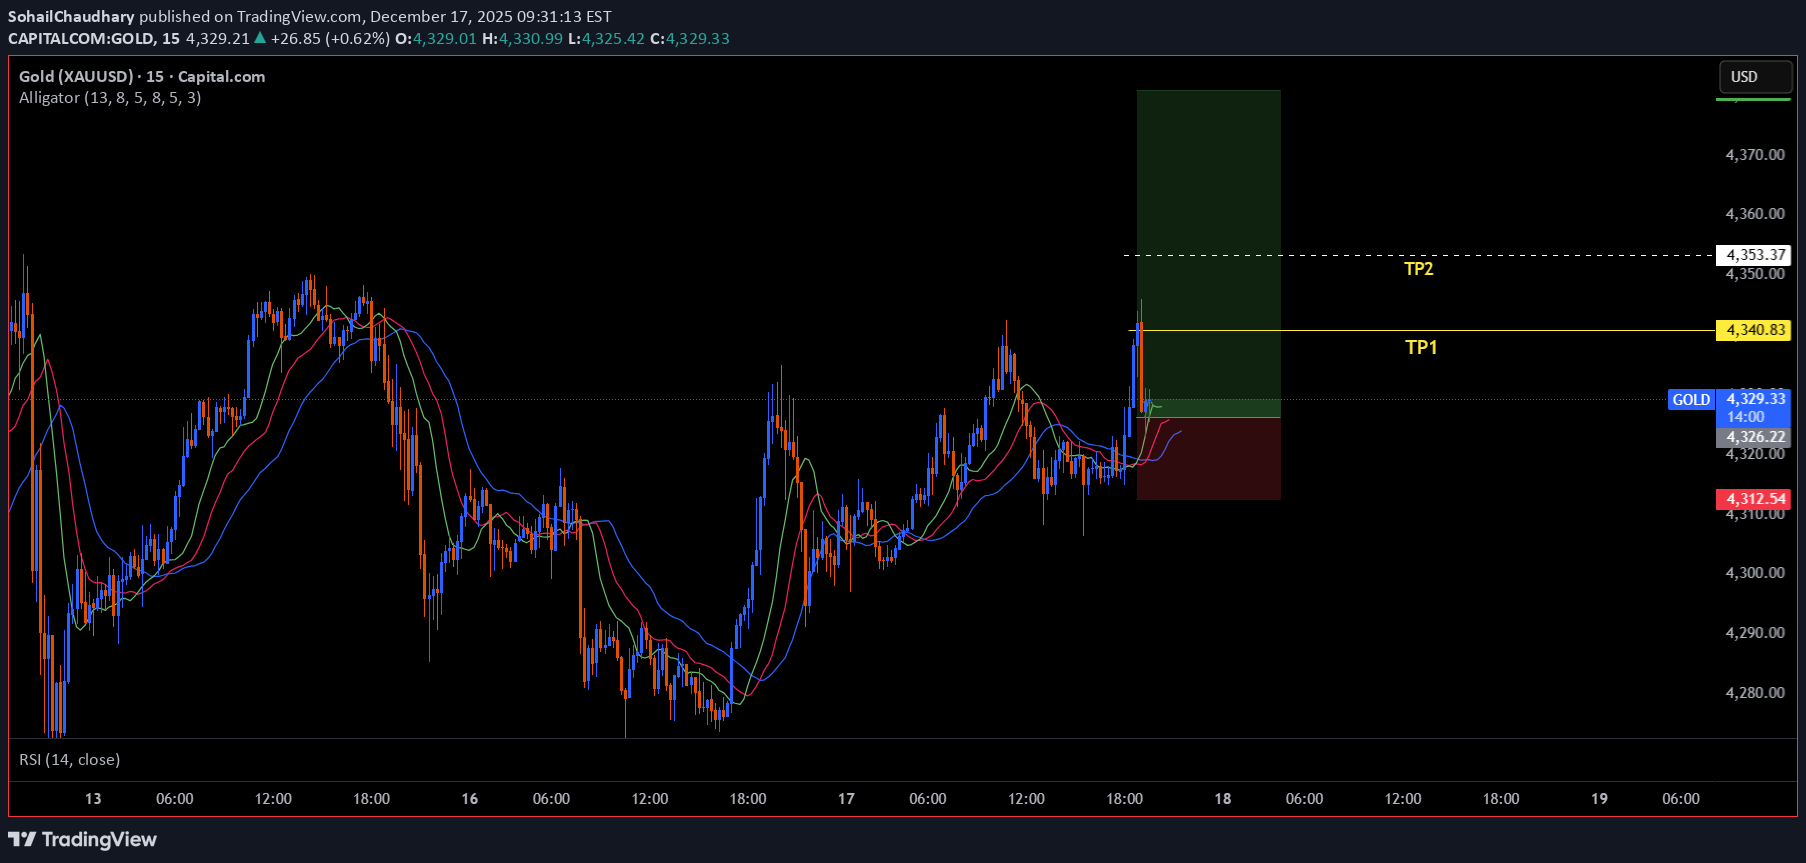
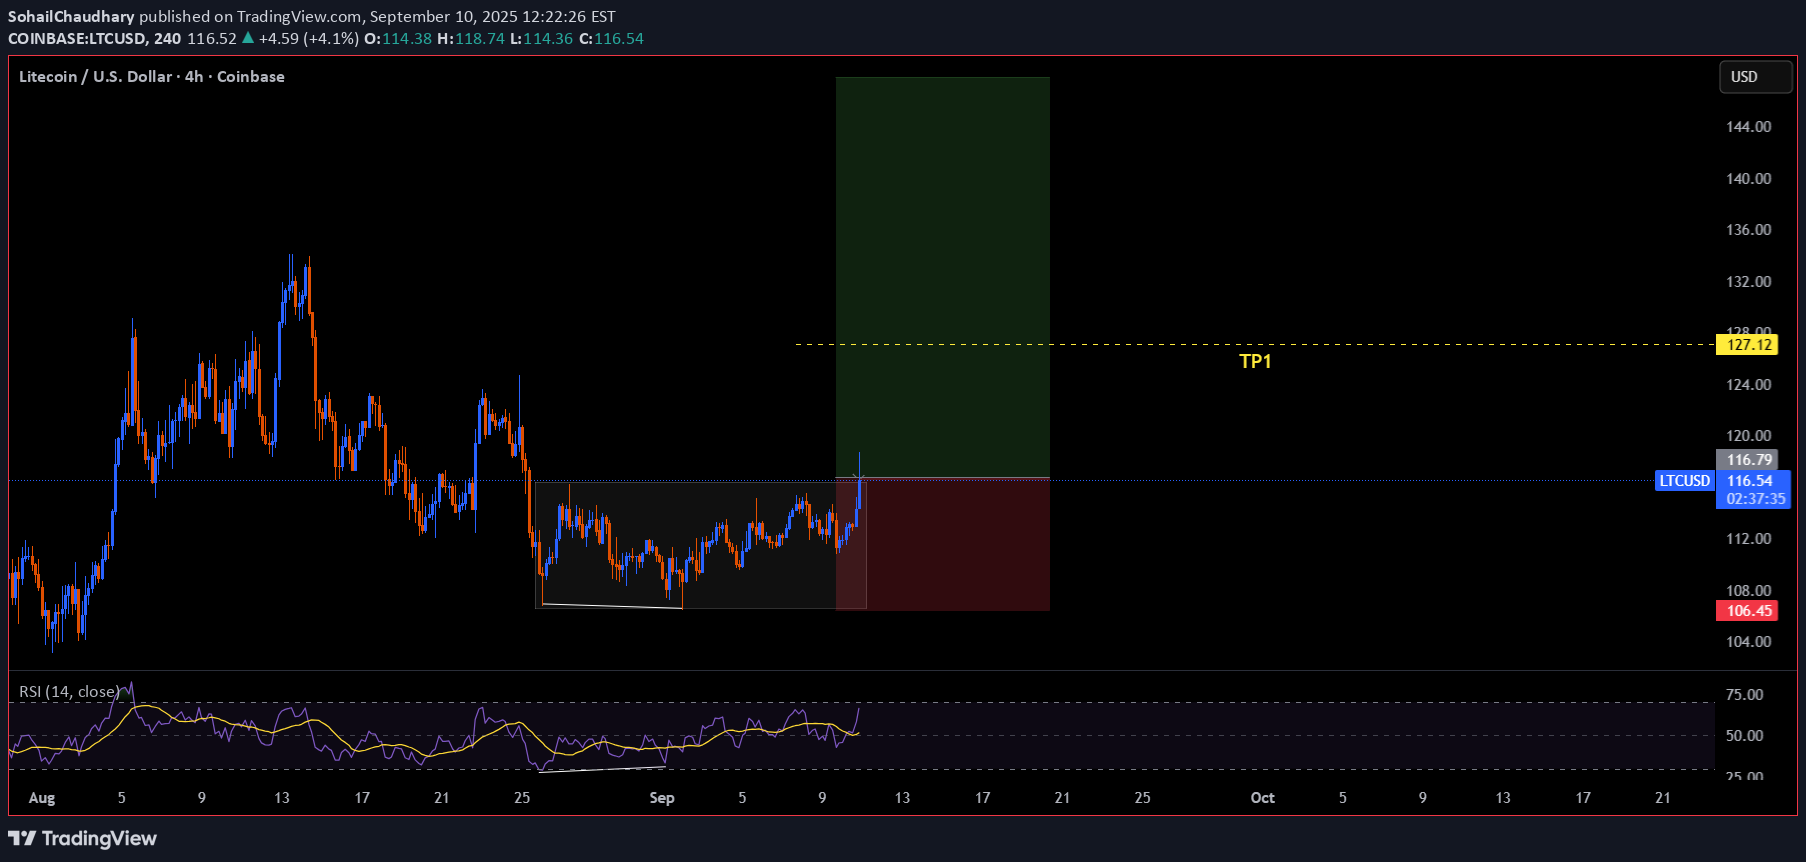
LTCUSD
LTCUSDT – 4H Range Breakout with Divergence Setup Price was consolidating in a tight 4H range. A clean breakout candle has closed outside the range, confirming momentum.
SohailChaudhary
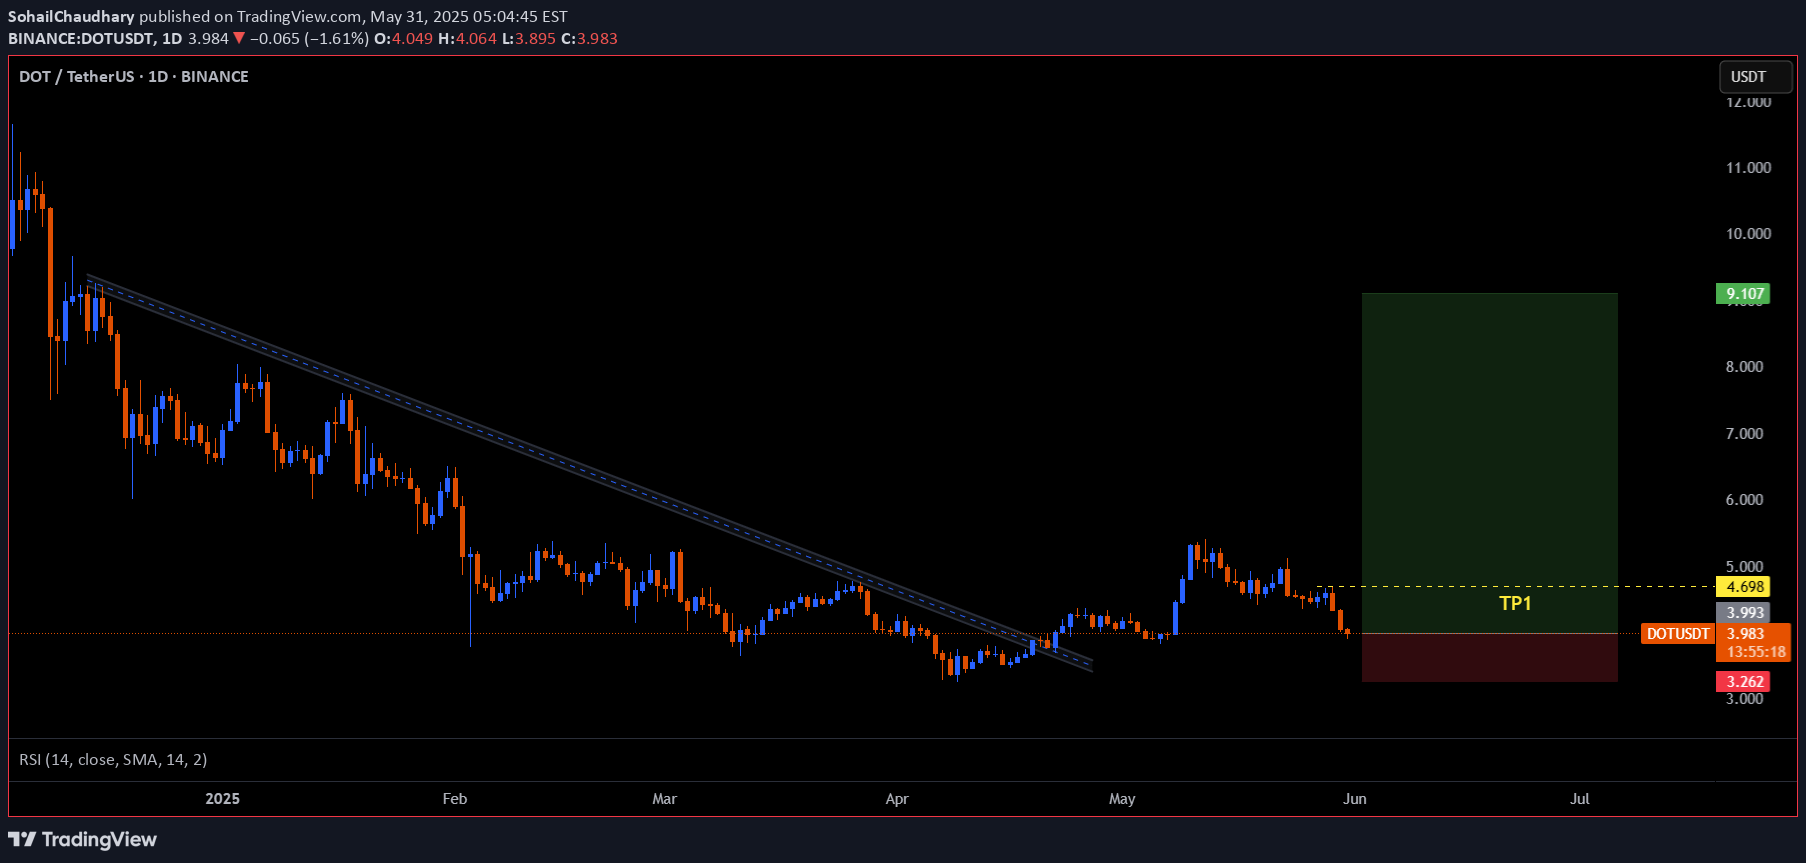
DOTUSDT
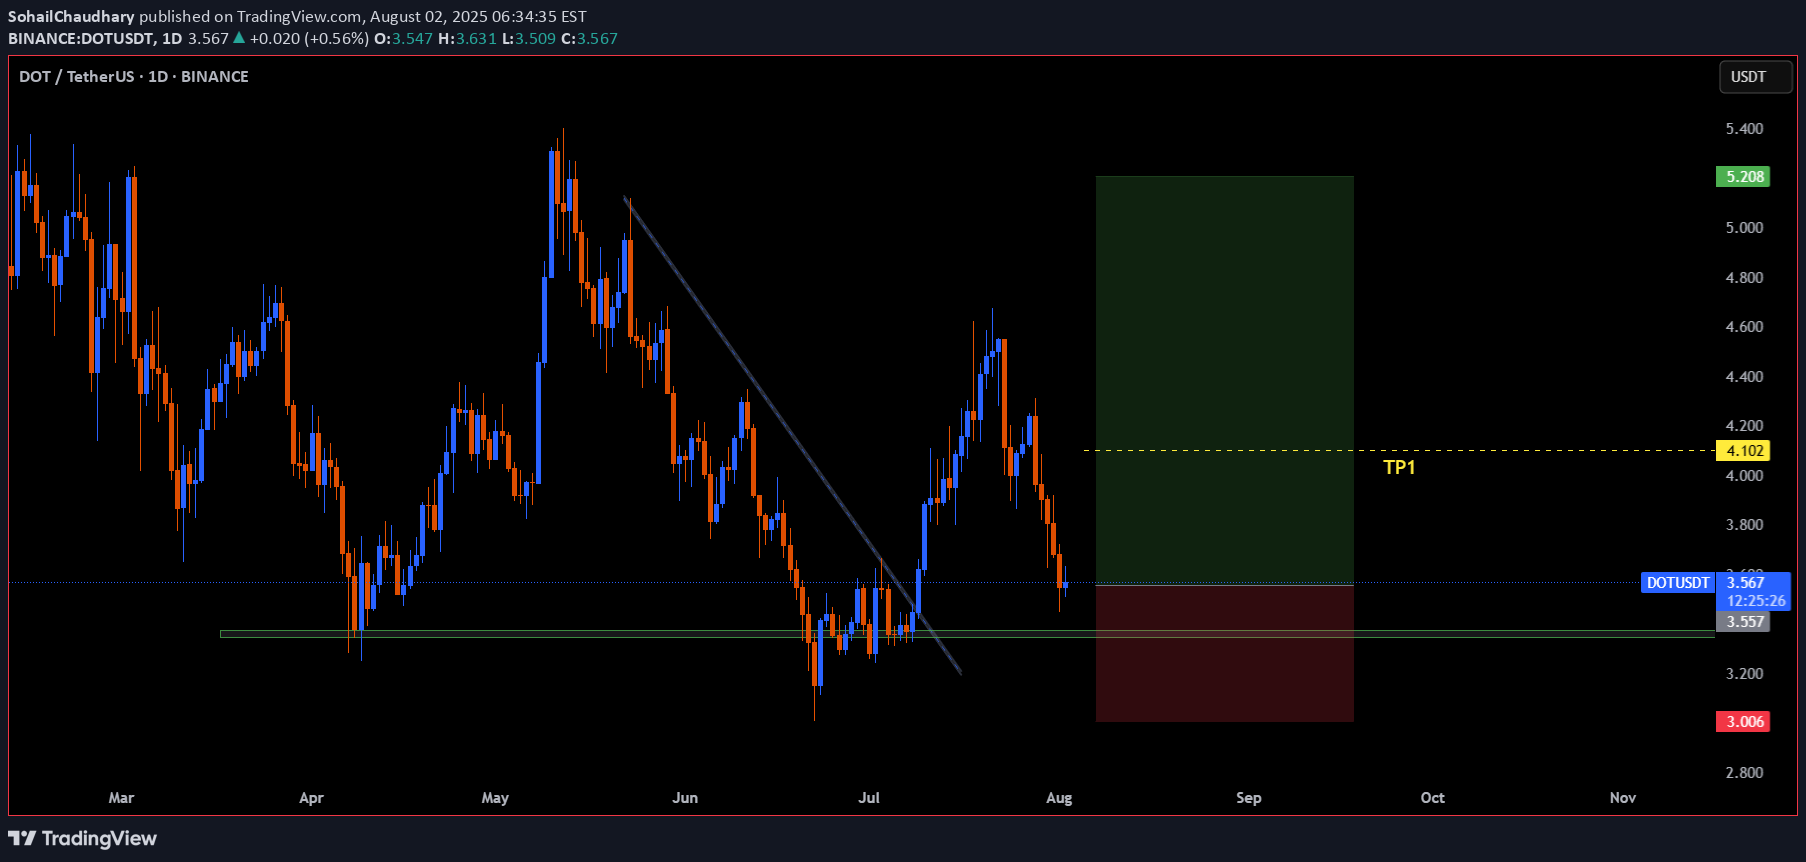
The first higher high after a downtrend indicates a potential trend reversal to the upside. It shows that buyers are starting to regain control, signaling the possibility of a new bullish trend. Trendline Break: A break above a significant trendline further confirms the shift in sentiment from bearish to bullish. The trendline break signifies that selling pressure has weakened, and the market is poised for further upward movement.
SohailChaudhary
DOTUSDT
The first higher high after a downtrend indicates a potential trend reversal to the upside. It shows that buyers are starting to regain control, signaling the possibility of a new bullish trend.Trendline Break: A break above a significant trendline further confirms the shift in sentiment from bearish to bullish. The trendline break signifies that selling pressure has weakened, and the market is poised for further upward movement.
SohailChaudhary
ETHUSDT

Higher Highs (HH) & Higher Lows (HL): The pattern of higher highs and higher lows is an indication of an uptrend, showing that the buying momentum is strong.Entry: Place a buy stop order just above the recent higher high (HH). This allows you to enter the trade if the price continues moving upward, confirming the bullish momentum.
SohailChaudhary
LTCUSDT

The tool watches for a strong upward move (called the flagpole).Then it looks for a small pullback or sideways move (called the flag).
SohailChaudhary
DashUSDT

RSI indicates Bullish Divergence. Which means that at any time the market trend can change to HH and HL.
SohailChaudhary

SohailChaudhary
SUSHIUSDT

RSI indicates Bullish Divergence. Which means that at any time the market trend can change to HH and HL.
Disclaimer
Any content and materials included in Sahmeto's website and official communication channels are a compilation of personal opinions and analyses and are not binding. They do not constitute any recommendation for buying, selling, entering or exiting the stock market and cryptocurrency market. Also, all news and analyses included in the website and channels are merely republished information from official and unofficial domestic and foreign sources, and it is obvious that users of the said content are responsible for following up and ensuring the authenticity and accuracy of the materials. Therefore, while disclaiming responsibility, it is declared that the responsibility for any decision-making, action, and potential profit and loss in the capital market and cryptocurrency market lies with the trader.