
SineHeidari
@t_SineHeidari

What symbols does the trader recommend buying?
Purchase History
پیام های تریدر
Filter
Signal Type
SineHeidari
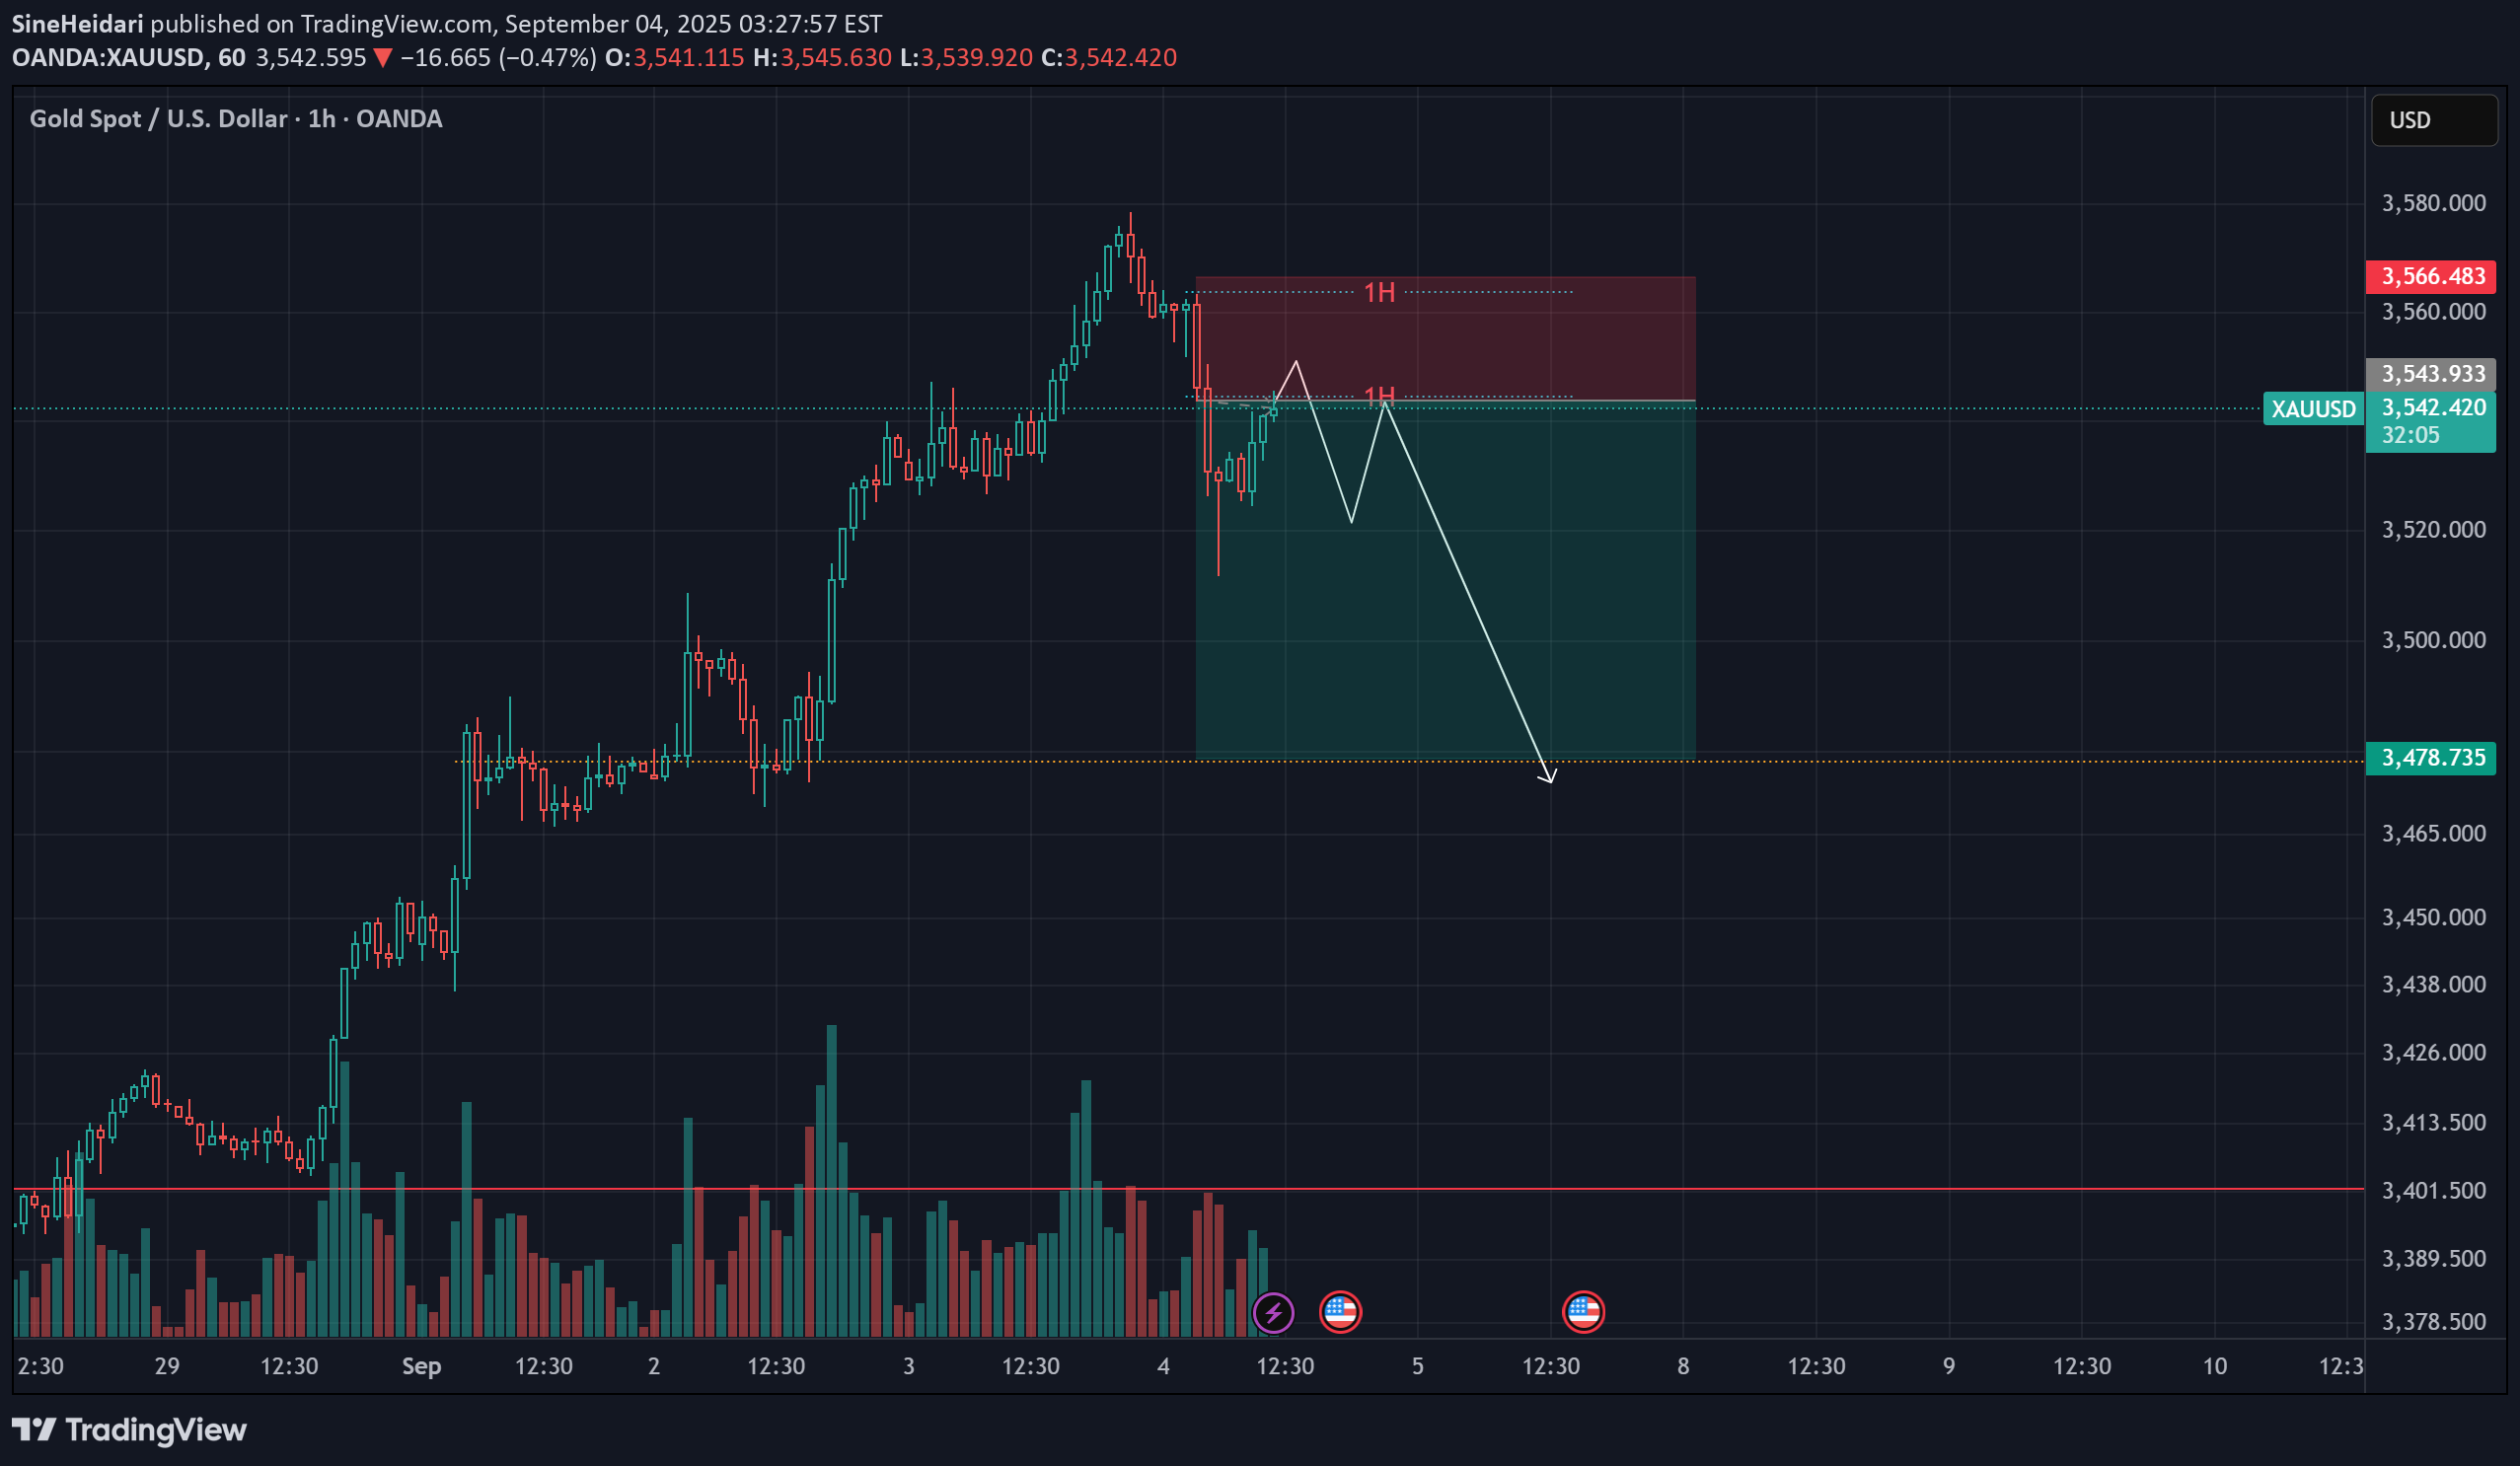
In recent days, Gold has been relentlessly printing new highs, and this continued up until yesterday. However, today’s price action is showing the first signs of a possible correction. Looking at the broader chart, the trend is still decisively bullish, meaning any counter-trend trades carry significant risk. 🔸 For sellers, a strong confirmation would only come if we see a 4H close below 3468 – that’s where a bearish outlook starts to make more sense. 🔸 If you’re still aiming for a counter-trend short, the 3540 – 3560 zone on the 1H timeframe could be considered, but only with strict risk management. The potential downside target sits near 3473. ⚠️ Keep in mind: a 1H close above 3565 invalidates this setup.
SineHeidari

As we mentioned earlier, Ethereum is still stuck in a decision-making zone. At first glance, it may seem like the market hasn’t moved much, but from a time perspective, it’s actually running out of chances for buyers — which increases the likelihood of a downside move day by day. In fact, the drop might have already started. Of course, to confirm a real breakdown, we still need a daily close below the $4,000 level. But even now, it doesn’t look like a bad setup for ETH sellers. That’s why I suggest buyers start taking profits before it’s too late. The first target for sellers is around $3,700, and the second target is near $3,500.
SineHeidari

After dropping from the $124,000 zone, Bitcoin’s first close below $112,000 delayed any hopes of a quick rebound for buyers. The next close under $110,000 triggered another wave of selling pressure, adding momentum to the downside. As we highlighted earlier, the $106,000 level is a key take-profit zone for many short-term sellers – including us. We’ve closed our short positions around this area and are now waiting to see how price reacts to this level before looking for the next entry opportunity. So far, this ~10% decline has played out exactly as anticipated – hope you managed to catch the move with us. ✅
SineHeidari

For almost three weeks we’ve been tracking Gold step by step, starting from the 3310 – 3320 zone, where our long-term orders were triggered. ✅ Last week our second target was reached, and price even closed above it – a strong sign that buyers are determined to push Gold into the 3500 channel. 🎯 Our third target stands at 3490, and I expect this could be achieved by Wednesday – that’s nearly 1700 pips profit in less than 10 days. The best trades are those that hit take profit quickly, avoiding prolonged sideways action. 📌 For this week, I still find the 3385 – 3395 zone attractive for entries. If price dips back into this area before reaching 3490, it would provide an even more favorable setup.
SineHeidari

After the high recorded about 10 days ago, we initially expected a deeper correction. However, price surprised the market by pushing back toward the highs yesterday and printing a new top. ⚖️ The current decision zones are very tight: • A daily close above $5,100 would strengthen the bullish outlook and support further upside. • A daily close below $4,000 would shift momentum in favor of sellers. 📊 For now, it’s best to stay patient and watch how Ethereum reacts over the coming week before taking new positions.
SineHeidari

After the drop from $124,000 down to $111,000, many long-term investors reassessed their expectations for the $150,000 – $160,000 targets. As a result, we’ve seen consistent profit-taking at local highs, which has pressured the market lower. 📊 On-chain and order flow data indicate heavy liquidity inflows around the $106,000 zone. This suggests that price may get attracted to this level, where a potential bullish reaction could occur. 🎯 Meanwhile, the $119,000 zone could act as a favorable short opportunity, offering sellers a chance to lock in profits.
SineHeidari

Price reached our zone and started to bounce, already delivering about 140 pips profit. Although we aimed for an optimized New York entry, the order flow in Asia and Sydney sessions suggests another leg down. 🔻 Next attractive buy zone: 3285 – 3295 ✅ Trade Plan: • Manage and risk-free the current position. • Keep main exposure for lower levels. • If no new lows form during New York session, upside momentum remains intact. Key invalidation: Daily close below 3280
SineHeidari

In our previous outlook, we highlighted the 3320 – 3300 zone as a potential reversal area. Last week, price indeed reacted from this range and delivered a 300-pip bounce. However, that move lacked the momentum to fully meet our expectations. We believe the main bullish leg could take place this week – provided that liquidity is collected from lower levels first. 📌 Optimal Entry Zone: 3310 – 3300 If price taps into this demand and hunts resting orders, we anticipate a continuation of the bullish trend, aiming for a return into the 3400 channel. ⚠️ Keep in mind: this could be the last retest of the 3300 zone, making it a valuable long opportunity – potentially even suitable for a longer-term hold, if momentum confirms.
SineHeidari

After reaching the $3,440 high in July, all pullbacks that returned to this level failed to break above it. However, it seems sellers have lightened their positions, and the market now has a stronger bullish sentiment. Since the start of the week, we have seen a price decline, and yesterday's corrections suggest that the first bearish leg may be followed by a second one. 📌 Our plan is to wait for this second leg to complete, ideally bringing price into the $3,315 – $3,305 demand zone, where we expect a potential rally toward new highs within the next two weeks. Key Level: As long as we don’t see a daily close below $3,280, our primary bias remains bullish.
SineHeidari

We’ve been waiting for gold to break above the 3400 level for quite some time. Despite multiple tests and deep wicks into this zone, I don’t expect the coming week to bring a fresh high for gold. With price compression between 3390 – 3400, I anticipate that the market will be selling gold this week. We should also expect a stop hunt on sellers before the drop. My preferred short entry zone remains 3415 – 3430, with a probable target around 3200, making this risk-reward setup attractive.
Disclaimer
Any content and materials included in Sahmeto's website and official communication channels are a compilation of personal opinions and analyses and are not binding. They do not constitute any recommendation for buying, selling, entering or exiting the stock market and cryptocurrency market. Also, all news and analyses included in the website and channels are merely republished information from official and unofficial domestic and foreign sources, and it is obvious that users of the said content are responsible for following up and ensuring the authenticity and accuracy of the materials. Therefore, while disclaiming responsibility, it is declared that the responsibility for any decision-making, action, and potential profit and loss in the capital market and cryptocurrency market lies with the trader.