
ProTradeSignals
@t_ProTradeSignals

What symbols does the trader recommend buying?
Purchase History
پیام های تریدر
Filter
ProTradeSignals
Gold - Price is at resistance with bearish RSI divergence

Price is at resistance with bearish RSI divergence (overbought at 72.39) and a potential double top forming. Volume is declining, indicating weakening momentum.Stochastic Oscillator (14, 1, 3): The Stochastic is at 90.48, well into the overbought territory (above 80). This indicates that the price may be overextended and due for a pullback.Relative Strength Index (RSI, 14): The RSI is at 72.39, also in the overbought zone (above 70). Additionally, there’s a bearish divergence—while the price made a higher high near $3,135.060, the RSI made a lower high, signaling weakening momentum.Simple Moving Average (SMA, 14, 2) on RSI: The RSI’s SMA is at 68.05, showing that the RSI is still elevated but trending downward, supporting the bearish divergence.Resistance Rejection: The price is failing to break through the $3,132.528–$3,135.060 resistance zone, as evidenced by the red circle showing a sharp rejection.Bearish Divergence: The RSI (72.39) shows a bearish divergence, indicating that the upward momentum is fading despite the price hitting a higher high.Overbought Indicators: Both the Stochastic (90.48) and RSI (72.39) are in overbought territory, suggesting the price is overextended and likely to correct.Volume Decline: Decreasing volume on the recent push to resistance indicates a lack of buying conviction, increasing the likelihood of a reversal.Double Top Potential: The price action near $3,135.060 resembles a double top pattern, a bearish reversal setup, especially with the rejection at this level.Monitor for Confirmation: Watch for a bearish candlestick pattern (e.g., a shooting star or bearish engulfing) on the 5-minute chart to confirm the reversal before entering the trade.Risk Management: Only risk a small percentage of your account (e.g., 1-2%) on this trade. Adjust position size based on the stop loss distance.the shorter-term EMAs have crossed below the longer-term ones, confirming the bearish momentum.
ProTradeSignals
Gold/Silver Ratio Analysis

Gold (XAU/USD) currently trading at $3,118 has significantly outpaced Silver (SILVER) at $34.07 since mid-March. This divergence has pushed the Gold/Silver ratio to elevated levels, creating a potential mean-reversion opportunity.Looking at the chart, both metals maintained strong correlation through January-February 2025 before Gold began its dramatic acceleration in March-April. While both assets remain in strong uptrends, Gold's nearly vertical move in April suggests potential overextension relative to its historical relationship with Silver.Trading StrategyConsider a pairs trade setup:SHORT Gold / LONG Silver at current ratioTarget: Reversion to 50-day moving average of Gold/Silver ratioStop: 2% additional expansion of current ratioRisk ManagementKey to this trade is position sizing that equalizes dollar exposure between the two positions. Use reduced leverage as precious metals volatility remains elevated across the complex.XAU XAG #PairsTrading
ProTradeSignals
GOLD SHORT SETUP: TARGETING $3,100 FROM OVERBOUGHT CONDITIONS

GOLD SHORT SETUP: TARGETING $3,100 FROM OVERBOUGHT CONDITIONSLooking at the current Gold chart, we're seeing potential exhaustion signs near all-time highs. While the trend remains strongly bullish (all moving averages pointing up), several indicators suggest we may be due for a pullback to the $3,100 level.Key ObservationsOverbought RSI (77.09): The RSI is showing overbought conditions without divergence yet, but at levels where previous corrections have occurred.Extreme Stochastic (97.99): Nearly maxed out at 98, suggesting limited upside momentum remains.Williams %R near zero (-2.44): Showing extreme buying pressure that historically doesn't sustain.CCI above 140: At 146.61, well into overbought territory.Moving Average Spacing: While all MAs signal "Buy," the distance between recent EMAs (10, 20) and price indicates stretched conditions.Risk ManagementThis is a counter-trend trade against strong bullish momentum, so position sizing should be conservative. The R2 pivot at $3,045 and the 10-day SMA at $3,046 should act as initial support levels and could provide clues about whether the pullback thesis is playing out.
ProTradeSignals
Gold Buy Idea

Based on the gold charts with the requested indicators (Bollinger Bands/MBB, VWAP with bands, and RSI 14), here's my analysis across the three timeframes:Buy at 3,025SL: 3,021.50TP 1: 3,029.50TP 2: 3,035.00Current price: 3,024.10 with slight negative movement (-0.02%, -0.655)5-minute chart: Price is trading between the MBB (3,024.78) and lower Bollinger Band, with RSI at 62.13 showing positive momentum but not overbought15-minute chart: Price is near the MBB (3,021.52) with RSI at 57.55, indicating moderate bullish momentum1-hour chart: Price is testing the MBB (3,015.66) as support, with RSI at 46.80 showing a potential shift from bearish to neutral/bullish momentumThe VWAP session bands on all timeframes show price currently within the bands but starting to approach the upper band. The 1-hour chart shows resistance at around 3,028-3,029 (previous VWAP upper band area).This setup takes advantage of the potential upward momentum indicated by the RSI readings across timeframes, with price finding support at the middle Bollinger Bands. The stop loss is placed below the recent support level and below the lower VWAP band on the 15-minute chart, while take profit targets aim for the upper Bollinger Band and recent resistance levels.
ProTradeSignals
GOLD/USD Short Trade Setup – Bearish Momentum Below Resistance
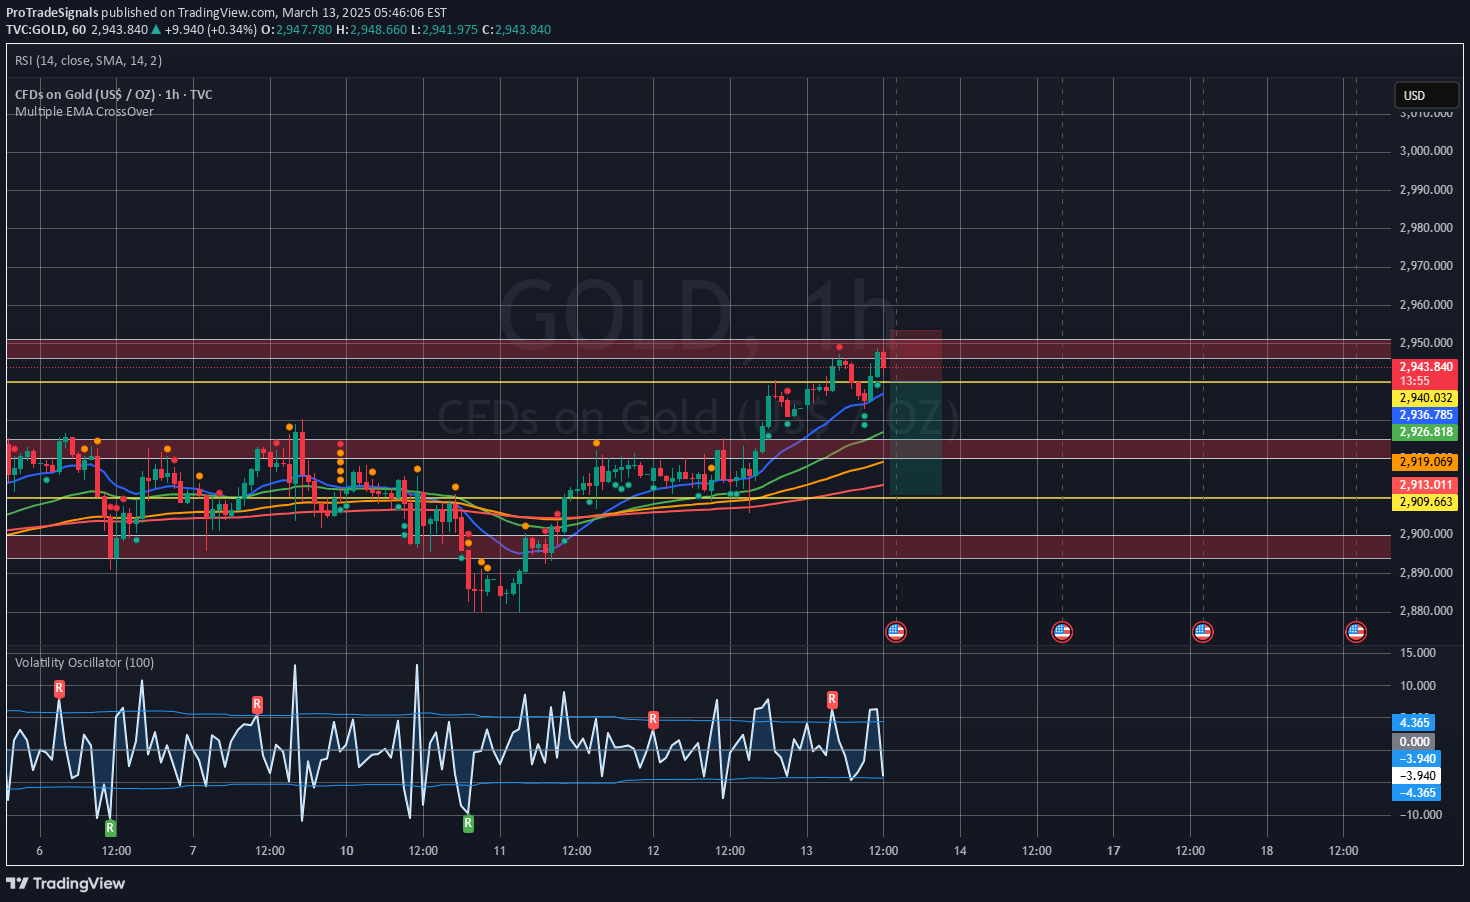
💡 Trade Rationale:1️⃣ Technical Breakdown:2940.110 is a key resistance level; rejection confirms downside potential.Price struggling to hold above 2950, signaling weakness.2️⃣ Macro Factors:Stronger USD & bond yields keeping gold under pressure.Lower-than-expected CPI reducing gold’s safe-haven demand.3️⃣ Market Sentiment:Bearish below 2940 with sellers stepping in aggressively.Break below 2925 confirms momentum to 2910.676 target.📊 Watch for:✔️ Weak rejection at 2940 for clean short setup.✔️ Break below 2925 accelerates selling pressure.✔️ U.S. market open (15:30 IST) volatility impact.🚨 Bearish Bias 🚨 – Short Gold Below 2940.110, Targeting 2910.676! 📉🔥🔴 Short Entry: 2940.110🎯 Take Profit (TP): 2910.676🛑 Stop Loss (SL): 2953.561#XAUUSD #Gold #Short #Trading #TechnicalAnalysis #USD
ProTradeSignals
GOLD/USD Short Trade Setup - Bearish Outlook

📉 GOLD/USD Short Trade Setup - Bearish Outlook (Higher Inflation Risk) 📉🔴 Short Entry: 1910 🎯 Take Profit (TP): 1875 (First Target), 1850 (Extended Target) 🛑 Stop Loss (SL): 1930 ---💡 Trade Rationale:1️⃣ Macro Factors: Recent inflation data suggests higher-than-expected CPI, strengthening the USD and pressuring gold prices. Fed rate hike expectations could fuel further downside. 2️⃣ Technical Setup: - Strong resistance zone at 1920-1930, rejecting multiple times. - Support Breakdown: A break below 1910 confirms bearish momentum. - RSI near overbought, signaling potential correction. 3️⃣ Risk Management: Tight SL to protect against unexpected volatility; TP aligns with key historical support levels.📊 Watch for: - Any hawkish Fed commentary reinforcing USD strength. - A clean breakdown of 1910 with volume for confirmation. - Potential retracements to 1925-1930 for better short entries.🚨 Bearish Bias 🚨 – Short Gold on Breakdown Below 1910! Let’s see how it plays out! 💰💥 #GOLD #XAUUSD #Trading #Short #Inflation #Fed #Bearish
Disclaimer
Any content and materials included in Sahmeto's website and official communication channels are a compilation of personal opinions and analyses and are not binding. They do not constitute any recommendation for buying, selling, entering or exiting the stock market and cryptocurrency market. Also, all news and analyses included in the website and channels are merely republished information from official and unofficial domestic and foreign sources, and it is obvious that users of the said content are responsible for following up and ensuring the authenticity and accuracy of the materials. Therefore, while disclaiming responsibility, it is declared that the responsibility for any decision-making, action, and potential profit and loss in the capital market and cryptocurrency market lies with the trader.