
PipFxMaster_444
@t_PipFxMaster_444

What symbols does the trader recommend buying?
Purchase History
پیام های تریدر
Filter
BTCUSD M15 _BULLISH SETUP
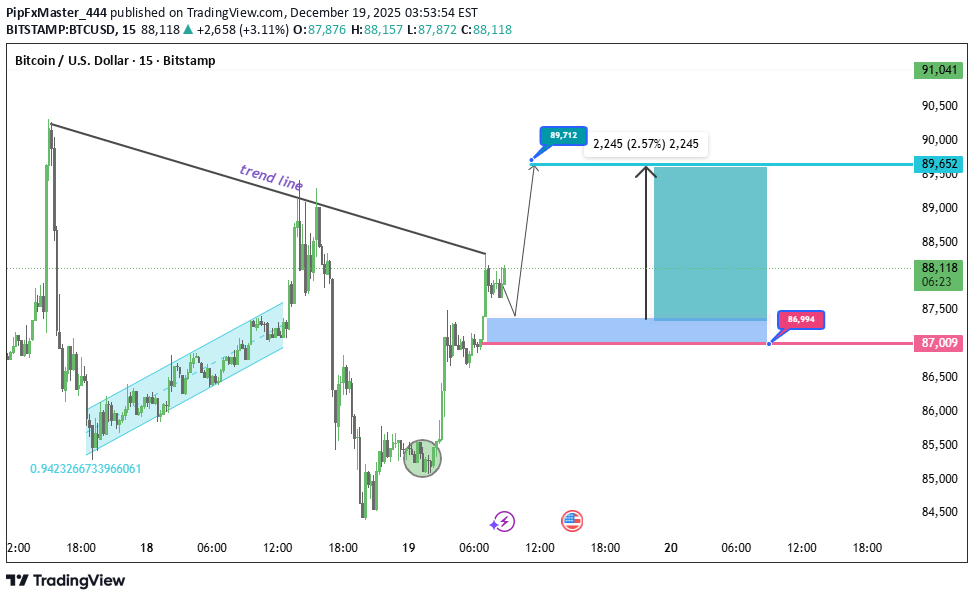
Price 86,900–87,100 zone Entry: 87,000 (confirmation Stop Loss: 86,500 (support Targets: TP1: 88,200 TP2: 89,600 (chart resistance
XAUUSD M15_ BULLISH REVERSAL SETUP
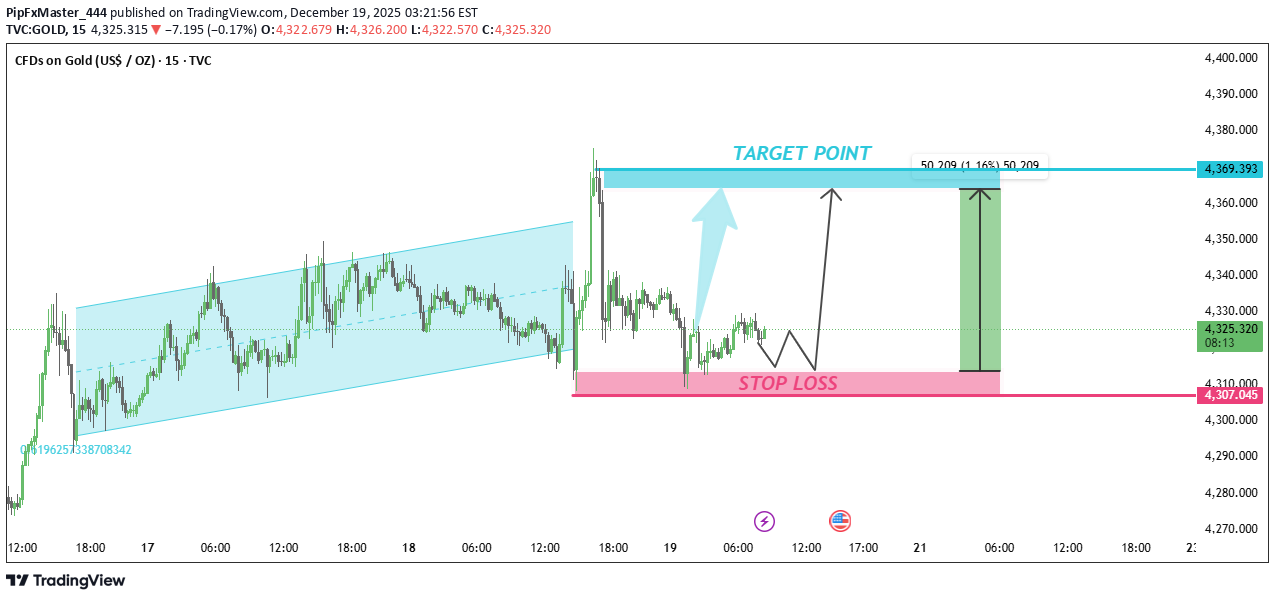
Entry 4320. 4310. Buy once the price shows a bounce from the support area (pink zone). Stop-Loss: 4,307 (just below the pink support zone) Target: 4,369–4,370 (blue target zone
BTCUSD – M15 Sell Setup
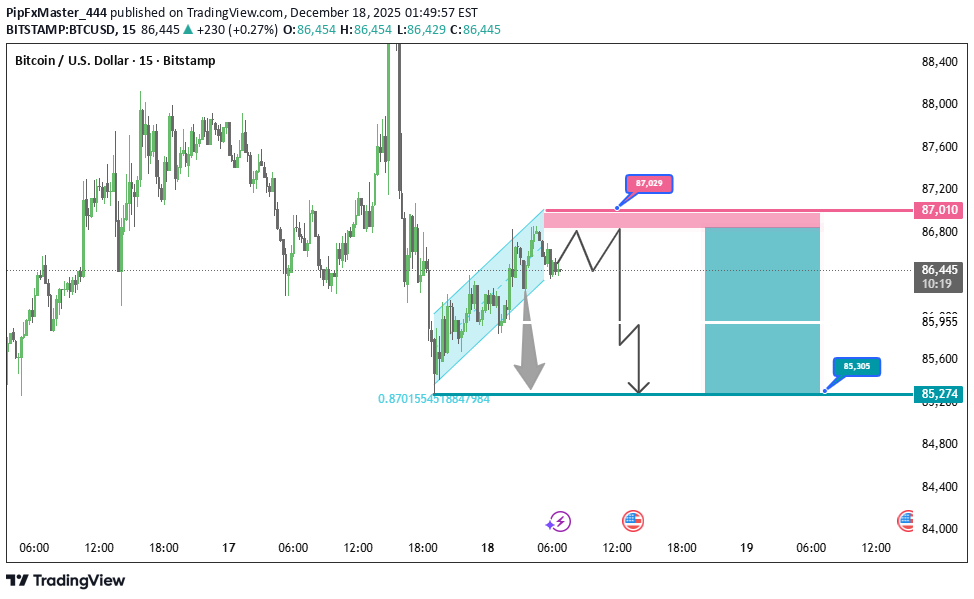
BTCUSD is showing bearish rejection on the M15 timeframe near a key resistance zone. Price failed to sustain above this level, and bearish candles indicate selling pressure. A downside move is expected if price respects this resistance. Entry: 86.780. 86.465 Stop Loss: 87.000 Target 1: 85.955 Final Target:85.274 Bias: Bearish Confirmation: Look for bearish candle close or rejection wick Risk Management: Follow proper risk-to-reward and avoid over-leverage Trade with confirmation. If resistance holds, sellers may control the move.
Gold (XAUUSD) M15– Sell Setup
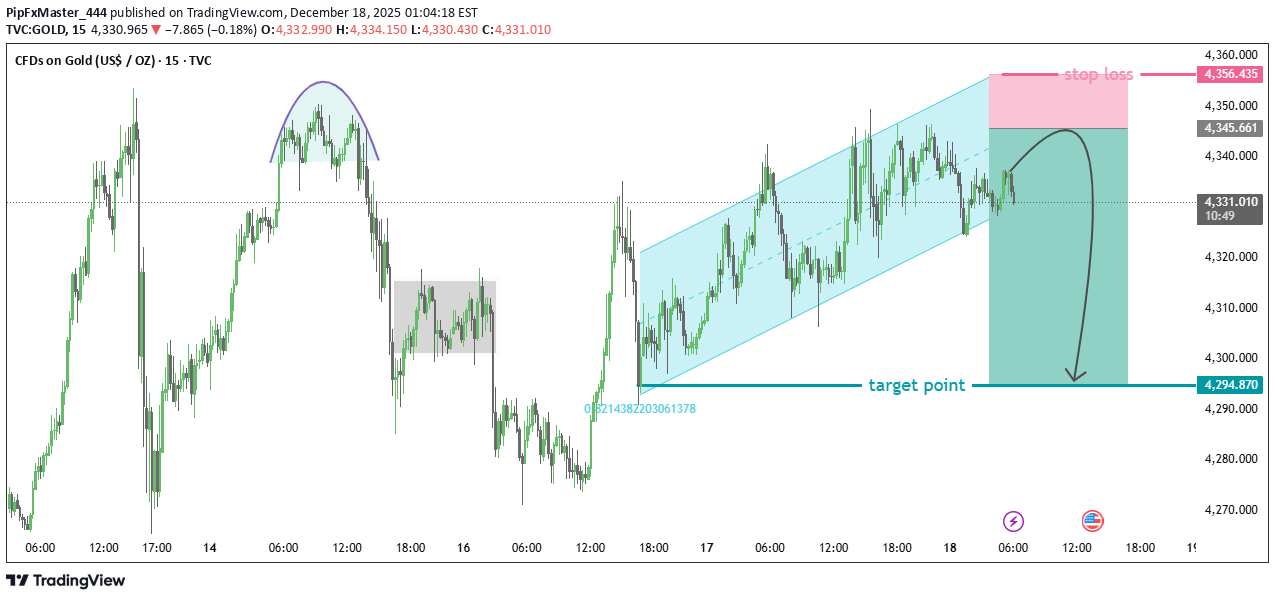
Trade Bias: Sell Entry: 4340. 4335 Stop Loss: 4356. Target:4294 Technical Reasons: - Price rejected from channel resistance - Bearish pullback after a weak high - Possible trend correction before continuation - Good risk-to-reward from resistance area
سیگنال خرید طلا (XAUUSD): فرصت صعودی قدرتمند در تایم فریم 4 ساعته!
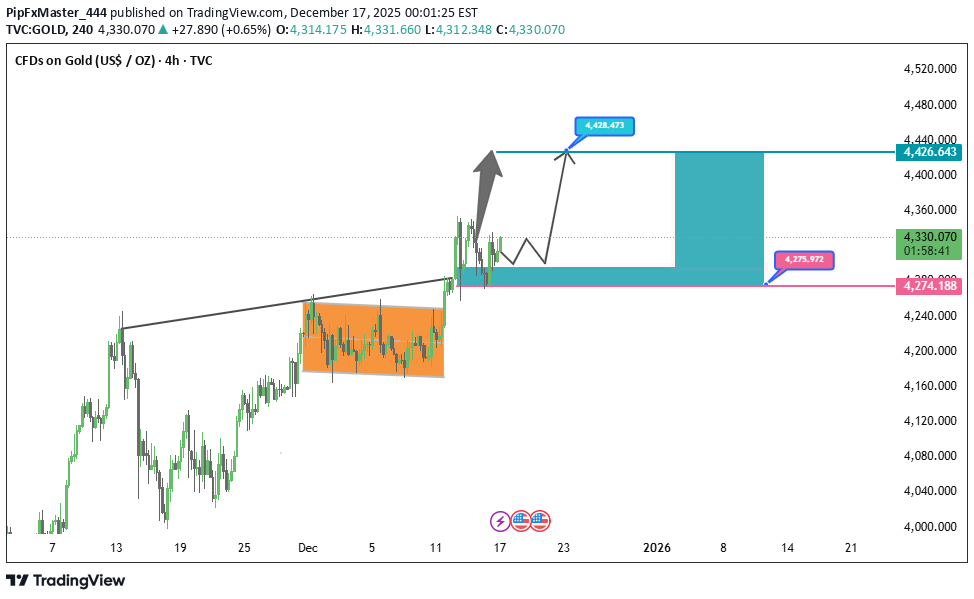
Bias: Bullish Gold is showing strong bullish momentum after breaking above the previous consolidation zone. Price has respected the ascending trendline and formed higher highs and higher lows, indicating trend continuation. A healthy pullback into the demand zone offers a good buying opportunity. As long as price holds above the key support area, bullish continuation toward the next resistance is expected. Trade Plan: - Buy Zone: 4325 – 4315 - Stop Loss: 4274 - Take Profit 1: 4350 - Take Profit 2: 4380 - Final Target: 4426
BTCUSD – H4 Timeframe – Bearish Setup
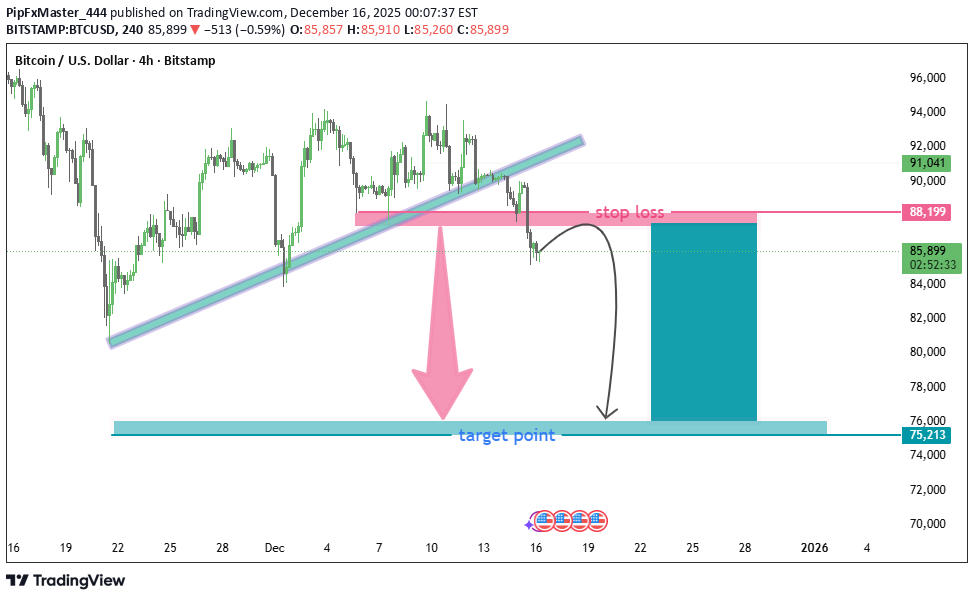
BTCUSD is showing a clear bearish structure on the H4 timeframe. Price has broken below the ascending trendline and is now respecting it as resistance. A supply zone is visible near the recent highs, from where strong selling pressure has appeared. This rejection from resistance confirms bearish momentum, and price is expected to move lower toward the major demand zone marked as the target area. Trade Plan: - Direction: Sell - Entry Zone: Around 85,500 – 85,800 - Stop Loss: Above 87,000 (above resistance & invalidation level) - Target Zone: 75,200 – 76,000 Bias: Bearish Risk Management: Use proper lot size and follow strict risk management. Wait for confirmation on lower timeframes before entry. This setup favors continuation to the downside as long as price remains below the broken trendline.
GOLD (XAUUSD) – Bullish Setup
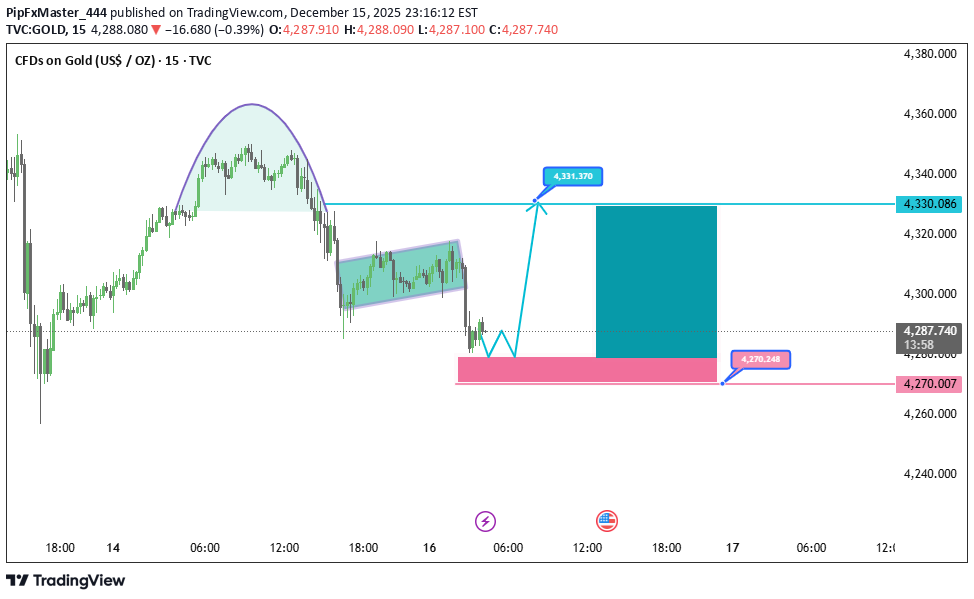
M30 Bias: Bullish Trade Idea: Gold is showing a bullish continuation after a consolidation phase. Price has respected the demand zone (highlighted in pink) and formed higher lows, indicating strong buyer interest. A breakout from the range confirms upside momentum. Entry Zone: 4288 – 4280 Stop Loss: 4270 (below the demand zone) Targets: TP1: 4304 TP2: 4315 Final Target: 4330 Analysis: As long as price holds above the demand zone, bullish pressure is expected to continue. Risk-to-reward is favorable, and buyers are in control unless the stop-loss level is broken.
GOLD (XAUUSD) – M30 Bullish Trade Setup
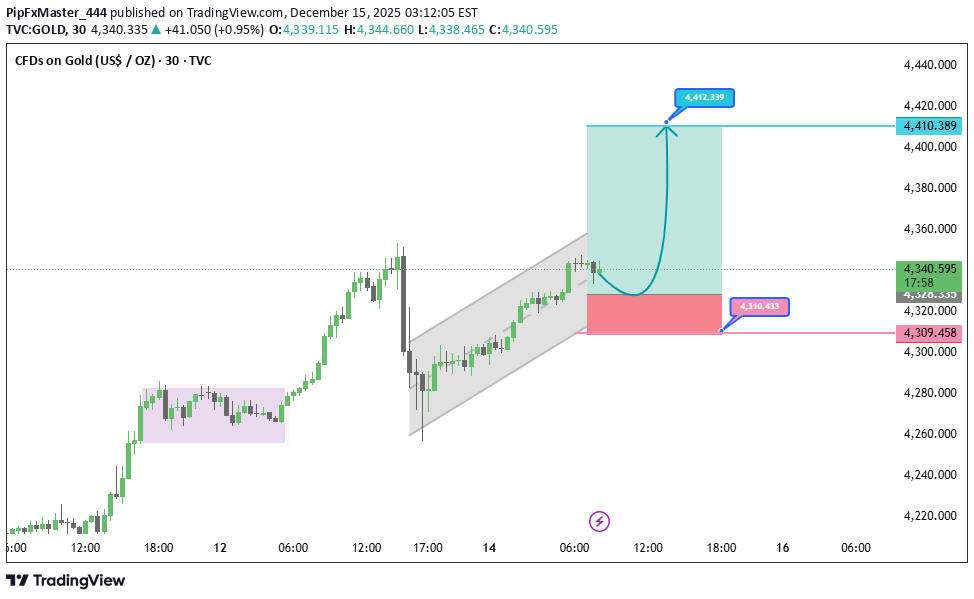
GOLD Buy Entry: Around 4340. 4327 Stop Loss: 4309 Take Profit: 4410 Technical Analysis: Bullish market structure on M30 Price holding above channel support Pullback into demand zone Bullish continuation expected toward resistance
GOLD (XAUUSD) H4 BULLISH SETUP
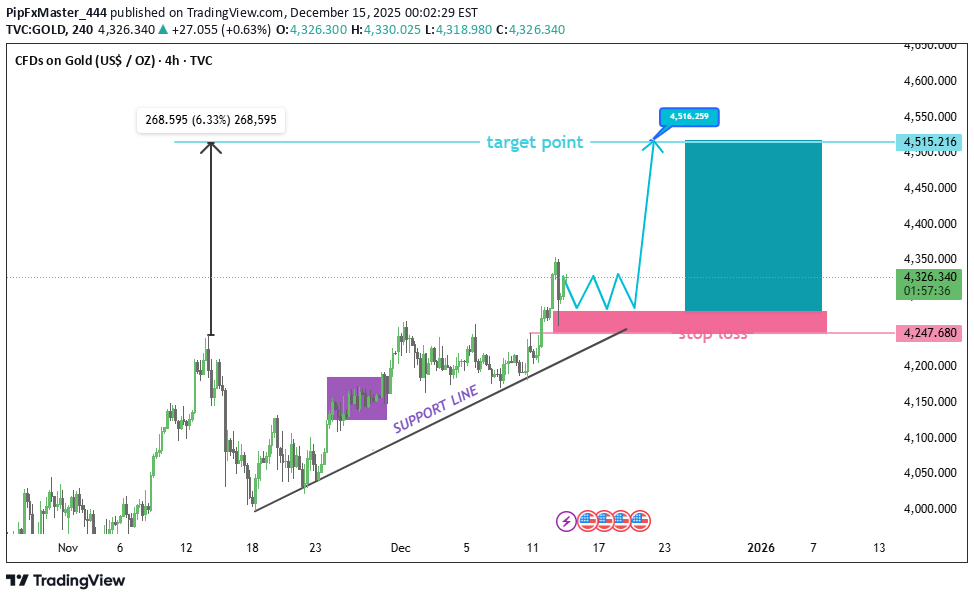
: Bias: Buy (Bullish) Entry Zone: 4322.00 4300.00 Stop Loss: Below the highlighted support zone (around 4247.680) Target: 4515.259 Technical Outlook: Price is holding above the rising support line. Bullish continuation pattern is forming after consolidation. Strong upside momentum is expected once price breaks above the minor resistance.
BTCUSD M30 BULLISH REVERSAL SETUP
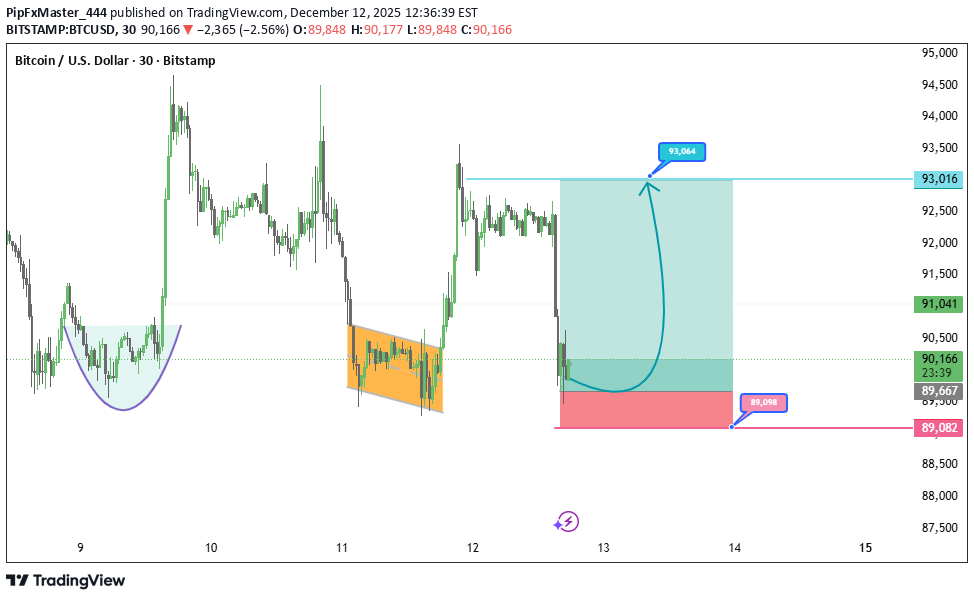
BTCUSD – 30M Buy Setup Price has entered a strong demand zone, where previous accumulation and bullish reaction were seen. The recent move down looks like a liquidity sweep, and the market is now showing signs of a potential reversal from the same zone. If price holds above this demand area, a bullish push toward the next liquidity level is expected. Trade Plan Buy Zone: Inside the blue demand area Stop Loss: Below the demand zone Target: 93,046 (as marked on your chart) This setup provides a clean reaction from demand with a clear upside target
Disclaimer
Any content and materials included in Sahmeto's website and official communication channels are a compilation of personal opinions and analyses and are not binding. They do not constitute any recommendation for buying, selling, entering or exiting the stock market and cryptocurrency market. Also, all news and analyses included in the website and channels are merely republished information from official and unofficial domestic and foreign sources, and it is obvious that users of the said content are responsible for following up and ensuring the authenticity and accuracy of the materials. Therefore, while disclaiming responsibility, it is declared that the responsibility for any decision-making, action, and potential profit and loss in the capital market and cryptocurrency market lies with the trader.