
Optimum369
@t_Optimum369

What symbols does the trader recommend buying?
Purchase History
پیام های تریدر
Filter
Optimum369
You Know: This Is Comprehensive Sell Trade setup

Core Analysis Method: Smart Money Concepts - 7 Dimension AnalysisThis analysis provides a short-term sell setup within a larger bullish swing structure, using liquidity levels, chart patterns, and volume to determine an ideal entry point for a pullback.😇 7 Dimension AnalysisTime Frame: H1Swing Structure:Bullish Structure with Break of Structure (BOS): The current structure remains bullish, with a BOS already confirmed. However, there are signs of a potential pullback.Inducement Complete: Liquidity has been gathered in previous moves, indicating a probable short-term correction.Current Price Zone: The price is positioned in a discounted zone, making it an attractive area for initiating a short position during this pullback.Point of Interest (POI): Key Order Block (OB) and Fair Value Gap (FVG) areas are located around the 2724 price level, with liquidity resting here.Pattern:🟢 Chart Patterns:A Rounding Top and Triple Top formation is present at the swing’s high, which could signal a reversal or the start of a Deep corrective move.🟢 Candle Patterns:A Double Bottom is forming, with the last candle closing as an inside bar and showing bullish support. This pattern suggests a potential short-term rally toward the FVG area before resuming a bearish correction.Volume:Sell-side volume is showing strength, indicating the presence of sellers and supporting a potential downside move within this pullback.Momentum (RSI):🟢 Momentum shows the price in a super bearish zone with signs of weakening bullish strength.A bearish divergence is visible at the top, suggesting a decline in bullish momentum and adding weight to a probable short-term reversal.Volatility (Bollinger Bands):🟢 After a contraction, a squeeze breakout has been observed, with the price walking along the band. This formation often points to strong momentum, and in this case, it supports the downside breakout and potential continuation of the bearish pullback.Strength (ROC & DMI):Rate of Change (ROC) indicates an increasing bearish trend.Bear DMI Line is above the 20 level, with an upward ADX curve, indicating that bearish strength is building.Rating: ⭐⭐⭐Probability: 60%The overall analysis suggests a moderate confidence level, with strong indicators for a short-term bearish correction within a larger bullish swing structure.Trade Setup:Entry Details:Entry Time Frame: M5Entry TF Structure: BearishPoint of Interest (POI): FVGTrade Execution:💡 Decision: Sell Limit🚀 Entry: 2753✋ Stop Loss: 2763🎯 Take Profit: 2725😊 Risk to Reward Ratio: 3.5 RR🕛 Expected Duration: 1 DaySUMMARY:This setup aims to capture a bearish correction within a bullish structure on the H1 timeframe. Key reversal patterns, such as the Triple Top and bearish divergence on RSI, alongside increased sell-side volume, suggest potential for a short-term downward move. A Sell Limit order is planned around 2753, targeting a quick pullback to 2725, with a favorable risk-to-reward ratio of 3.5 RR.
Optimum369
1:5 risk to reward buy setup for Gold

Core Analysis Method: Smart Money ConceptsHere’s the analysis based on the Smart Money Concepts methodology:😇 7 Dimension AnalysisTime Frame: 5MSwing Structure:The market structure is strongly bullish with liquidity resting in a key area at the extreme POI. The Inducement has been taken, and the corrective swing move has reached its lowest levels, showing two pullbacks. The internal structure supports this corrective move, with Order Blocks (OB), Sell Order Blocks (SOB), Fair Value Gaps (FVG), and liquidity marked as Points of Interest (POI) in the Discounted zone, making this setup powerful.Support & Demand are also located in the POI zone, making this setup favorable for bullish momentum.Pattern:🟢 Chart Patterns:A Rectangle pattern is forming, so patience is required to see how it plays out.🟢 Candle Patterns:Candle patterns will be considered once the price reaches the POI.Volume:No notable volume observations at this point.Momentum RSI:Skipped for this analysis.Volatility Bollinger Bands:Skipped for this analysis.Strength ADX:Skipped for this analysis.Rating: ⭐⭐⭐ (3 Stars)Probability: 50%The probability is moderate, indicating a balanced risk/reward scenario.✔️ Entry Time Frame: 5M✅ Entry TF Structure: Bullish☑️ POI: Extreme unmitigated OB💡 Decision: Buy Limit🚀 Entry: 2494✋ Stop Loss: 2484🎯 Take Profit: 2545😊 Risk to Reward Ratio: 5 RR🕛 Expected Duration: 1 Day (D1)SUMMARY:This setup on the 5-minute timeframe suggests a potential buying opportunity as the market is in a bullish structure, and key Points of Interest align at the Discounted zone. The Rectangle chart pattern forming adds to the likelihood of a potential move. The trade setup has a moderate probability with a 5:1 risk-to-reward ratio. The entry is planned at 2494, with a tight stop loss at 2484 and a target at 2545. Given the lack of significant volume, momentum, volatility, and strength indicators, this trade is more speculative and should be monitored closely as the price approaches the POI.and now toward profit arget
Optimum369
7 Dimension 1:8 RR Sell Idea for GOLD

Core Analysis MethodSmart Money Concepts😇 7 Dimension AnalysisTime Frame: 15 min1: Swing Structure: Bearish with CHOCH after taking inducement. The impulsive swing move is finished and now moving towards the decisional OB as a pullback, about to mitigate the decisional POI OB at the initial point of the premier zone. We will take a sell entry using the classic SMC entry model. After the breakout, this is also a CIP area.2: Pattern🟢 CHART PATTERNSReversal: V-shape pattern indicating possible reversal from here and a rectangle pattern is also observed.Shakeout.🟢 CANDLE PATTERNSNot any significant candle pattern observed except for a tower top.3: Volume🟢 A big difference is seen during the impulsive move and the correction move in terms of volume. No buy-side volume indicates another sharp sell move is expected.4: Momentum RSI🟢 Fully intact in the bearish zone, taking resistance at the 60 level, indicating another range shift. This impulsive move ended as loud moves, which is a very strong signal for a sell. Also, a Grandfather-Father-Son entry with H4 as GF.5: Volatility Bollinger Bands🟢 Very tight contraction just started, indicating a strong squeeze breakout and walking on the band. A headfake also took place right at the upper band, and a BB W pattern is observed.6: Strength ADXRight now, totally sideways.7: Rating: ⭐⭐⭐ 50% Probity (because of the decisional OB entry)✔️ Entry Time Frame: 15M✅ Entry TF Structure: Bearish CHOCH☑️ POI: Decisional OB💡 Decision: Sell limit🚀 Entry: 2419✋ Stop loss: 2429.5🎯 Take profit: 23.4😊 Risk to reward Ratio: 1:8🕛 Expected Duration: 1 daySUMMARY: The analysis indicates a sell position based on Smart Money Concepts methodology, with structure, patterns, volume, momentum, volatility, strength, and sentiment all pointing towards a bearish move.Accept your Stoplose
Optimum369
7 Dimensions Idea for BUY Gold

CORE Analysis Method: Smart Money Concept😇 7 Dimension AnalysisTime Frame: H11️⃣ Swing Structure: Bullish🟢 Structure Behavior: Break of Structure (BoS)🟢 Swing Move: Impulsive🟢 Pull Back: 2🟢 Internal Structure: Bullish🟢 External Order Block (OB): Mitigated🟢 Support & Demand: Start Accumulation from discounted area🟢 Time Frame Confluence: H4 and H1 POI2️⃣ Pattern🟢 CHART PATTERNS:W pattern formed at major swingContinuation: Falling Wedge with proper breakout and retest, aligning with the breakout level and Fair Value Gap (FVG) level, making this area a high-probability POI for buyers🟢 CANDLE PATTERNS:Record Session Count (RSC) detected, indicating a correction towards 2404Long wick candle at the bottom of RSC indicates bullishnessEngulfing and Kicker Sash patterns indicate bullish control at 24033️⃣ Volume🟢 Volume during Correction: Dried up but now showing good volume as price moves upward4️⃣ Momentum🟢 RSI: Indicates full bullishness according to Grandfather Father Strategy5️⃣ Volatility Bollinger Bands🟢 Middle Band: Supported, contraction during retracement indicating potential range formation🟢 Band Puncher: Lower band puncher indicates bullish strength6️⃣ Strength According to ROC: Bullish7️⃣ Sentiment: Bullish✔️ Entry Time Frame: 5 minutes✅ Entry TF Structure: Bullish with 5-minute swing liquidity sweep☑️ Current Move: Impulsive in entry time frame☑️ FIB Trigger Event: Triggered☑️ Trend Line Breakout: Done💡 Decision: Buy🚀 Entry: 1st entry at 2406, 2nd entry at 2397✋ Stop Loss: 1st at 2399, 2nd at 2391🎯 Take Profit: 2441😊 Risk to Reward Ratio: 7.5🕛 Expected Duration: 2 daysSUMMARYThis analysis identifies a bullish swing structure on the H1 time frame with a proper BoS and impulsive moves. The internal structure remains bullish, supported by a mitigated external OB and accumulation at the discounted area. The pattern analysis highlights a W pattern and a falling wedge breakout with a retest, positioning this area as a high-probability POI for buyers. Candlestick patterns further confirm bullish control, supported by favorable volume and momentum indicators.The sentiment is bullish with key indicators such as RSI and Bollinger Bands supporting an upward move. Entry points are identified at 2406 and 2397 with respective stop losses and a target take profit at 2441, providing a risk to reward ratio of 7.5. The expected duration for this trade setup is 2 days, contingent on continued bullish momentum and price behavior as outlined.
Optimum369
7 Dimension Sell Setup for Gold
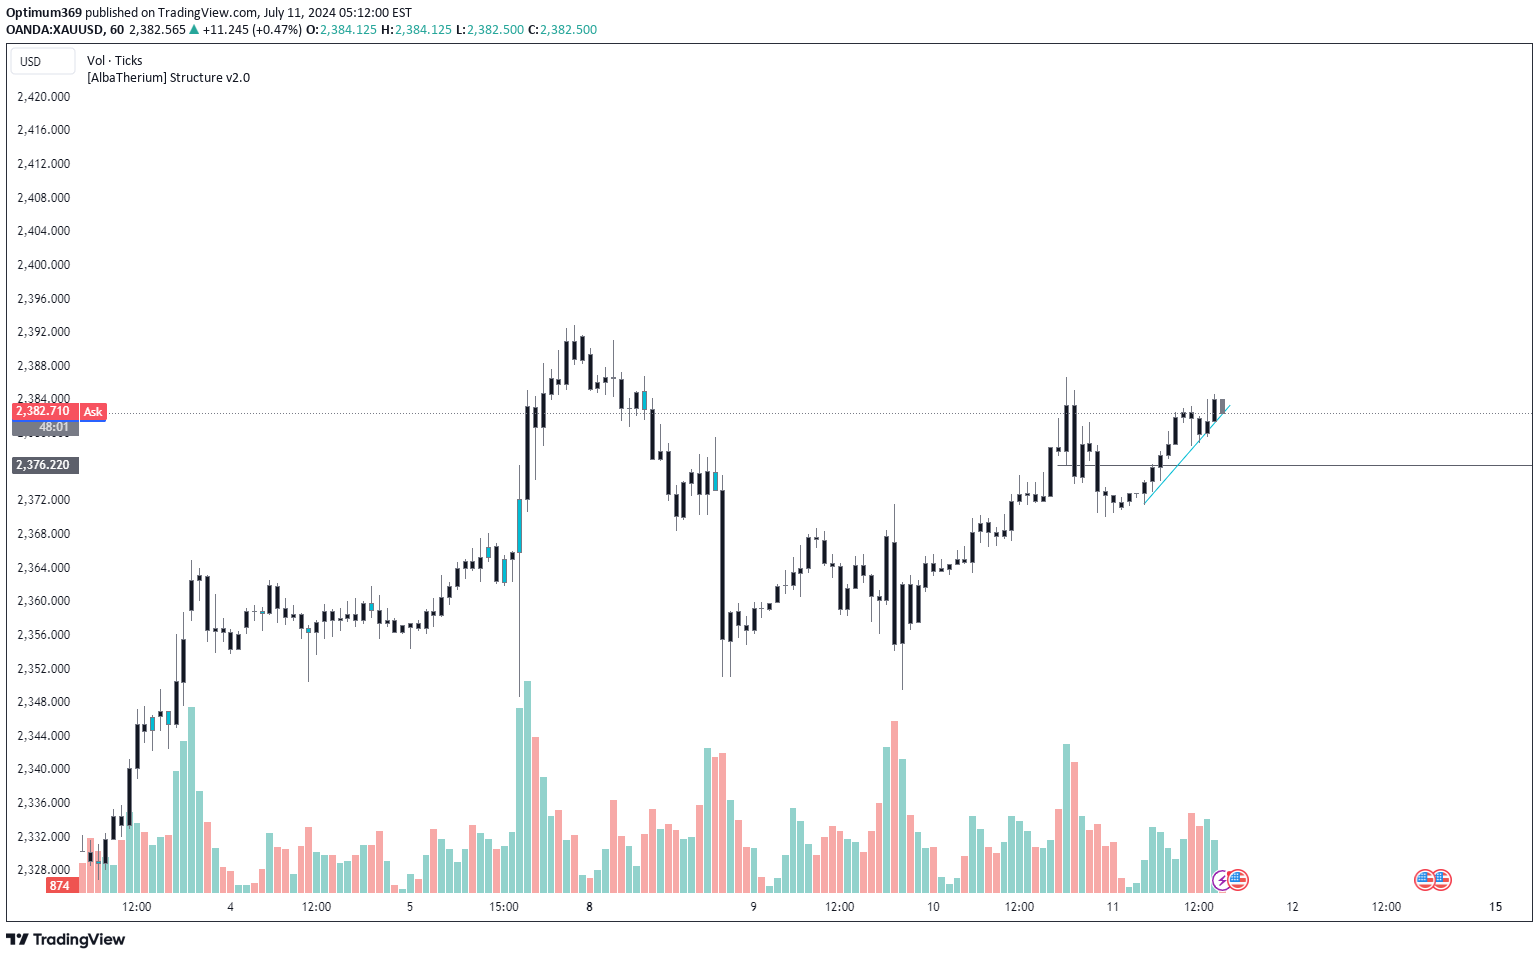
Technical Analysis Method SMC ** 7 Dimension Analysis**Time Frame: H1 / 5M (Minute)1: Swing Structure: Bearish🟢 Structure Behavior: Choch, now at this extreme POI (Point of Interest) 🟢🟢 Swing Move: Corrective (about to end) ↪️🟢 Lower Time Frame (M1): Inducement is done. It's better to wait for M1 structure shift. ⛔🟢 Internal Structure: Bullish yet ⬆️🟢 Supply Area: Based on M5 timeframe 🟦2: Pattern🟢 CHART PATTERNS: No reversal chart pattern detected yet. ⬜🟢 CANDLE PATTERNS: Record Session count3: Volume🟢 After a good rally, volume is drying up now. **🟢 Volume during correction is less than impulsive volume. **4: Momentum RSICurrent: Bullish to sideways with proper bearish divergence and range shift. **5: Volatility Bollinger Bands🟢 Middle band is interim support yet. 🟦🟢 Price is currently in a contraction phase, making a Bollinger Band "W" pattern with the complete leg about to end. ➡️🟢 High with a pin bar price also indicates a Band Puncher. **6: Strength (ROC - Not Included)7: Sentiment: Bearish for M5 SMC (Smart Money Concept) timeframe✔️ Entry Time Frame: M5✅ Entry TF Structure: Bearish☑️ Current Move: Correction at extreme POI ☑️☑️ Resistance Area: Gives multiple rejections ❌☑️ Candle Behavior: Not clear ⬜☑️ Trend Line Breakout: Waiting ⏳** Decision:** Sell if price gives a breakout of the trend line ⬇️** Entry:** 2381✋ Stop Loss: 2387 Take Profit:** 2355Risk-to-Reward Ratio:** 3.5 Expected Duration:** One daySUMMARY:Based on the multi-timeframe analysis, a potential short selling opportunity exists with a bearish bias. The current corrective move might be nearing its end at the extreme POI. However, waiting for confirmation from a bearish breakout on the M5 timeframe and a clear bearish candle pattern is recommended before entering a trade. Remember, this analysis should not be considered financial advice.
Optimum369
7 Dimension Analysis For Gold

Core Analysis System (SMC)1 Price, 2 pattrens, 3 Volume ,4 Volitality, 5 Momentum, 6 Time, 7 Sentiments🕛 TOPDOWN AnalysisH1 shows a bullish structure with price successfully touching its extreme Point of Interest (POI). Afterward, it provides a bullish confirmation, indicating readiness for a bullish position on the 5-minute timeframe.😇 7 Dimension AnalysisTime Frame: 5 MIN1️⃣ Swing Structure: Bullish with Confirmation (Choch)🟢 Swing Move: Corrective move towards mitigating the 5-min Extreme POI🟢 Inducement: Taken with the first deep pullback for this swing🟢 Strongest Demand: Accumulation on the Discounted Zone supporting the bulls🟢 Traps: False Breakout observed🟢 Time Frame Confluence: H4, H1, and M52️⃣ Pattern🟢 CHART PATTERNS: Triple bottom reversal with a massive shakeout indicating a reversal🟢 CANDLE PATTERNS: To be observed upon price reaching the execution level3️⃣ Volume🟢 Fixed Range: Volume on Fake Out observed to be massive compared to previous🟢 Volume during Correction: No significant volume indicating weaker sellers4️⃣ Momentum RSI🟢 Divergence and Loud Bullish Move: Observed at the start, with the price still in the bullish zone above 40🟢 Oversold Rejections: Indicating bullish sentiment5️⃣ Volatility Bollinger Bands🟢 Volatility Contraction Phase: Suggesting a Squeeze breakout is expected with Walking on the band scenario6️⃣ Strength According to ROC🟢 Gold Stronger than Dollar: For this week7️⃣ SentimentGold expected to undergo a short bigger timeframe correction✔️ Entry Time Frame: M5☑️ FIB Trigger event: Awaited☑️ Trend line breakout: Awaited💡 Decision: Buy🚀 Entry: 2296✋ Stop loss: 2290🎯 Take profit: 2380 (If Internal Structure changes)😊 Risk to Reward Ratio: 14🕛 Expected Duration: 3 Days📚 SUMMARY: The analysis indicates a bullish sentiment with various patterns and indicators suggesting a potential buying opportunity on the 5-minute timeframe. High volume on the Fake Out and absence of volume during correction hint at weaker sellers. Traders are advised to monitor candle patterns upon reaching the execution level and consider a buy position with a favorable risk-to-reward ratio of 14 over an expected duration of 3 days.
Optimum369
7 Dimension Analysis for GOLD

😇 7 Dimension Analysis Time Frame: H4 1️⃣ Swing Structure: Bullish 🟢 Structure Behavior: Breakout of Structure (BoS) 🟢 Swing Move: Impulsive 🟢 Internal Structure: Bullish 🟢 Decisional OB: Mitigated with liquidity sweep 🟢 Fake out at Support: Confirms high demand in this area 🟢 Trendline broke 🟢 Traps: Fakeout reversal at swing points and also at internal 15 min 🟢 Time Frame Confluence: H4 2️⃣ Pattern 🟢 CHART PATTERNS: Reversal, Double bottom with liquidity sweep 🟢 CANDLE PATTERNS: Record Session count observed, Shrinking Change in guard also at the same point but unable to breach the previous candle low. Momentum: strict engulfing at the bottom where the move started, Fakeout, FOMO both types of candles also here. Gaps (Novice, Pro, Window) awaiting, Tweezer (2nd big), Inside (last close), Open low / high awaiting. Climax players entered into the market but the market shook out all of them. 🟢 Volume: Fixed Range; observing only buy volumes at the bottom of the move, same fakeout area; either markets give us bearish moves but all volume is on the bull's side. Massive Volume at Fake Out indicates a strong reversal. 4️⃣ Momentum RSI 🟢 Zone: After making several supports at support, it confirms the bulls are still in power 🟢 Range shift: Still in bullish 🟢 Divergence: A robust bullish divergence observed at the bottom area 5️⃣ Volatility Bollinger Bands 🟢 Middle band above 🟢 After Contraction, now Expansion is started 🟢 Squeeze breakout with a volatile candle gives a proper upper outside close 🟢 Walking on the band is intact 🟢 Headfake at the bottom indicates a strong upside move just started 🟢 W completed 🟢 Dual band derivation in favor 6️⃣ Strength According to ROC 🟢 Values: 9.94; highest in commodities 7️⃣ Sentiment ☑️ Trend line breakout done 💡 Decision: Buy at opening, entry time frame 15 min 🚀 Entry: 2049 ✋ Stop Loss: 2035 🎯 Take Profit: 2070 2nd Exit if Internal Structure changes, also Exit 3rd trendline breakout, FOMO 😊 Risk to Reward Ratio: 1.5 🕛 Expected Duration: 2 days 📚 SUMMARY: The analysis suggests a bullish stance with a confirmed breakout in various dimensions, including structure, volume, and RSI divergence. The entry at the opening is recommended, anticipating further upside moves. The risk-to-reward ratio is balanced, and the expected duration is short-term, emphasizing a quick response to market dynamics.
Optimum369
7 dimension analysis Gold

🕛 TOPDOWN Analysis - Patience Required Amidst Supply SignalsOverview: The market presents an intriguing picture with four consecutive long-wick candles at the top, signifying a robust supply area. Big players seem hesitant to push prices higher than the previous high, warranting a watchful approach, especially in the context of the yearly chart. On the monthly chart, there is a clear uptrend with a well-defined cup and handle pattern. A substantial buildup at resistance levels suggests a wait-and-see stance, primarily for investors. The weekly chart signals a shift in the price dynamic, indicating bearish control until the last demand area or the next swing target zone.😇 7 Dimension AnalysisTime Frame: Daily1️⃣ Swing Structure: Bearish🟢 Structure Behavior: Breakout from Sideways (BoS).🟢 Swing Move: The impulsive move has achieved its target.🟢 Inducement: Awaiting confirmation; additional sell entry planned.🟢 Pull Back: A solid second pullback.🟢 Internal Structure: Bearish.🟢 Support or Demand Area: Identified as the next profit booking target, decisions will follow after booking profits. Awaiting Support Breakout/CIP at 1899.2️⃣ Pattern🟢 CHART PATTERNSContinuationDescending Triangle break signals a target around 1827.🟢 CANDLE PATTERNSNotable Observations:A record session count with eight consecutive bear candles suggests potential continuation until the target.Momentum indicates bearish candle formation.3️⃣ Volume:Volume has been substantial during the entire move, with no signs of weakening.Volume on the breakout consistently indicates lower volume at base levels followed by significant volume during the follow-up.4️⃣ Momentum RSI:🟢 Zone: Super bearish.🟢 Loud Moves: Price movement transitioning from sideways to bearish, indicating expectations of further bearishness.🟢 Overbought/Sold Rejections: Currently count at 0.5️⃣ Volatility Bollinger Bands:🟢 Move Commencement: Following a Squeeze spanning over 10 candles in the range.🟢 Squeeze Breakout: Expectation of a move outside the lower band.🟢 Walking on the Band: Ongoing trend adherence, with price respecting this trend.6️⃣ Strength ADX:Bears currently exhibit complete control in the market at this point.7️⃣ Sentiment ROC:Indicates that this is the weakest commodity in the last week.✔️ Entry Time Frame: H1✅ Entry TF Structure: Bearish☑️ Current Move: Impulsive.✔ Support Resistance Base: Last established base.☑️ Candles Behavior: Reflects characteristics like RSC, Longwicks, Doji, and Inside candles.☑️ FIB Trigger Event: To be assessed at the sell area.☑️ Trend Line: To be drawn once the price reaches the sell area.☑️ Final Comments: Waiting for the right moment to sell.💡 Decision: Sell at correction.🚀 Entry: 1870✋ Stop Loss: 1884🎯 Take Profit: 1820, 2nd Exit if Internal Structure Changes, 3rd Exit on a trendline breakout or FOMO signal.😊 Risk to Reward Ratio: 1:3.5🕛 Expected Duration: 7 daysSUMMARY: The market exhibits a strong supply area with a need for vigilance. Various charts, including the yearly, monthly, and weekly, provide insights into the bearish sentiment. The daily analysis indicates a bearish structure with planned sell entries. Volume, momentum, and candle patterns further support the bearish outlook. Patience is advised for a well-timed sell. Specific entry, stop-loss, and take-profit levels are provided, with a risk-reward ratio of 1:3.5.
Optimum369
7 Dimension Analysis For GOLD /XAU

😇 7 Dimension AnalysisTime Frame: Daily1️⃣ Swing Structure: Bullish🟢 Structure Behavior: A bullish Choch was completed on July 18th.🟢 Swing Move: After Choch The corrective phase is nearing its target zone.🟢 Inducement: Waiting for a reversal inducement to confirm the low and enter an impulsive move.🟢 Pullback: Following a substantial corrective swing, the first impulsive pullback has occurred, showcasing notable strength based on historical data. Extreme Order Block has been mitigated, providing a favorable demand signal.Time Frame Confluence: Daily and Weekly🟢 Internal Structure: A bullish Choch has been established, and the corrective move has been completed.🟢 Trendline Breakout: The initial signal for entry or exit is a trendline breakout. Currently awaiting a breakout above trendline resistance and CIP (Change in Polarity).🟢 Chart Patterns:A reversal pattern of a Head and Shoulders formation is evident.An upside breakout from the Falling Wedge pattern will confirm the setup.🟢 Candle Patterns:Relevance is observed, confirming the demand zone based on various studies.Doji: GravestoneMomentum: A strict engulfing pattern; there seems to be FOMO selling at this point.Inside Bar: Today's candle is inside the previous momentum candle and forming gravestone candle.Climax players appear to be entering the market, potentially indicating FOMO selling at the support trendline.3️⃣ Volume:Significant volumes are evident throughout the entire move, suggesting a significant event. Despite substantial volume, price movement remains subdued. This volume divergence could imply an impending sharp move upon breaking above the resistance trendline. Volume during the entire swing cycle is impressive.4️⃣ Momentum RSI:🟢 Zone: Currently in a sideways zone.🟢 Range Shift: Shifting from Bearish to Sideways, finding support at the 40 level.5️⃣ Volatility Bollinger Bands:🟢 A Headfake-type formation is emerging at the swing high, although it is yet to be confirmed.🟢 The last leg is expected to start, with a high likelihood of initiating a reversal.6️⃣ Strength ADX:According to ADX, the market is mostly sideways, with bears holding a slight advantage over bulls.7️⃣ Sentiment ROC:The Rate of Change indicates that Gold is stronger than USD, providing clarity in sentiment.✔️ Entry Time Frame: H1✅ Entry TF Structure: Bearish, yet the move is nearing completion, potentially prompting a reversal.☑️ Current Move: Impulsive, waiting for confirmation through internal bullish choch or trendline breakout.☑️ Candles Behavior:Observing Record Session Count, Longwicks, Doji, Inside Bars, and Momentum patterns, all suggesting possible reversals.☑️ FIB Trigger Event: Already occurred, indicating a swing liquidity sweep.☑️ Trendline Breakout: Awaiting confirmation.☑️ Final Comments: Plan to buy upon trendline breakout.💡 Decision: Buy🚀 Entry: Approximately 1934✋ Initial Stop Loss: Placed at 1911, to be trailed to 1920 once price surpasses 1938. Additional position to be added in gold.🎯 Take Profit: Initial target at 1999, considering secondary exits based on changes in internal structure or trendline breakout, including potential FOMO action.😊 Risk to Reward Ratio: 1:5🕛 Expected Duration: 20 DaysSummary:The comprehensive analysis indicates a bullish swing structure with potential impending reversals. Various chart patterns, candlestick formations, volume dynamics, and momentum factors are considered for this analysis. The planned entry strategy involves awaiting a trendline breakout. The expected trade duration is 20 days, with a risk-to-reward ratio of 1:5.If YOU want become a professional trader and analysis like this don't hesitate contact my any time
Optimum369
20 Reasons for Buy GOLD

🔆 MULTI-TIME FRAME TOP-DOWN ANALYSIS OVERVIEW ☀️✨Eagle Eye: Strongly bullish with a potential for a minor correction📆 Monthly: Currently in an uptrend with a minor corrective phase. The market has engulfed the last 3 months' move with a high chance of moving upward.📅 Weekly: A clean uptrend with a BOS indicating a short correction before moving up again this week.🕛 Daily: A proper break of structure with a classic cup and handle pattern and substantial buildup. All bullish signs are present, making it a good time to enter for a buy entry.😇 7 Dimension Analysis🟢 Analysis Time Frame: Daily1 Price Structure: Bullish2 Pattern Candle Chart: Cup and handle pattern with confirmed breakout after buildup3 Volume: Volumes increased at the 2nd breakout, but not significantly strong4 Momentum UNCONVENTIONAL RSI: Clearly in the super bullish zone5 Volatility Measure Bollinger Bands: M-type patterns not suitable for bulls, with a short reversal expected6 Strength ADX: Bull DMI cross-bulls have taken control, with a correction expected7 Sentiment ROC: The USD shows strength this week.✔️ Entry Time Frame: H412. Entry TF Structure: BullishEntry Move: We need a reversal nowSupport Resistance Base: Lower side trend line support at presentFIB: Corrective move started☑️ Final Comments: The corrective move is expected to complete around the 1980 area.16. 💡Decision: Buy🚀Entry: 1982✋Stop Loss: 1970🎯Take Profit: 2070😊Risk to Reward Ratio: 1:4🕛 Expected Duration: 5 days.
Disclaimer
Any content and materials included in Sahmeto's website and official communication channels are a compilation of personal opinions and analyses and are not binding. They do not constitute any recommendation for buying, selling, entering or exiting the stock market and cryptocurrency market. Also, all news and analyses included in the website and channels are merely republished information from official and unofficial domestic and foreign sources, and it is obvious that users of the said content are responsible for following up and ensuring the authenticity and accuracy of the materials. Therefore, while disclaiming responsibility, it is declared that the responsibility for any decision-making, action, and potential profit and loss in the capital market and cryptocurrency market lies with the trader.