
OceanStaker
@t_OceanStaker

What symbols does the trader recommend buying?
Purchase History
پیام های تریدر
Filter
OceanStaker
پیشبینی شگفتانگیز لایتکوین: آیا رسیدن به ۲۸۰ دلار قطعی است؟
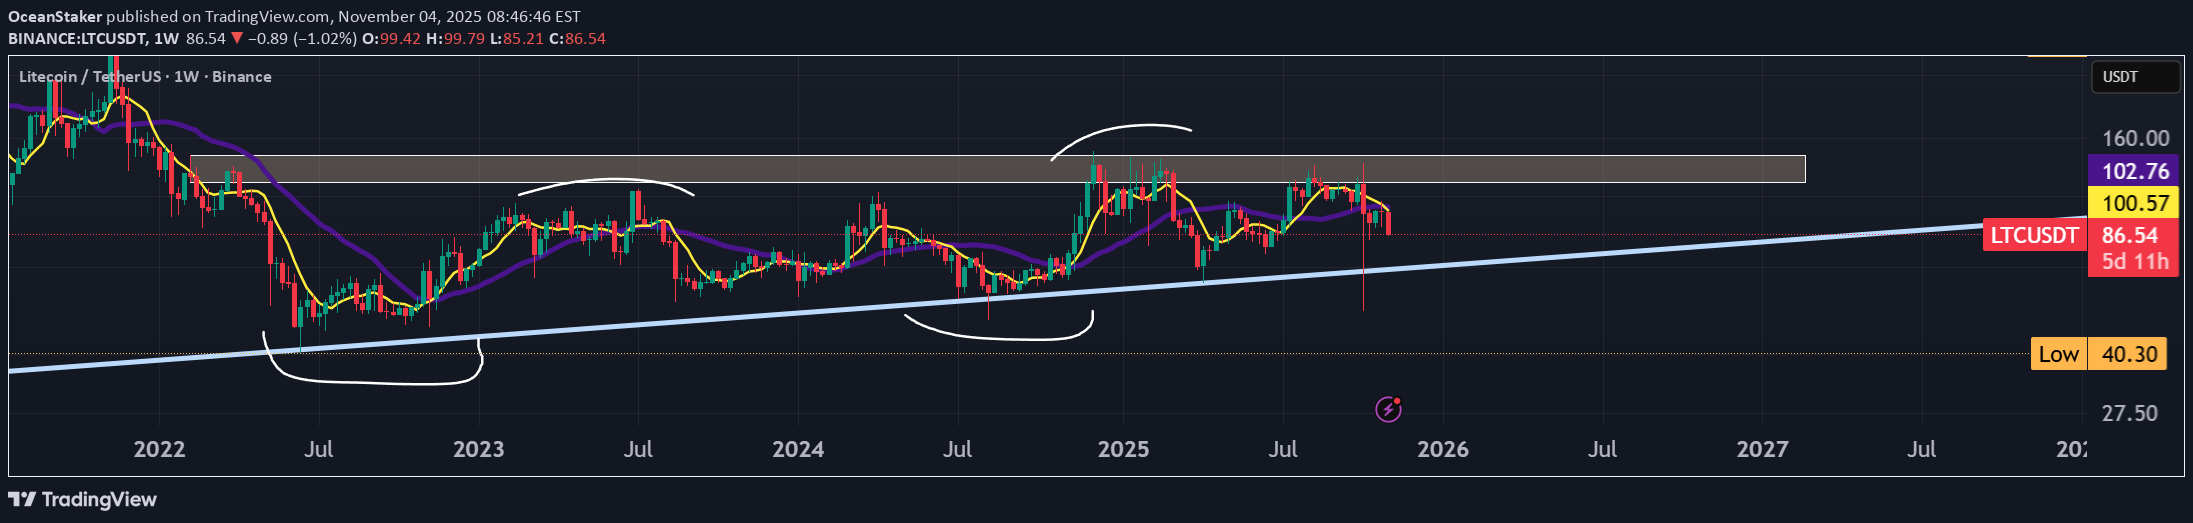
LTC is still holding its long-term trend from 2020. The price is currently accumulating between the $130 resistance and the 2020 trendline support. It continues its path by forming higher highs and higher lows. Once RSI cools down and MACD confirms a breakout, the first target (TP1) can be considered around $280.
OceanStaker
تحلیل تکنیکال ADA: رمزگشایی الگوی "قدرت سه تایی" (PO3) برای صعود بزرگ
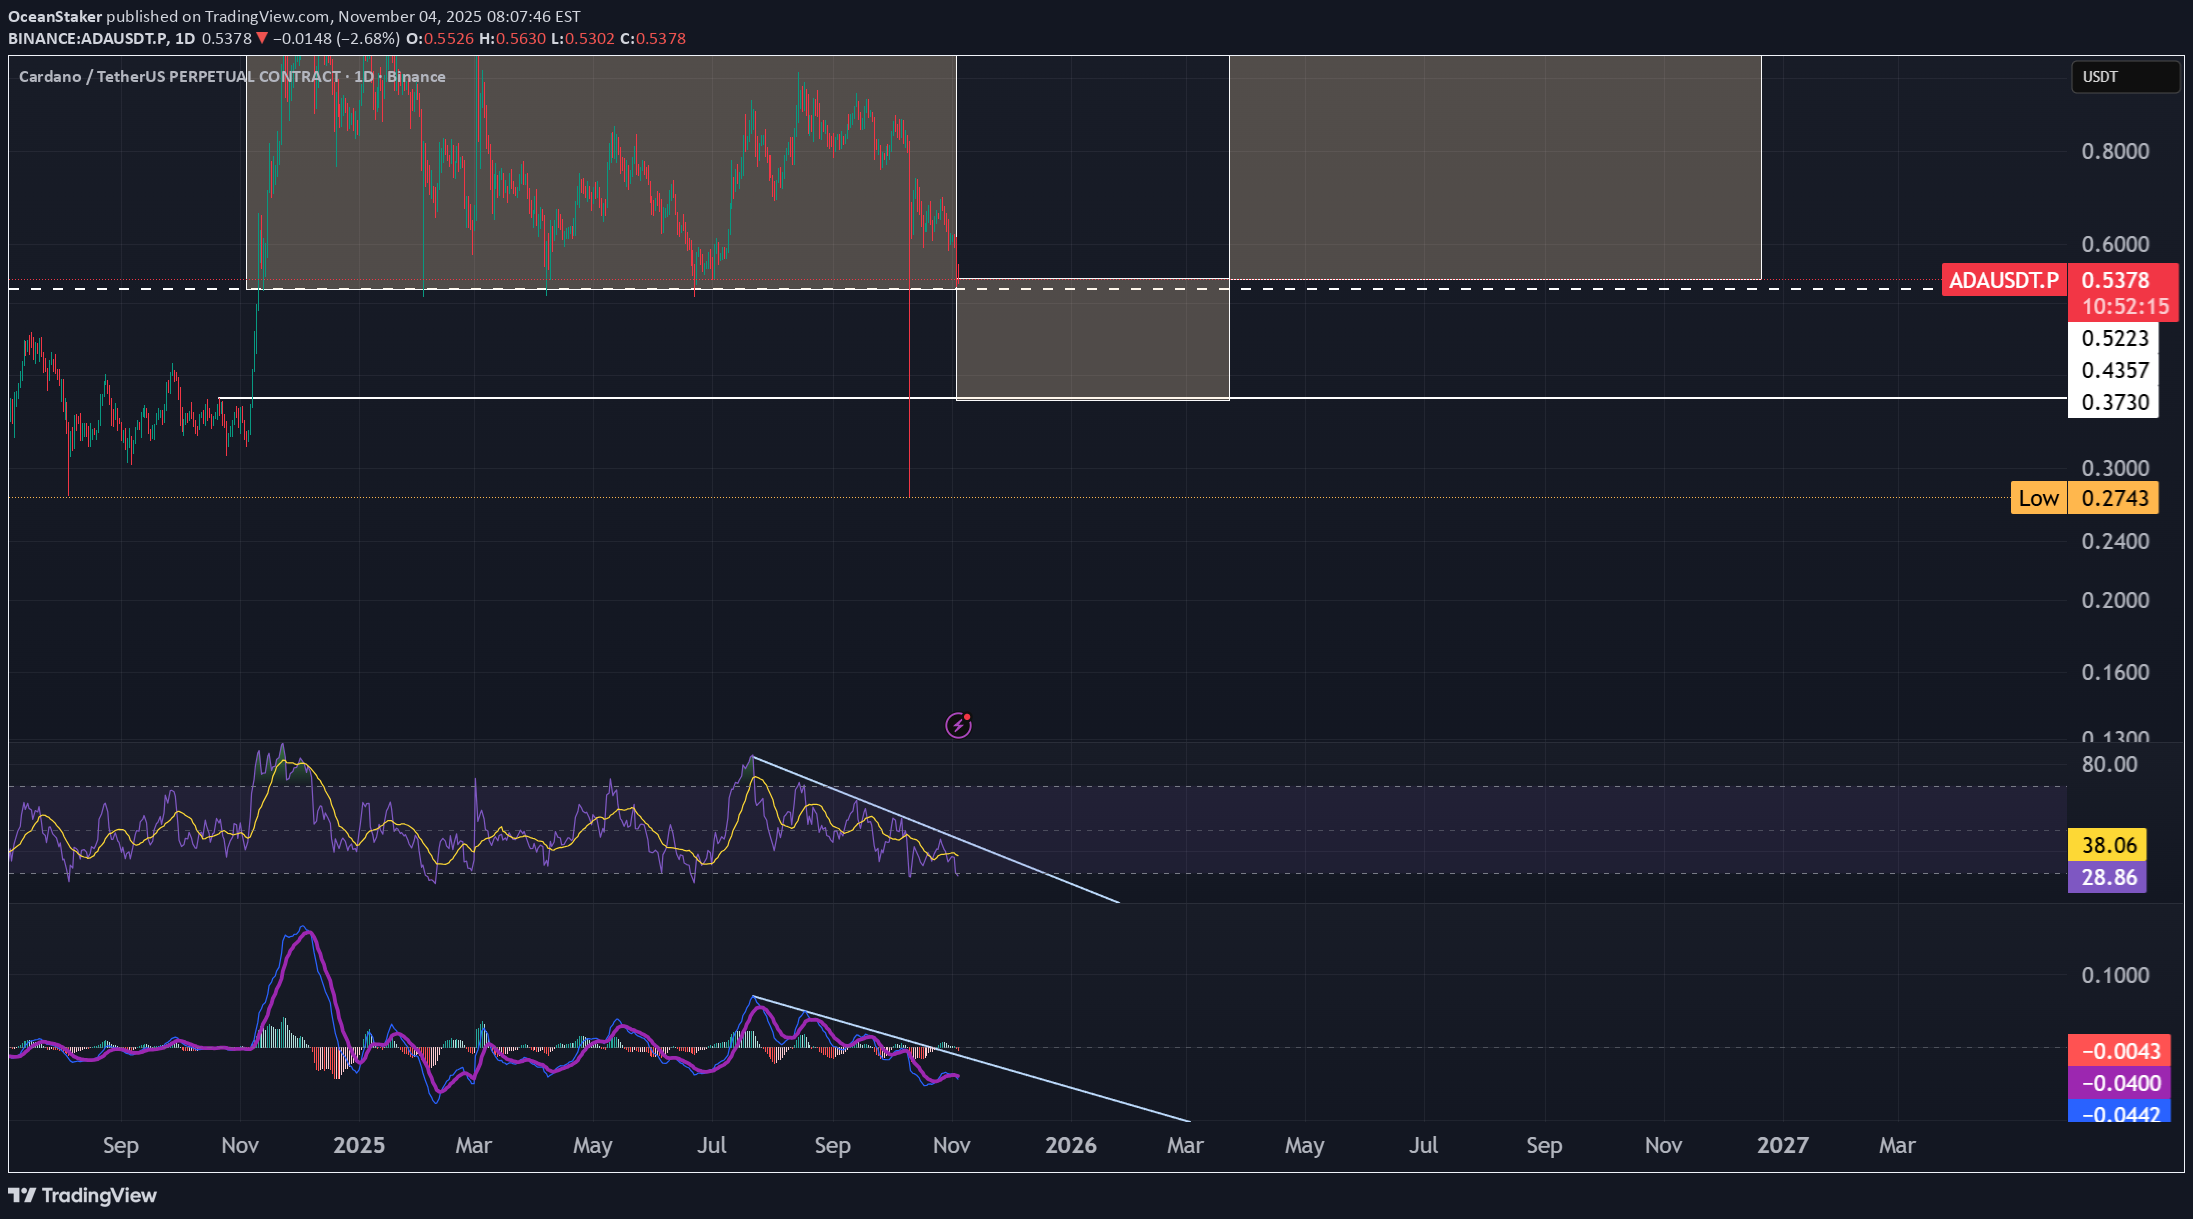
On the ADA/USDT chart, there’s a clean PO3 (Power of Three) setup. I expect the 0.435 support to hold well and act as Phase 2 (accumulation). After that, I’m looking for a transition into Phase 3 with upside expansion. MACD and RSI are also in descending trends; if those break in confluence with the PO3 breakout, it could lead to a strong move higher.
OceanStaker
تحلیل هفتگی اتریوم: حمایت قوی 2770 دلاری پابرجا میماند؛ منتظر انفجار صعودی!
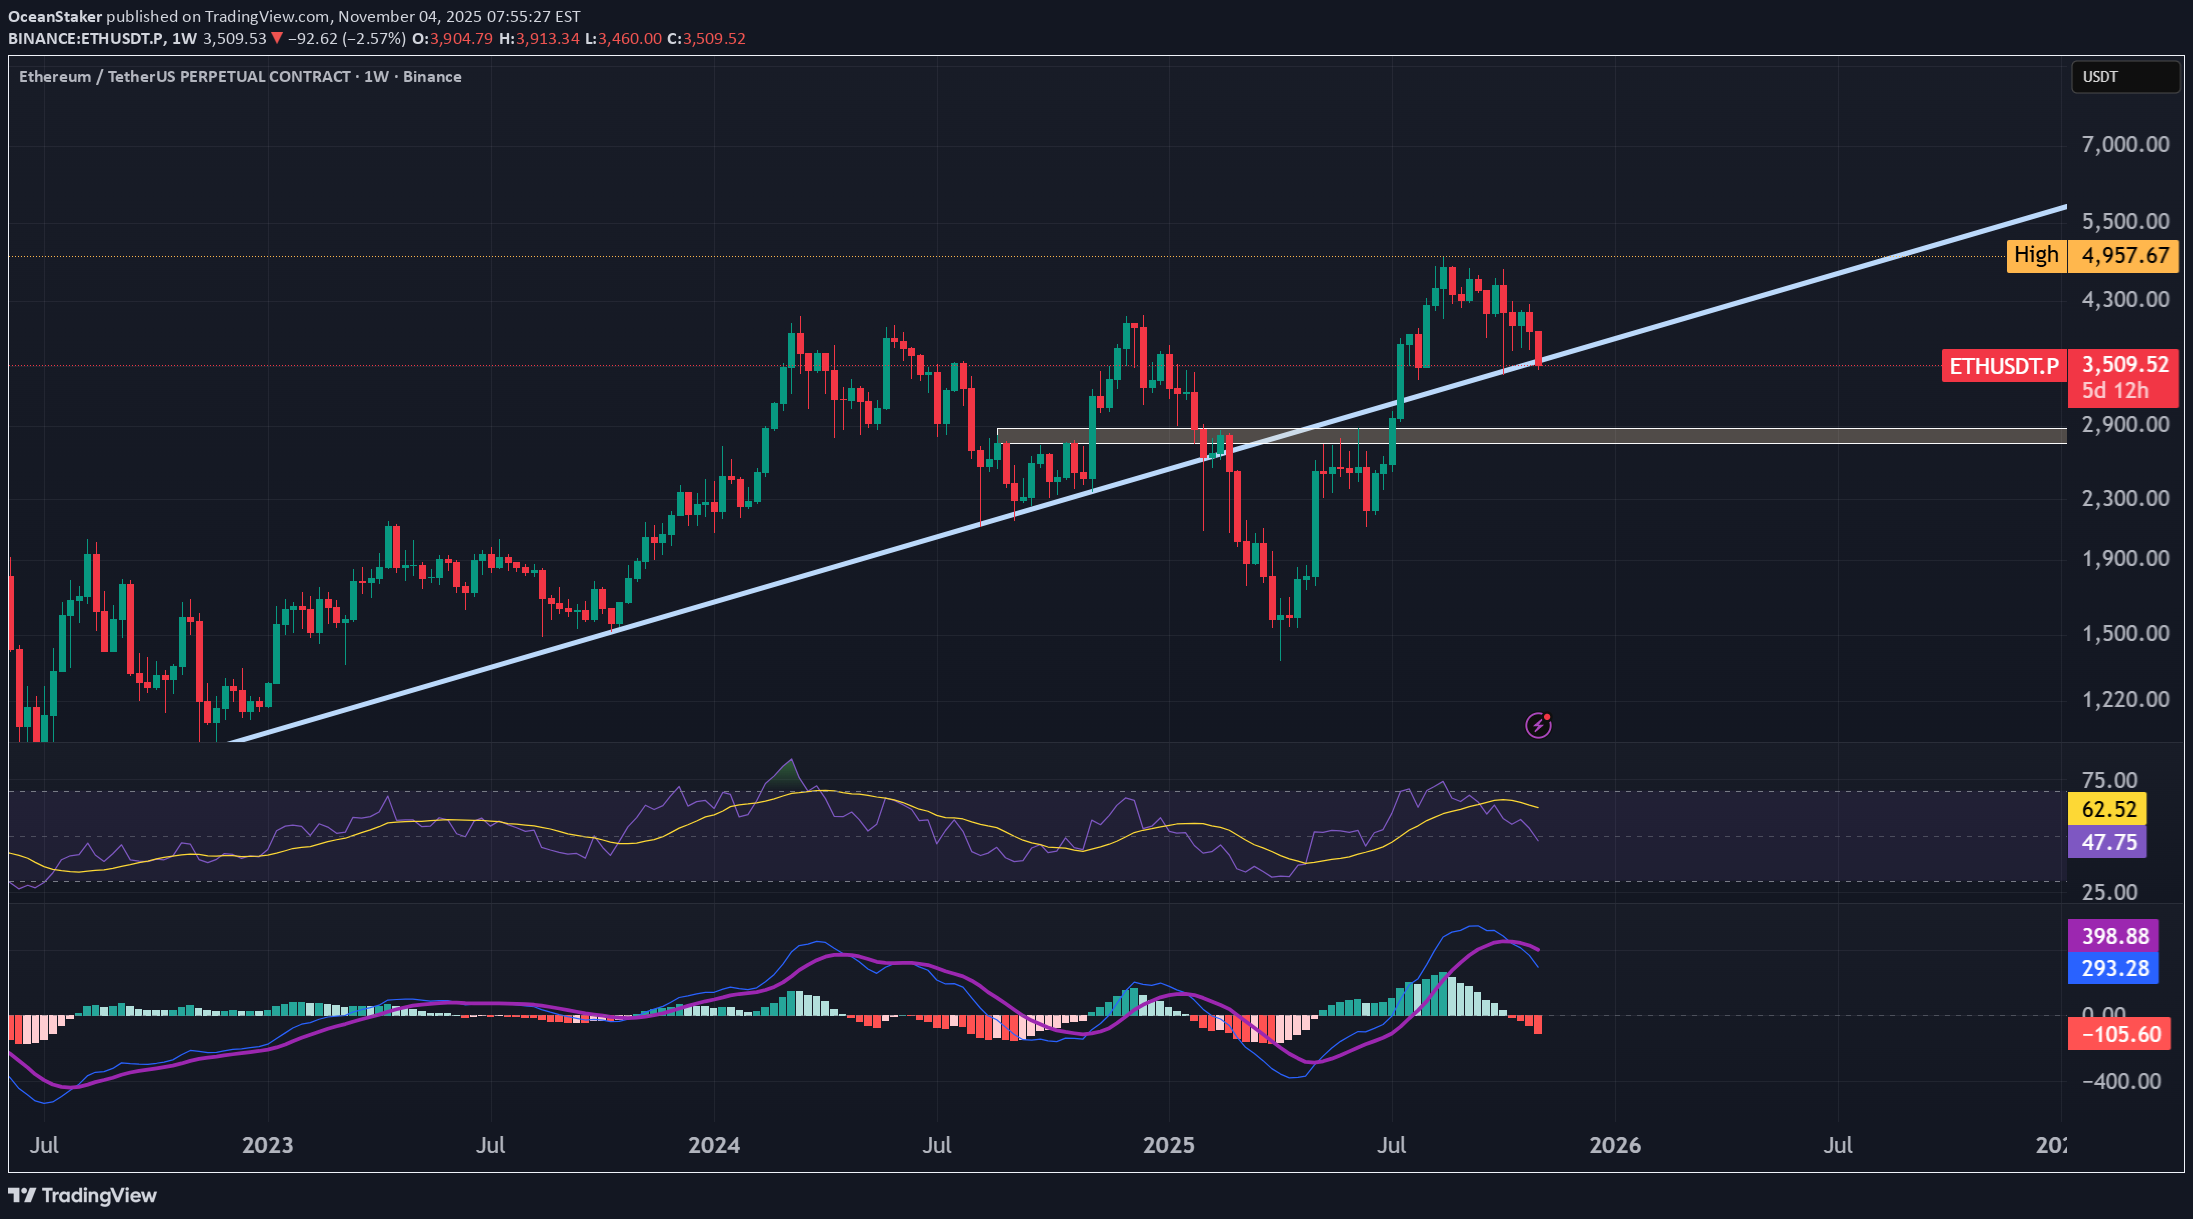
As seen on the chart, there’s still nothing to worry about in the ETH/USDT pair on the weekly timeframe. The trend that started in 2022 continues to act like a magnet, keeping the price around it. I expect the support zone at 2990–2770 to hold strong. MACD is likely to break its downtrend resistance within this month, and RSI is slowly cooling off. Upcoming ETH staking news and other positive developments could trigger the next bullish trend.
OceanStaker
ETH

As seen on the ETH chart, after breaking the upward trend, it performs a retest on the downward trend and creates the second peak of the downtrend by taking liquidity. All the moving averages (7, 25, 50, 100, 200) have converged, reinforcing and supporting the trend. We have 3 scenarios here: Wait for a break of the downtrend and enter a trade with a reversal candle. Wait for the moving averages to act as support. Wait for support from the block order zone around the 500 level — this is the worst-case scenario. If the first two scenarios happen together, it could push us significantly higher. At this point, only short positions are advisable — but they must be adjusted according to risk. Everything written here is based on the weekly chart. It is possible to trade on lower timeframes, but don’t forget — the overall trend is still down.
OceanStaker
ETH/BTC AND ETH/USDT

As seen on the monthly chart, ETH/BTC and ETH/USDT displayed identical candles and similar setups around January 1, 2017. The MA 7 also shows repeating patterns in both pairs. On the monthly timeframe, ETH/BTC has retraced from the block order resistance. Looking at the broader market, many major altcoins are currently at very attractive buying levels. Unless any negative news emerges, the market is likely to continue its upward trend, offering promising profit opportunities To see the ETH/USDT analysis, check out my page!
OceanStaker
eth/btc and eth/usdt

As seen on the monthly chart, ETH/BTC and ETH/USDT displayed identical candles and similar setups around January 1, 2017. The MA 7 also shows repeating patterns in both pairs. On the monthly timeframe, ETH/BTC has retraced from the block order resistance. Looking at the broader market, many major altcoins are currently at very attractive buying levels. Unless any negative news emerges, the market is likely to continue its upward trend, offering promising profit opportunities To see the ETH/BTC analysis, check out my page!
OceanStaker
ACH is KING

The chart is currently showing a very strong trend breakout, which also aligns with one of my most frequently used continuation formations. This breakout has occurred above a key resistance level, and price action is now entering an accumulation phase just above that zone. Based on the structure and the Smart Money Concept (SMC) signals I observe here, I will be looking to enter a long position, as long as the price holds above the resistance-turned-support zone. However, if the price falls back below this level, the bullish scenario would be invalidated.As for the target price (TP), I'm basing it on the fundamentals of the project — similar to ACH, this coin is integrated with hundreds of real-world assets and services. Considering this strong real-world utility and potential for adoption, the project deserves a market cap of at least $2 billion, which roughly corresponds to a price level of around $0.20. Currently, I see no other project in the crypto space with this level of real-world contract integration and practical use case.
OceanStaker
LOOK BULLISH
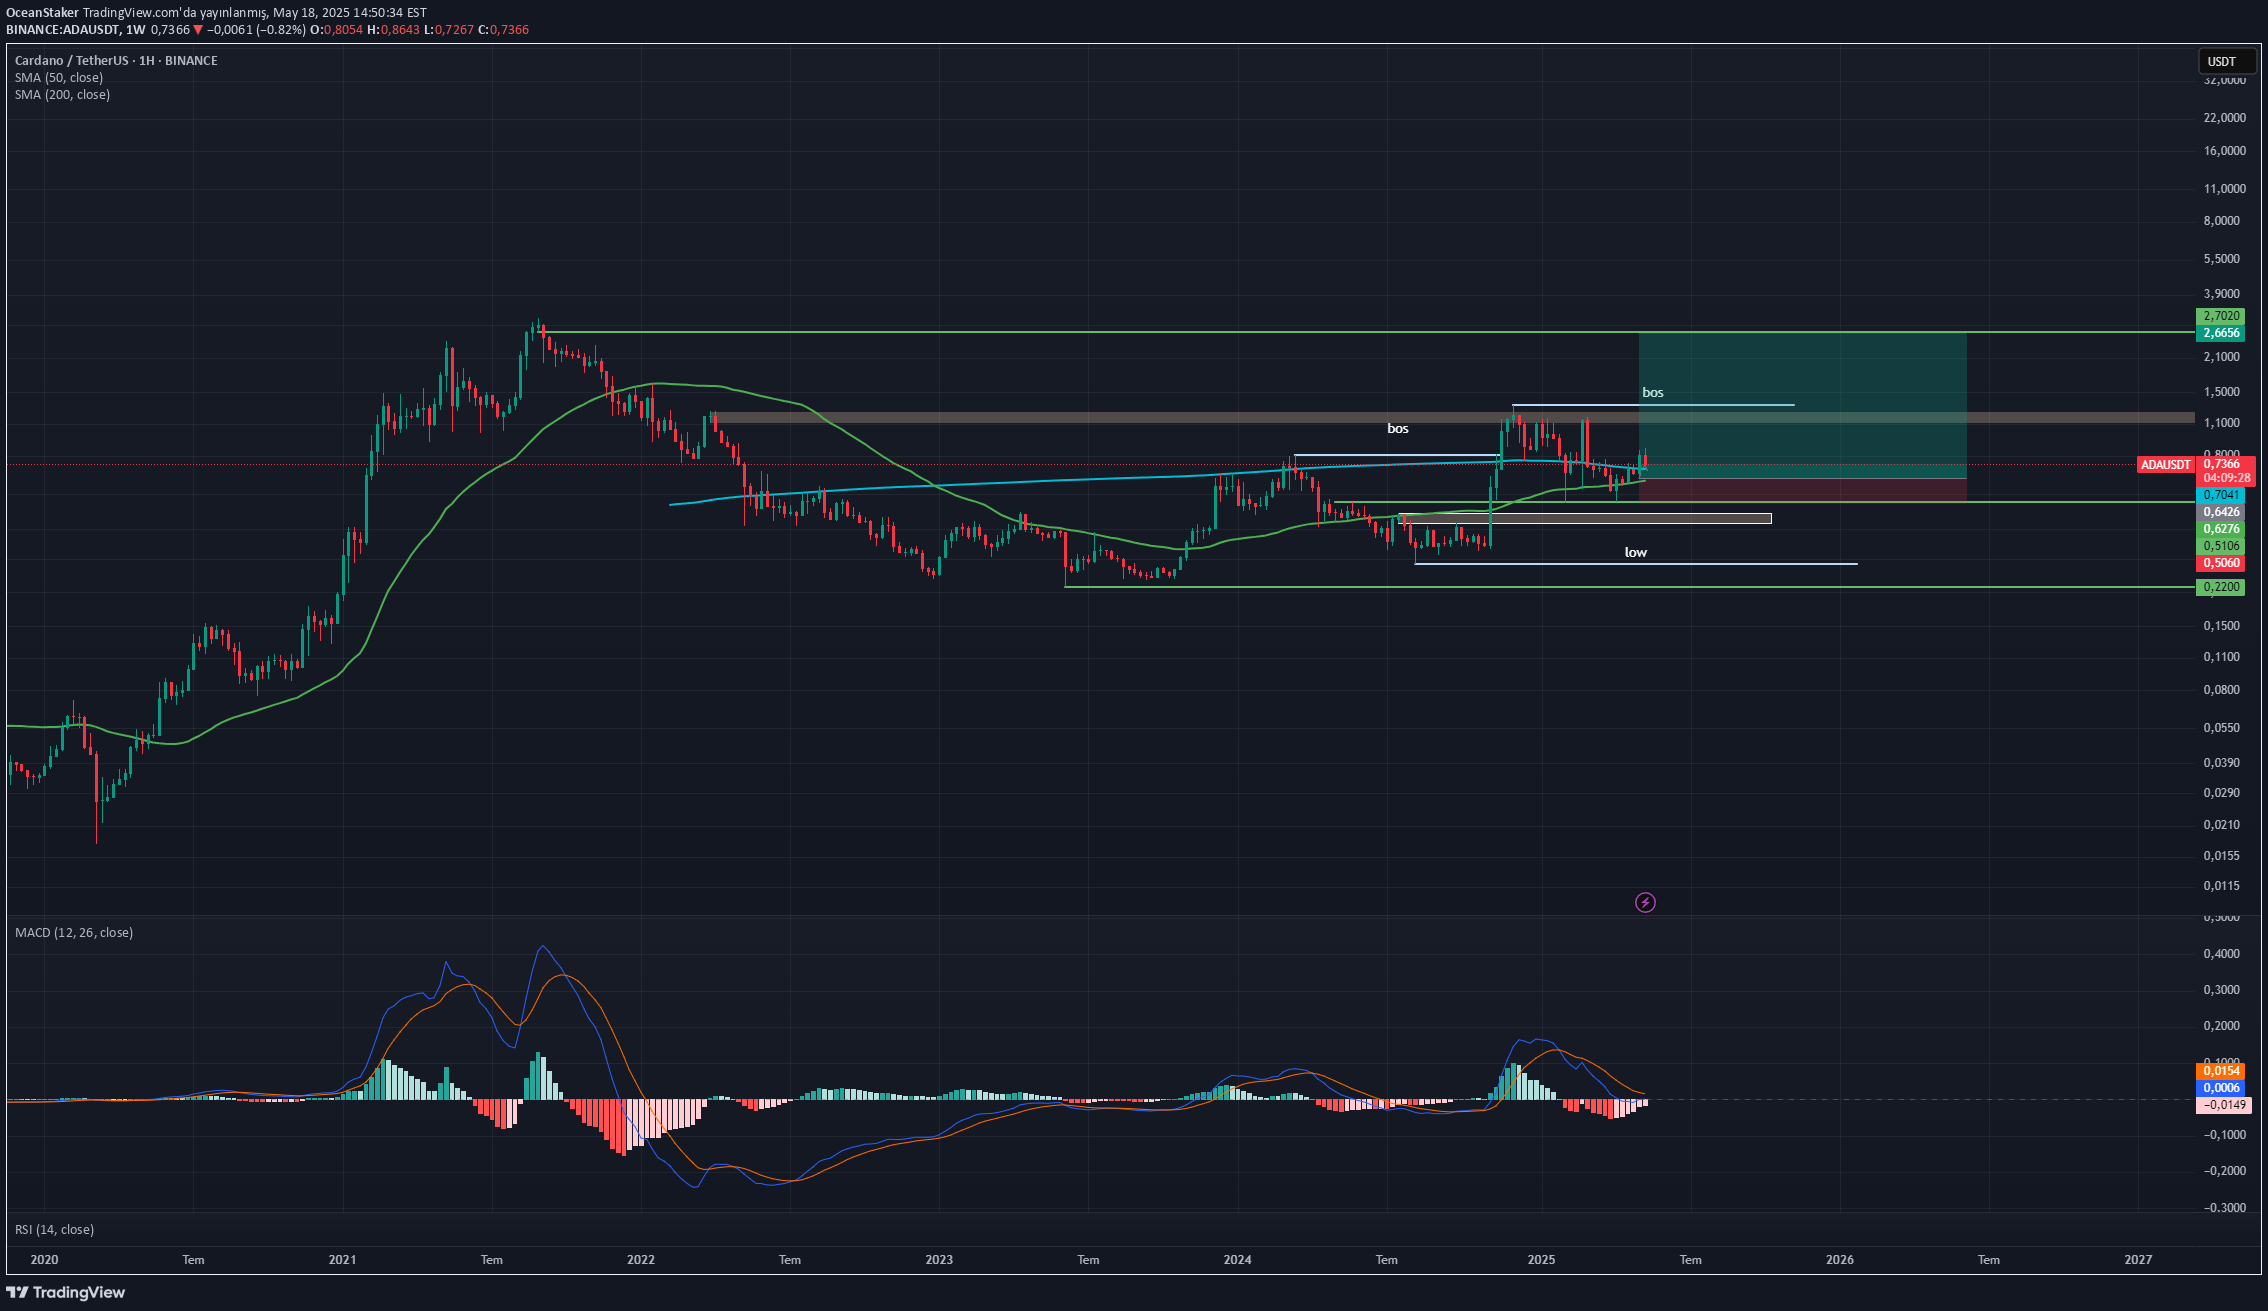
From a technical perspective, the chart is presenting a solid bullish setup. A strong support level has formed at the lower end of the range, while a clearly defined block order zone near the top is expected to act as resistance. The MACD is nearing a bullish crossover, and the moving averages are on the verge of forming a golden cross — both of which support the potential for upward momentum.On the higher time frame, particularly the weekly chart, the structure appears to confirm a healthy uptrend. After a strong local high, price retraced in a controlled manner and created a clean market structure shift. Following a successful retest, price broke the previous high, forming a clear Break of Structure (BOS) to the upside — a classic signal that the bullish trend is likely to continue.The initial profit target lies around the block order zone; however, based on the current momentum and structure, I expect an extension towards the $3.5–$5 range. As long as there are no bearish signals from the broader market, this setup offers an attractive risk-to-reward opportunity with strong upside potential.
OceanStaker
Jasmy try to do something

This pattern in the middle of the chart, based on my experience, often signals an upward trend in the long term. Perhaps it has a scientific name, but since I haven't encountered it anywhere, I can't confidently call it "my formation." This formation serves as a strong signal for spot buying, especially on weekly or daily charts. During this signal, the increase often matches or even exceeds the ratio from the beginning of the formation to its peak. Examples of this can be observed in coins like Ray, Pepe, and others. The Japan-based project Jasmy, which focuses on artificial intelligence initiatives, prioritizes the Internet of Things (IoT), one of the most promising fields of the future. The project is led by a team with highly impressive résumés. Sony, the tech giant, has left its mark on Jasmy's decision-making processes. The company's Representative Director is Kunitake Ando, the former COO of Sony and currently the President of Nagano University. Meanwhile, JASMY J JASMY 's CEO is Kazumasa Sato, who previously served as the CEO of Sony Style.🚀🚀🚀
Disclaimer
Any content and materials included in Sahmeto's website and official communication channels are a compilation of personal opinions and analyses and are not binding. They do not constitute any recommendation for buying, selling, entering or exiting the stock market and cryptocurrency market. Also, all news and analyses included in the website and channels are merely republished information from official and unofficial domestic and foreign sources, and it is obvious that users of the said content are responsible for following up and ensuring the authenticity and accuracy of the materials. Therefore, while disclaiming responsibility, it is declared that the responsibility for any decision-making, action, and potential profit and loss in the capital market and cryptocurrency market lies with the trader.