
NoLimit_777
@t_NoLimit_777

What symbols does the trader recommend buying?
Purchase History
پیام های تریدر
Filter
Signal Type
NoLimit_777
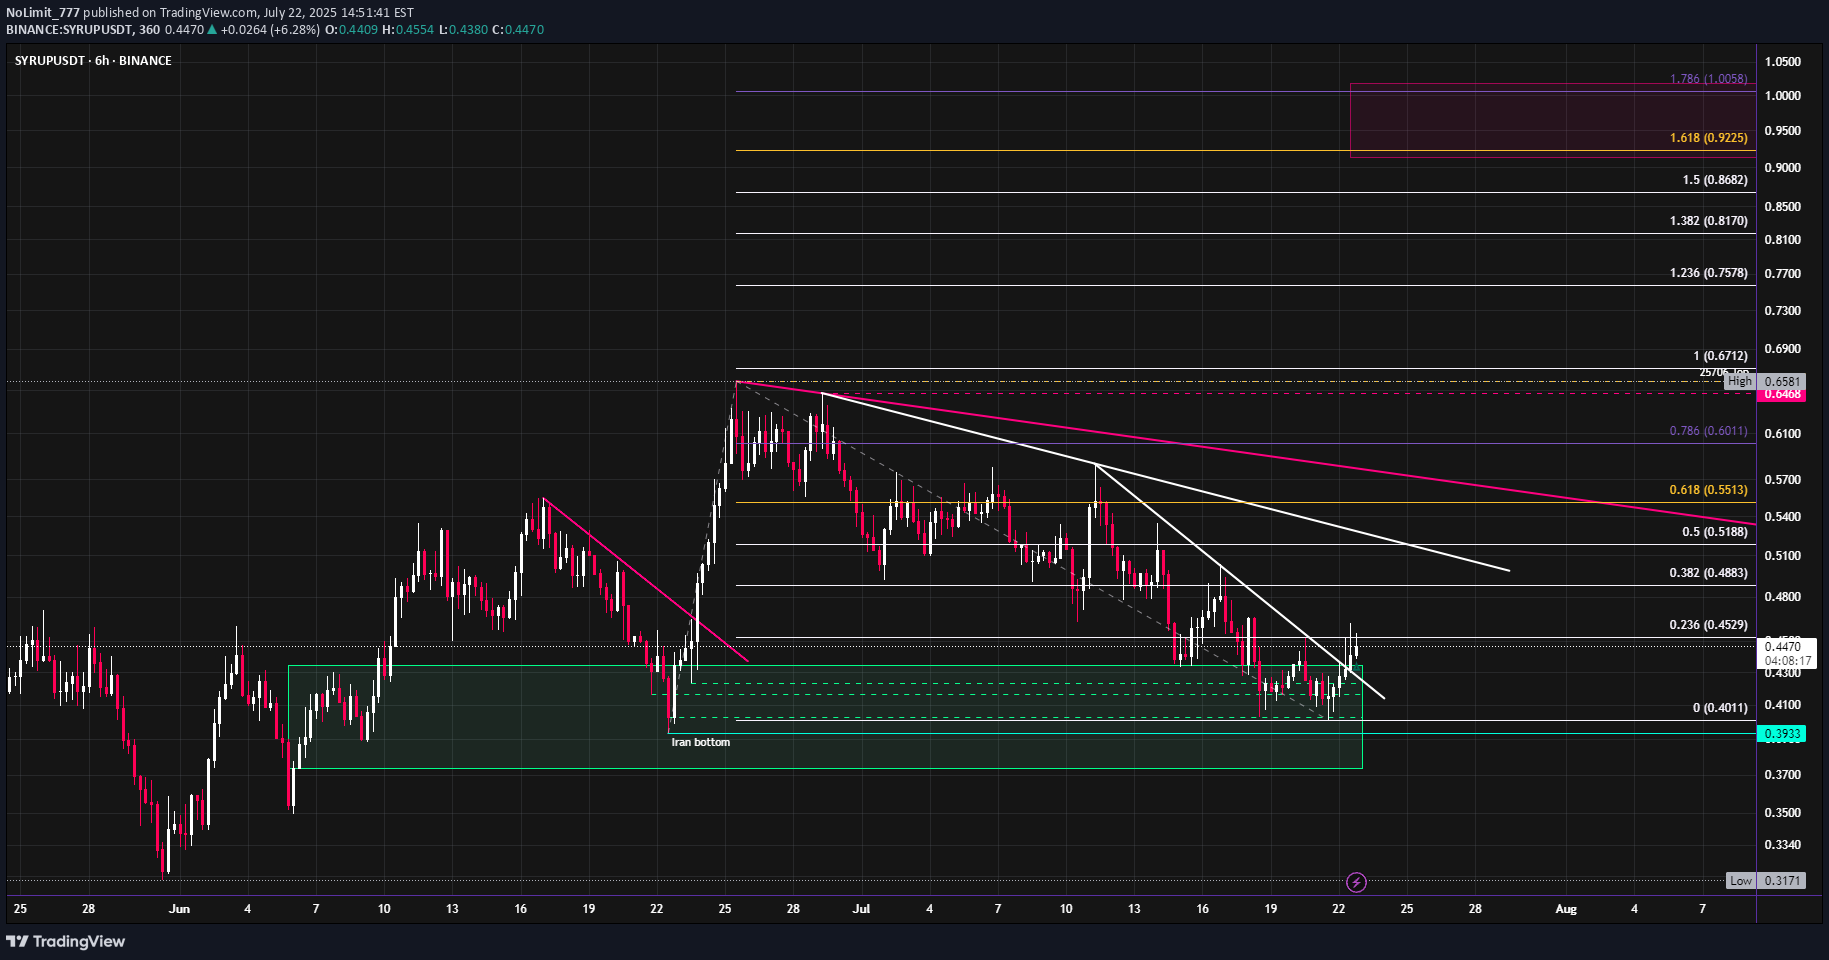
SYRUP has started to break out of its downtrend after revisiting the June lows. It has outperformed most of the market since April, with this month's pullback being an exception. I expect an aggressive move up into new highs. The fibs around $1 look like a good target for the short term, this would also be ~1b mc.
NoLimit_777

There's many signs that suggest a major trend reversal: 1) Double bottom 2) Previous resistance line acted as support for the previous 2 lows, extremely precisely as well 3) Lower 0.618 St. Deviation Band of the all time VWAP acted as a support again 4) Bullish divergence on volume weighted RSI 4H 5) Price broke through the resistance line and just got retested, this also aligns with the 0.236 Fib extension level Fundamentals are great as well. Nearly half the volume on Solana comes from the Jupiter aggregator. JUP is one of the most held tokens on the network. The team is very active with updates and fixes. A 30% supply burn is planned. TP targets are the 1.618 of the Fib extension (which happens to be just above ATH) and $2. I think JUP has the potential to go much higher, but there's likely to be a pullback if these levels are reached, which would be an opportunity to re-enter. If we go down from here it remains bullish as long as price doesn't go below the first green zone, if it does I would expect a further drop to the second zone.
NoLimit_777

A lot of new token launches (Airdrop/Pre-Sale at least) this year seems to suffer the same fate: Price might pump a bit at launch with decent volume, but soon after the interest dies and the price dumps. I've seen several coins now with huge falling wedges like we can see here, and the breakouts are usually insane. W looks like it's getting very close to finally getting out of this wedge. This looks like a great place to enter a long. Main target is $0.786, and the plan would be to hold maybe ~20% if it looks like it can push $1. The VWAP has acted as a resistance in the past, if the price fails to go past this VWAP again I'd just sell, as it's likely to reverse again. The St. Dev. Bands line up quite well with my targets, and could end up becoming more precise TPs. The targets probably seem unrealistic, and maybe they are for the shorter term at least, but these markets move in strange ways, I've been seeing some crazy price action lately (like CLOUD for example) Tight SL here, would probably look to enter somewhere lower if it gets hit.
NoLimit_777

Despite greatly outperforming most of the crypto market recently and getting a higher high, Solana obviously couldn't avoid the global selloff that has been happening across all markets for the past week. The sell pressure might force Solana to a lower low in the $100-110 region, maybe even wick below $100 as stop losses get hunted and people get liquidated. There are several factors that make me believe this could be the bottom of the range we've been trading at for many months, and we'll be heading to new highs starting around September/October. The low $100 area has previously shown to have high liquidity, and has a positive volume delta since the low of January, indicating there's more buying than selling interest at that price. There's also the October anchored VWAP which has now reached $108. The upper 0.5 standard deviation band has acted as a support level for pretty much every dip so far this year, but we could see a test of the VWAP now that it has risen close to the local trading range. The Fib extension using the pivot highs and low of the trading range gives us the 1 level at $107, aligning with the VWAP. The ideal entry points which I'm looking for are $107.5, $102.5 and $97.5, as there's a high chance that there will be a lot of stops around these prices. Also be aware that there might be a double bottom first before price goes up again, which is often the case for major trend reversals, and has been for Solana's previous 2 dips. These usually also have a bullish RSI divergence which is good to keep an eye out for. Profit targets for this trade shorter term could be around like $180-$200, longer term would be at some future new ATHs, which might be around some of the Fib levels in the previous chart I published.Solana did end up reaching ~$110 on Monday and has bounced back to nearly $150 in a day, but I'd be cautious here, as both previous times this has happened the price kept moving sideways and eventually creating a double bottom while wiping out stops. I would expect a slightly lower low between $105-$110, but this could take a week or 2 as it has before. It could also be the case of course that $110 was the bottom, and that the momentum from the bounce will continue pushing Sol towards $200+, but it's too early to confirm an uptrend continuation.With the current price action, I think it's less likely that Sol will test $110 again, I could see a potential wick to ~134-138, but even that seems unlikely. Open interest across most coins is still relatively low comparted to before the dip, as many traders are too scared to enter positions and some are taking aggressive shorts. This is a perfect opportunity for market makers to catch people off guard with a big pump, liquidating shorts and creating FOMO for all the traders on the side lines that are waiting for another pullback to buy back.$138 got hit after all, I bought more here
NoLimit_777

So far Solana has moved nearly identically as the previous cycle, which leads me to believe we'll have a breakout soon, likely following the launch of the ETH ETF's. There's also a massive cup & handle forming. According to the Fib extension, we could see a new ATH of $550, or even $840. In case of a downtrend continuation, the bottom will be at the long term support trendline, ez all in if it gets there.
Disclaimer
Any content and materials included in Sahmeto's website and official communication channels are a compilation of personal opinions and analyses and are not binding. They do not constitute any recommendation for buying, selling, entering or exiting the stock market and cryptocurrency market. Also, all news and analyses included in the website and channels are merely republished information from official and unofficial domestic and foreign sources, and it is obvious that users of the said content are responsible for following up and ensuring the authenticity and accuracy of the materials. Therefore, while disclaiming responsibility, it is declared that the responsibility for any decision-making, action, and potential profit and loss in the capital market and cryptocurrency market lies with the trader.