
NEoWave-Chart
@t_NEoWave-Chart

What symbols does the trader recommend buying?
Purchase History
پیام های تریدر
Filter
NEoWave-Chart
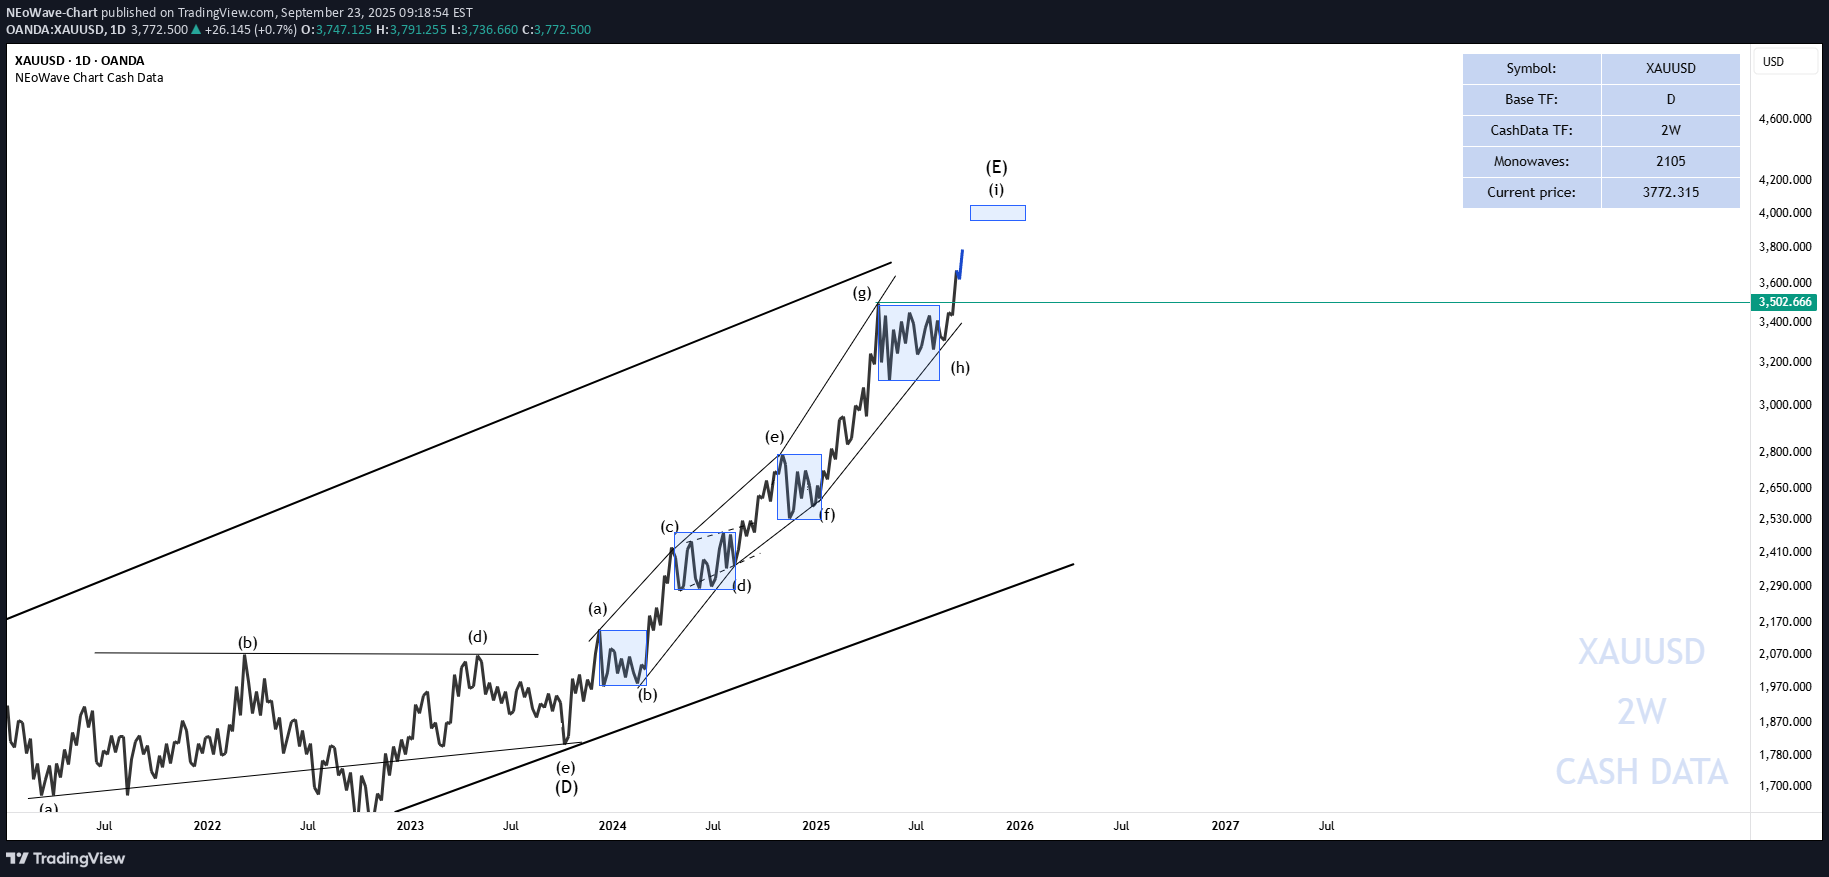
پایان اوجگیری طلا؟ موج جدید اصلاحی ۲ ساله از کجا شروع شد؟
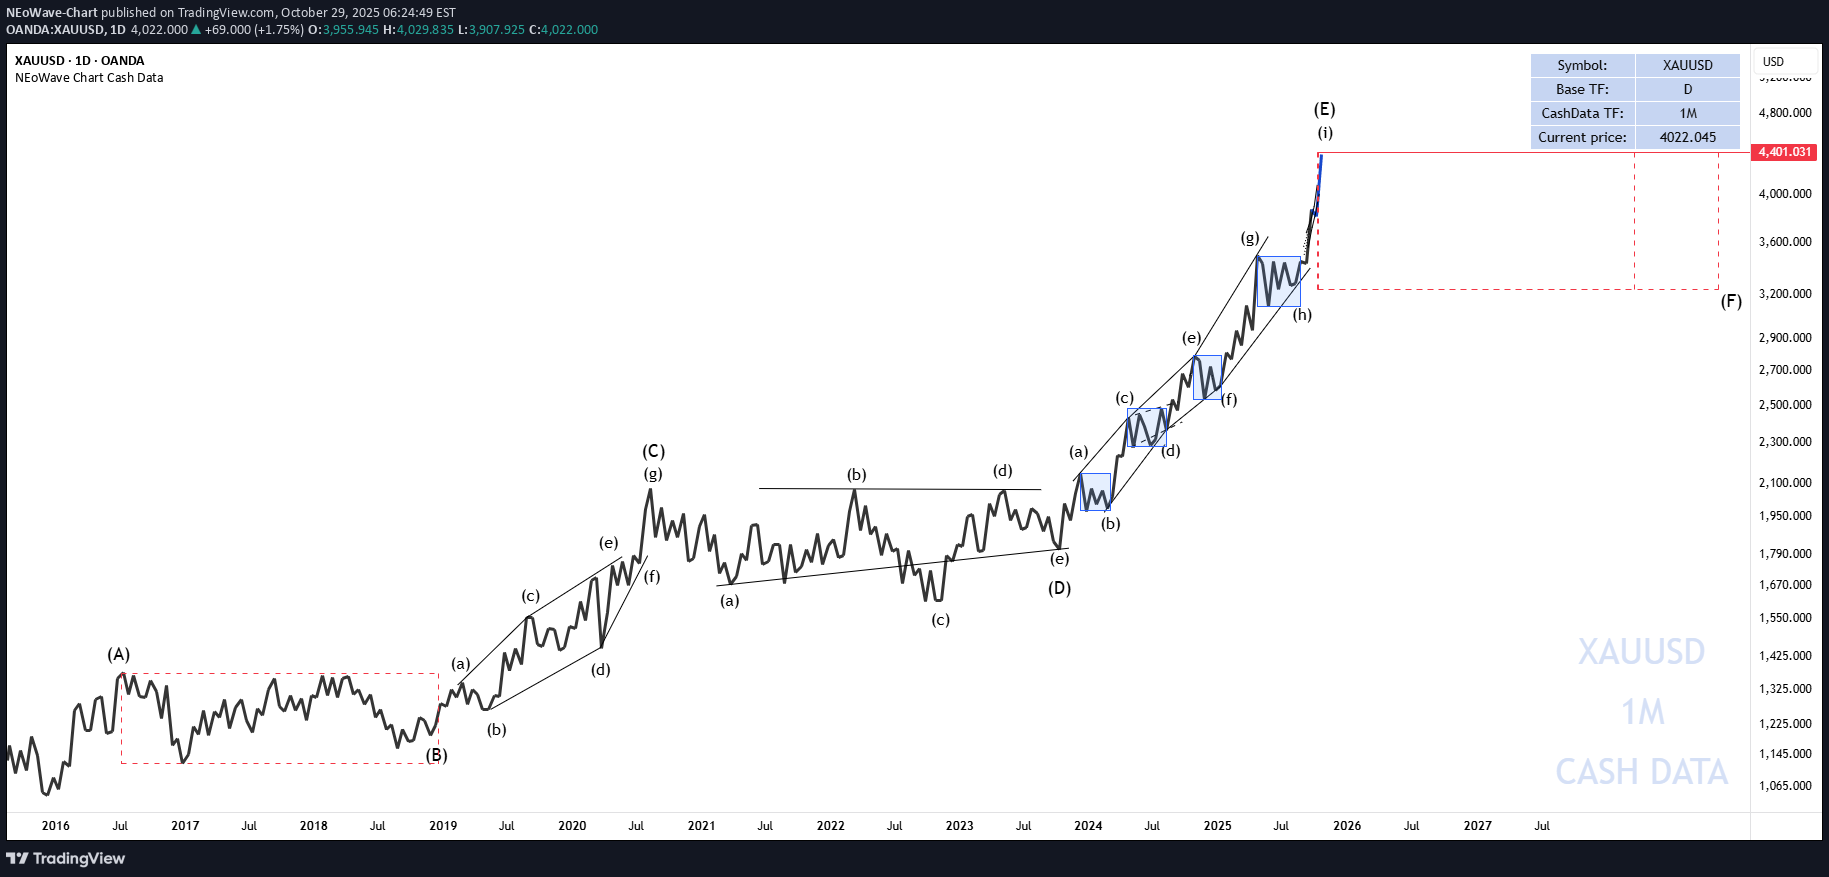
Since the past and the $2000 gold price, we have provided and updated our gold analysis, stating that wave-(E) of gold has started. In our latest analysis, we mentioned that gold could rise to a maximum of $4330–$4401, and prices above this range would not be sustainable. Currently, in my opinion, the post-pattern move has been confirmed, and we can say that wave-(F) has begun. This corrective wave could take approximately 2 years, after which gold's upward trend may resume. Gold prices could fluctuate between $3100–$4300, and the most likely pattern for wave-(F) could be a triangle or a diametric. Good luck NEoWave Chart
NEoWave-Chart
موج نهایی طلا: آیا قیمت به سقف 4401 دلار میرسد؟
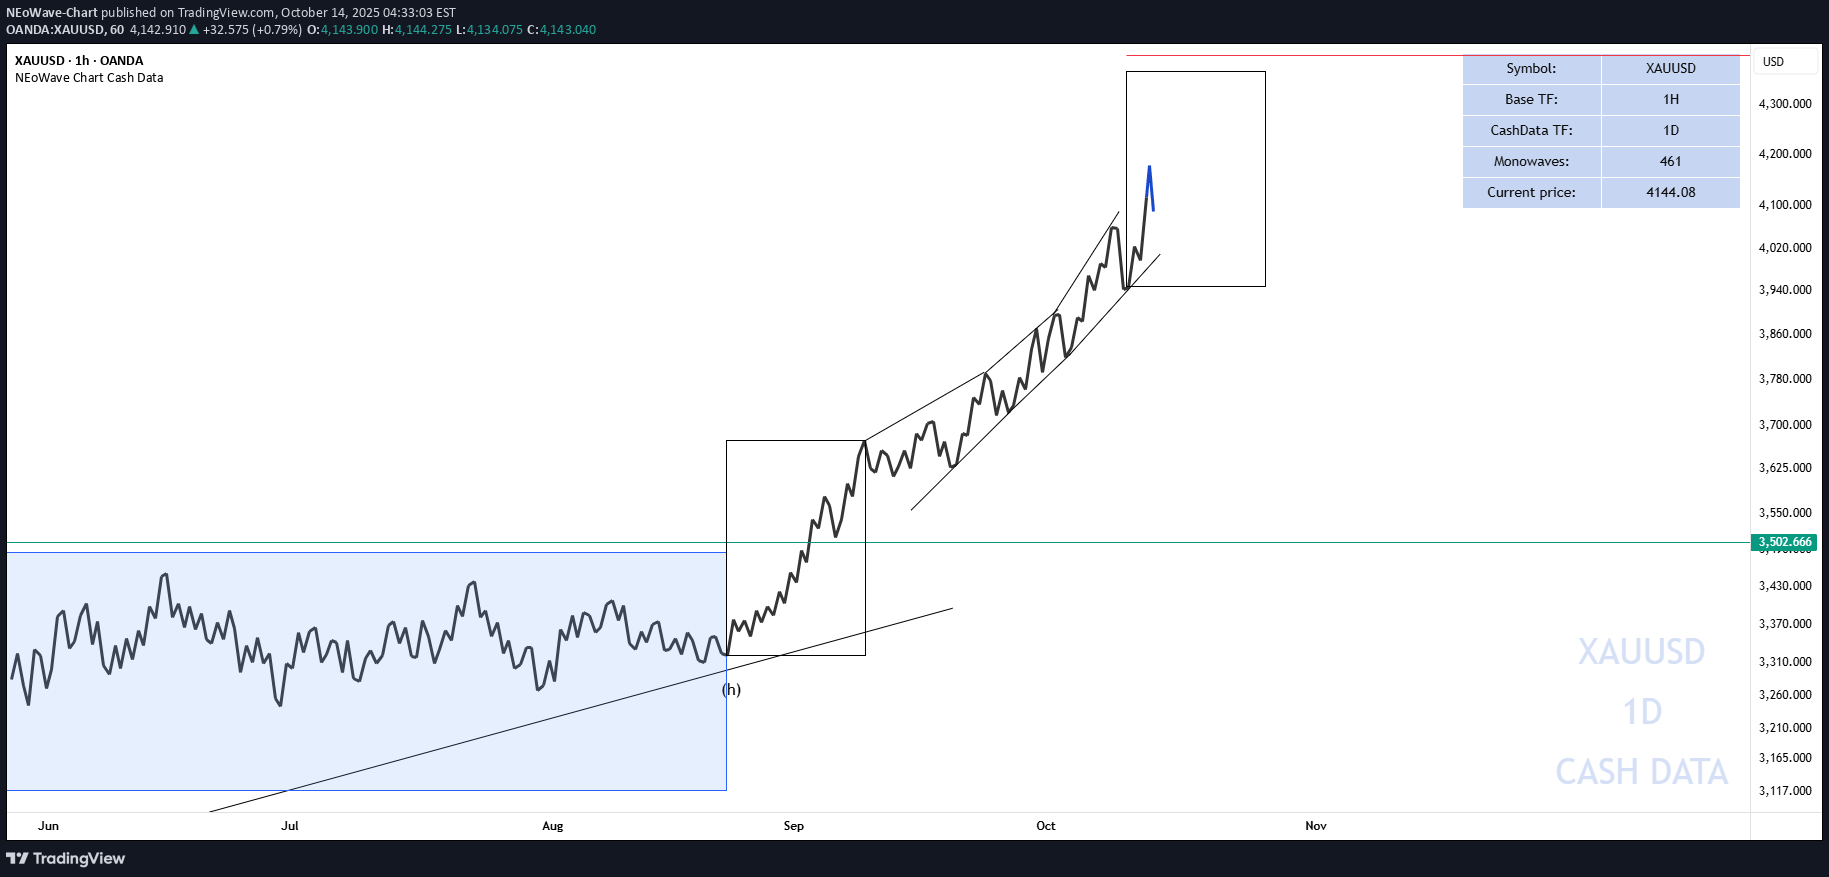
Initially, our expectation was that wave-(i) of (E) would be a diametric, which in the analyses we said its wave-g could move up to $4200, and gold touched $4180. But a corrective wave formed from around 4058 to 3942, and given the high price similarity between the waves, the scenario of forming a symmetrical has been strengthened. If the gold price can powerfully break above 4200, we can expect gold to continue its growth to the range of 4330-4401 dollars. Given that we are in the final upward waves of gold, I should add one point to the above: - Until a strong, fast, and large downward movement bigger than waves b-d-f-h occurs in the market, we cannot confirm the completion of wave-(i) of (E). In the higher degree pattern, wave-(E) in my opinion can grow at most to 4401 dollars. If this level is broken, it will not be very stable. Long-term Analysis 👇👇 Good luck NEoWave ChartThe $4,387 gold price has shocked everyone except the members of the NEoWave Chart channel, and all targets have been touched precisely. I posted my long-term gold analysis on December 22, 2023, at $2,050 on TradingView, and from 2023 until today, I've posted gold updates in various time frames, and since then, gold has grown more than 23,000 pips. If you were a member of the channel, you should have at least made 6,000 pips profit from gold based on our latest NEoWave analyses, and that's from analyses that are placed for free in the channel. Our entire effort in NEoWave Chart is so that you can reach income without depending on anyone and solely relying on your own analyses. The last point I should mention: Given the current conditions, gold might grow even more, but for now, in my opinion, gold won't sustain above $4,401, and I think I've been in gold enough, and maybe it's better to sit aside and see what the market will do. Ultimately, the final decision is yours, and consider this just as a personal opinion. Good luck NEoWave Chart
NEoWave-Chart
پیشبینی سقوط S&P 500: اصلاح قیمتی در راه است!
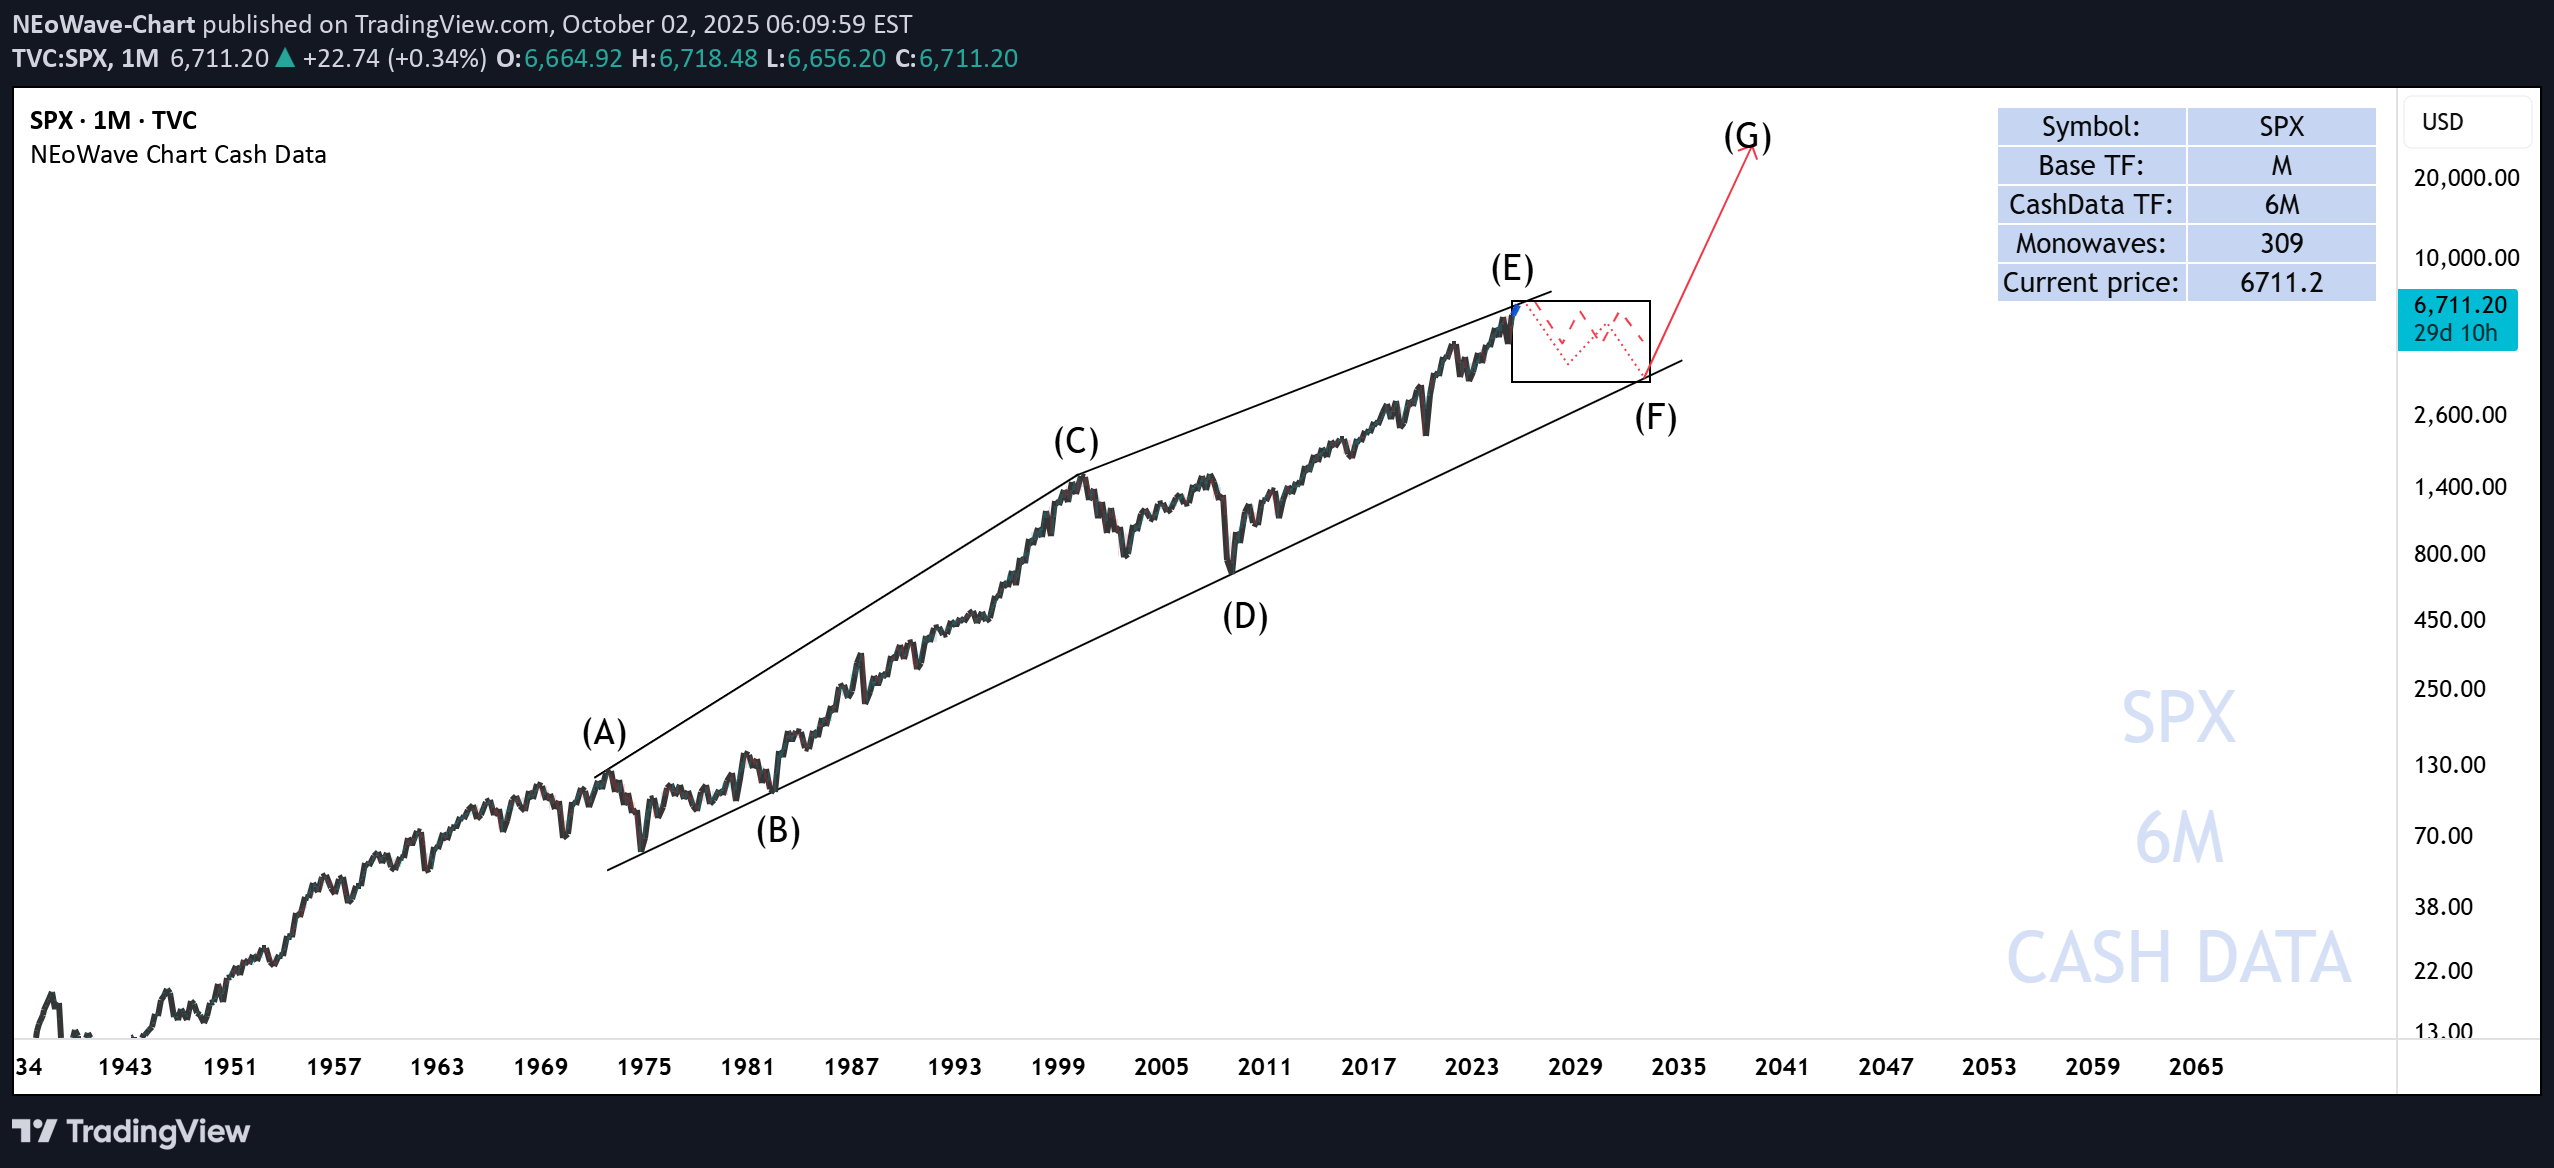
In my view, the S&P 500 index is forming a diametric pattern in the long-term timeframe, with wave (E) currently nearing completion. Following this, the index is expected to enter a corrective phase, which could involve both price and time corrections: - The price correction may extend to the range of the drawn box, potentially dropping the index to 3,500 points. - Alternatively, the price could decline to the 4,700–4,800 range and then consolidate over time to complete the time correction. Good luck NEoWave Chart
NEoWave-Chart
آخرین موج صعودی طلا: قیمت تا کجا بالا میرود؟ (تحلیل تکنیکال)
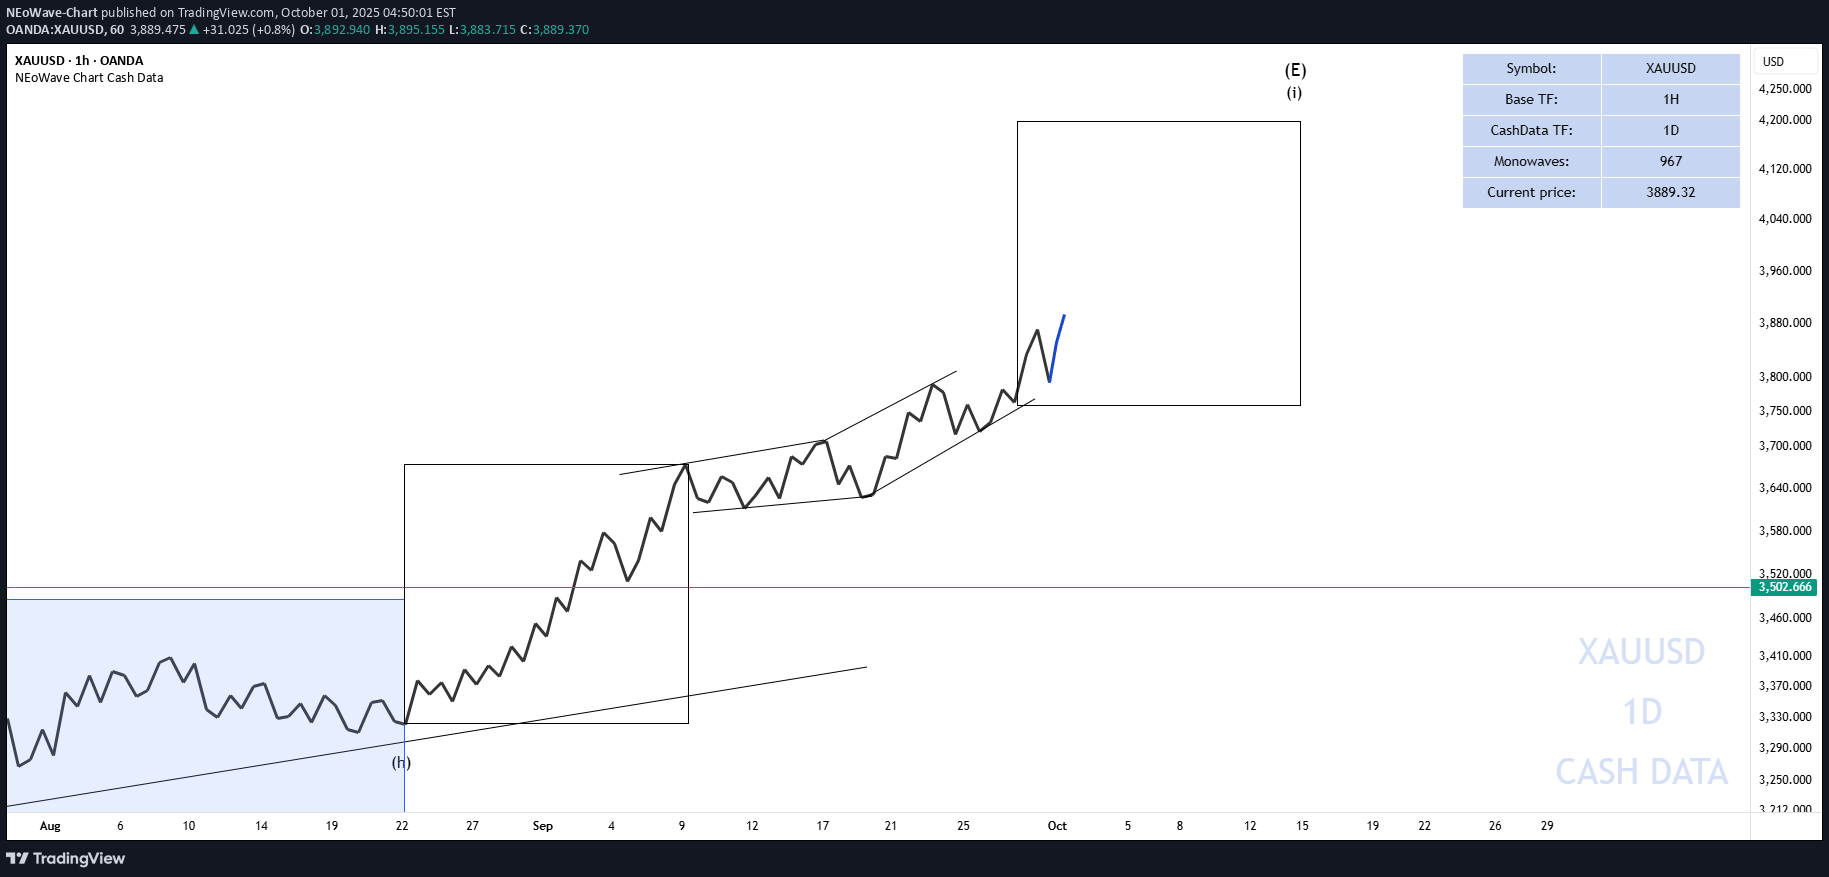
As I previously mentioned in the analyses, wave-(E) of the diametric is turning into a symmetrical pattern, and we are currently in wave-(i) of the symmetrical. https://www.tradingview.com/chart/XAUUSD/EquNONQd-The-rise-in-gold-is-still-continuing/ It appears that wave-(i) of (E) is a diametric, and we are in the final wave of this diametric. This wave could move toward the range of 3900–4050 and 4160–4200 dollars. Good luck NEoWave Chart
NEoWave-Chart
The rise in gold is still continuing.
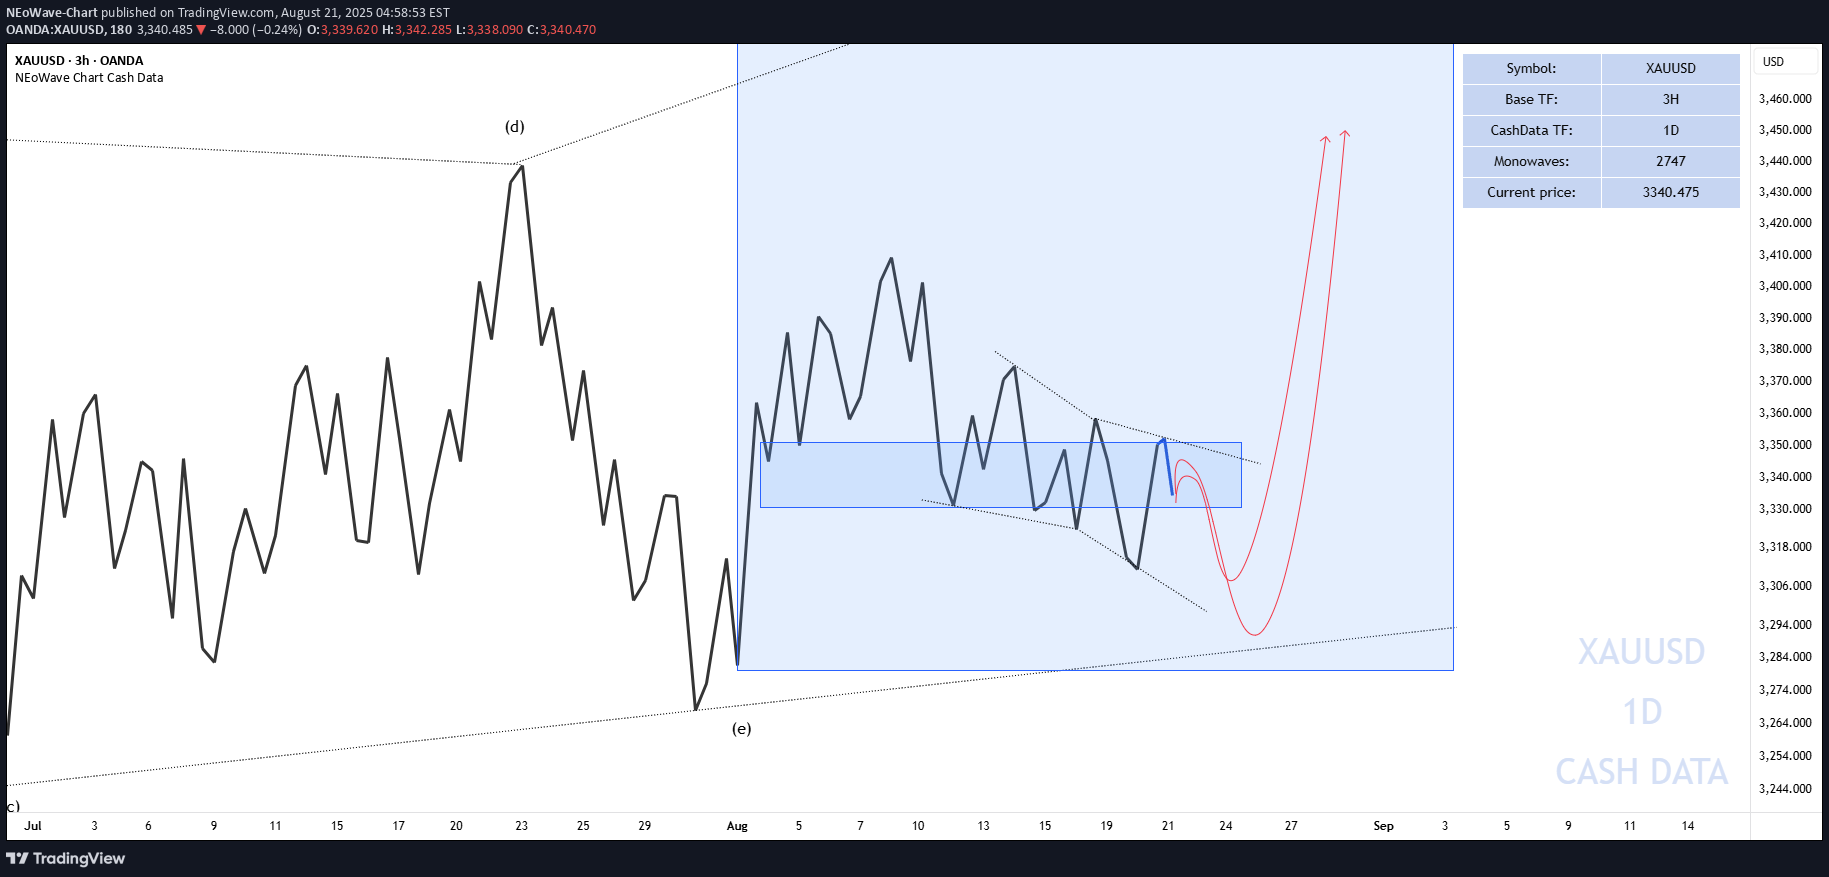
Wave -(i) of (E) is forming, and the target of 3900-4050 remains valid, and it could even go higher than this price. After the completion of wave -(i) of (E), there is a possibility of a corrective period in both time and price. A time-based corrective period is more likely. Good luck NEoWave Chart$3930 🚀🚀🚀Gold at $4,040 It has almost hit the first target, and I hope you made use of the gold analysis.
NEoWave-Chart
ONDO NEoWave Analysis
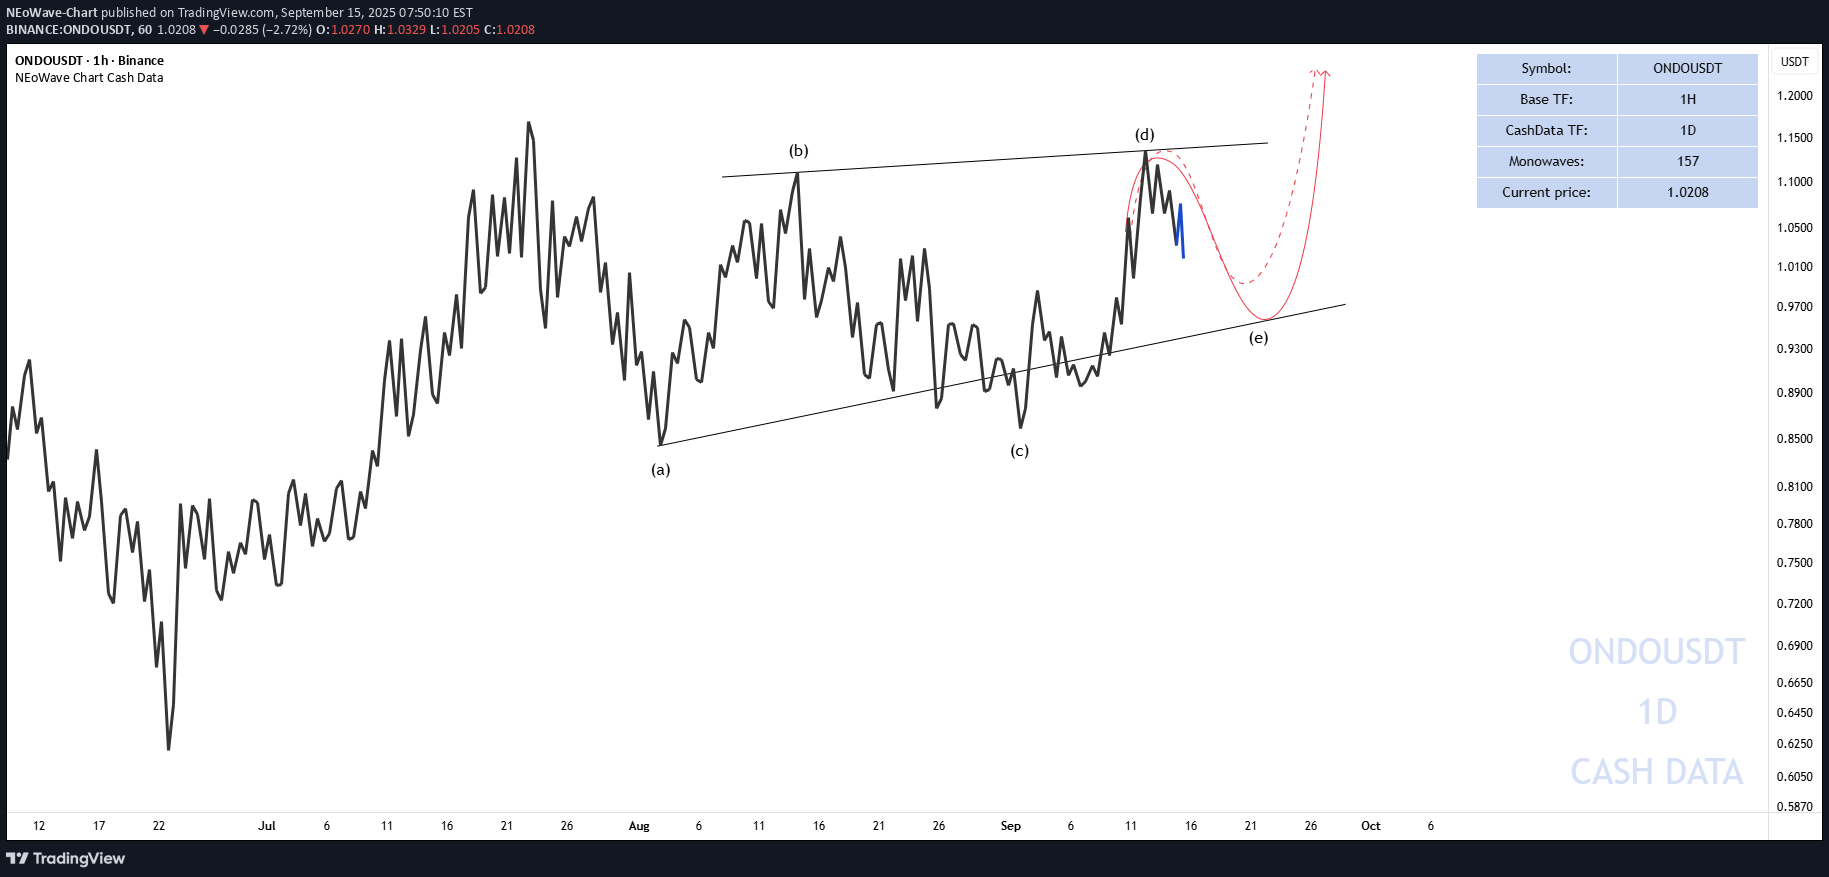
With the price movement of wave-(d) exceeding our expectations, the contracting pattern is not observed in the formed structure, and thus the contracting structure is no longer valid. It appears that a reverse triangle is forming, but the targets remain unchanged. Good luck, NEoWave Chart
NEoWave-Chart
ONDO FIRST TARGET
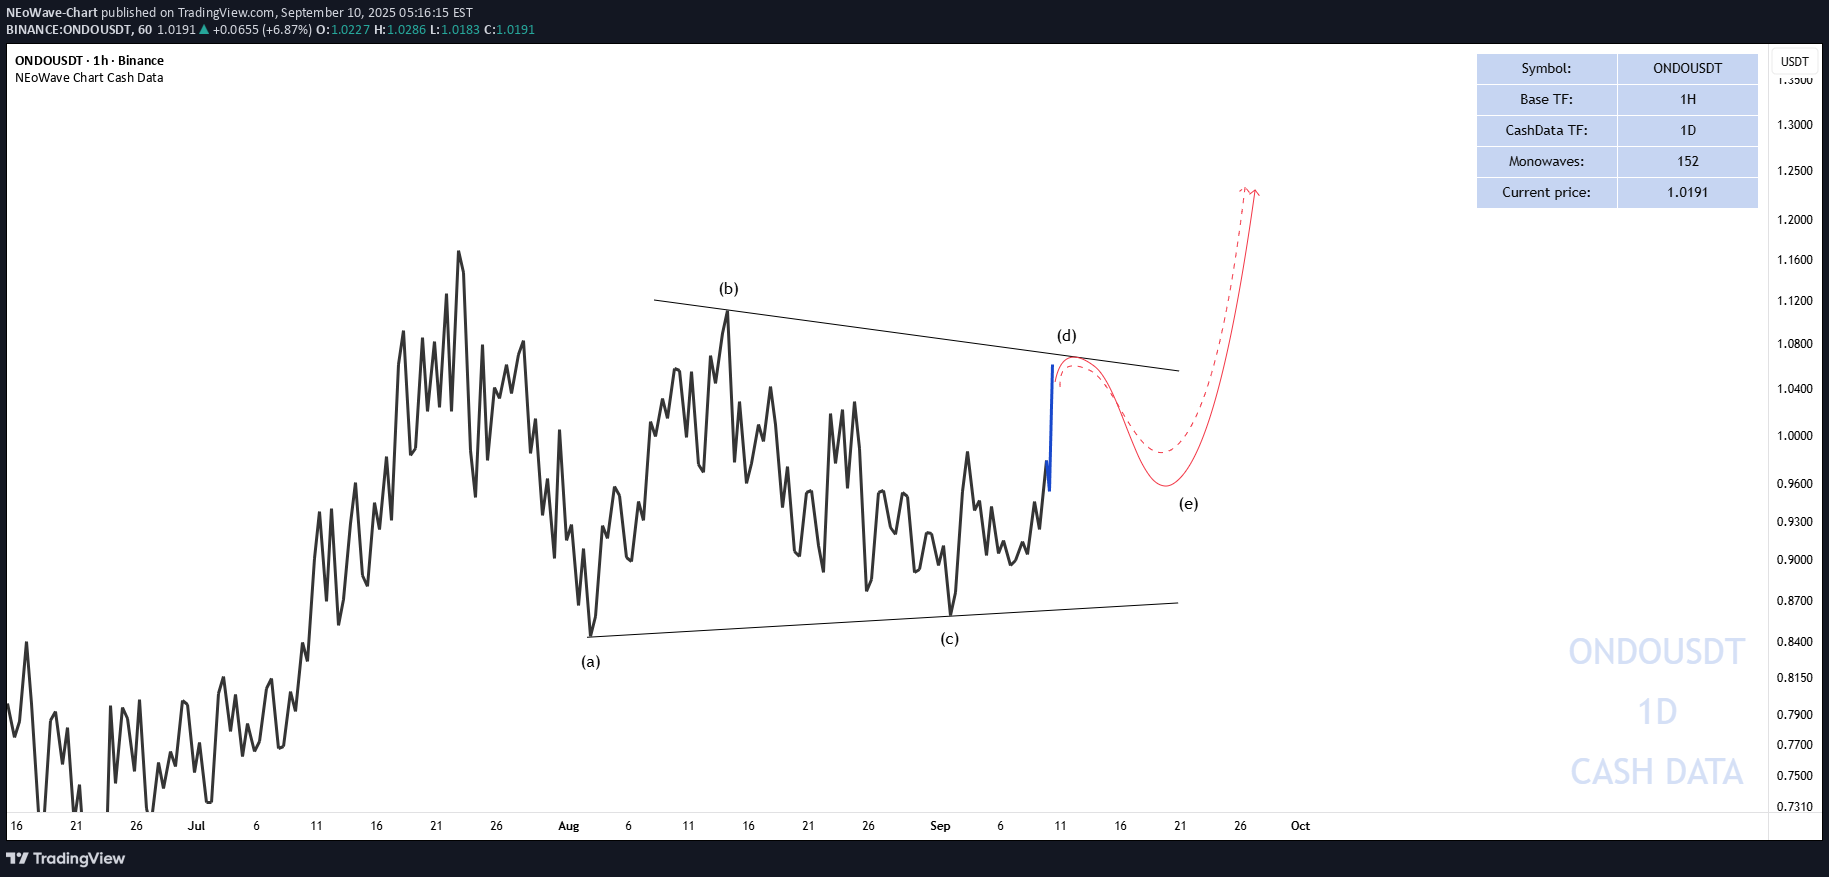
In the daily cash data, it appears that ONDO is forming a horizontal contracting triangle. Wave (d) of this pattern is completing in the form of a flat, where wave c of that pattern is a terminal impulse wave of the extended wave-5 type, which is nearly complete, and with the completion of wave (e), the first target for ONDO will be 1.2308. Good luck NEoWave Chart
NEoWave-Chart
Cardano (ADA)
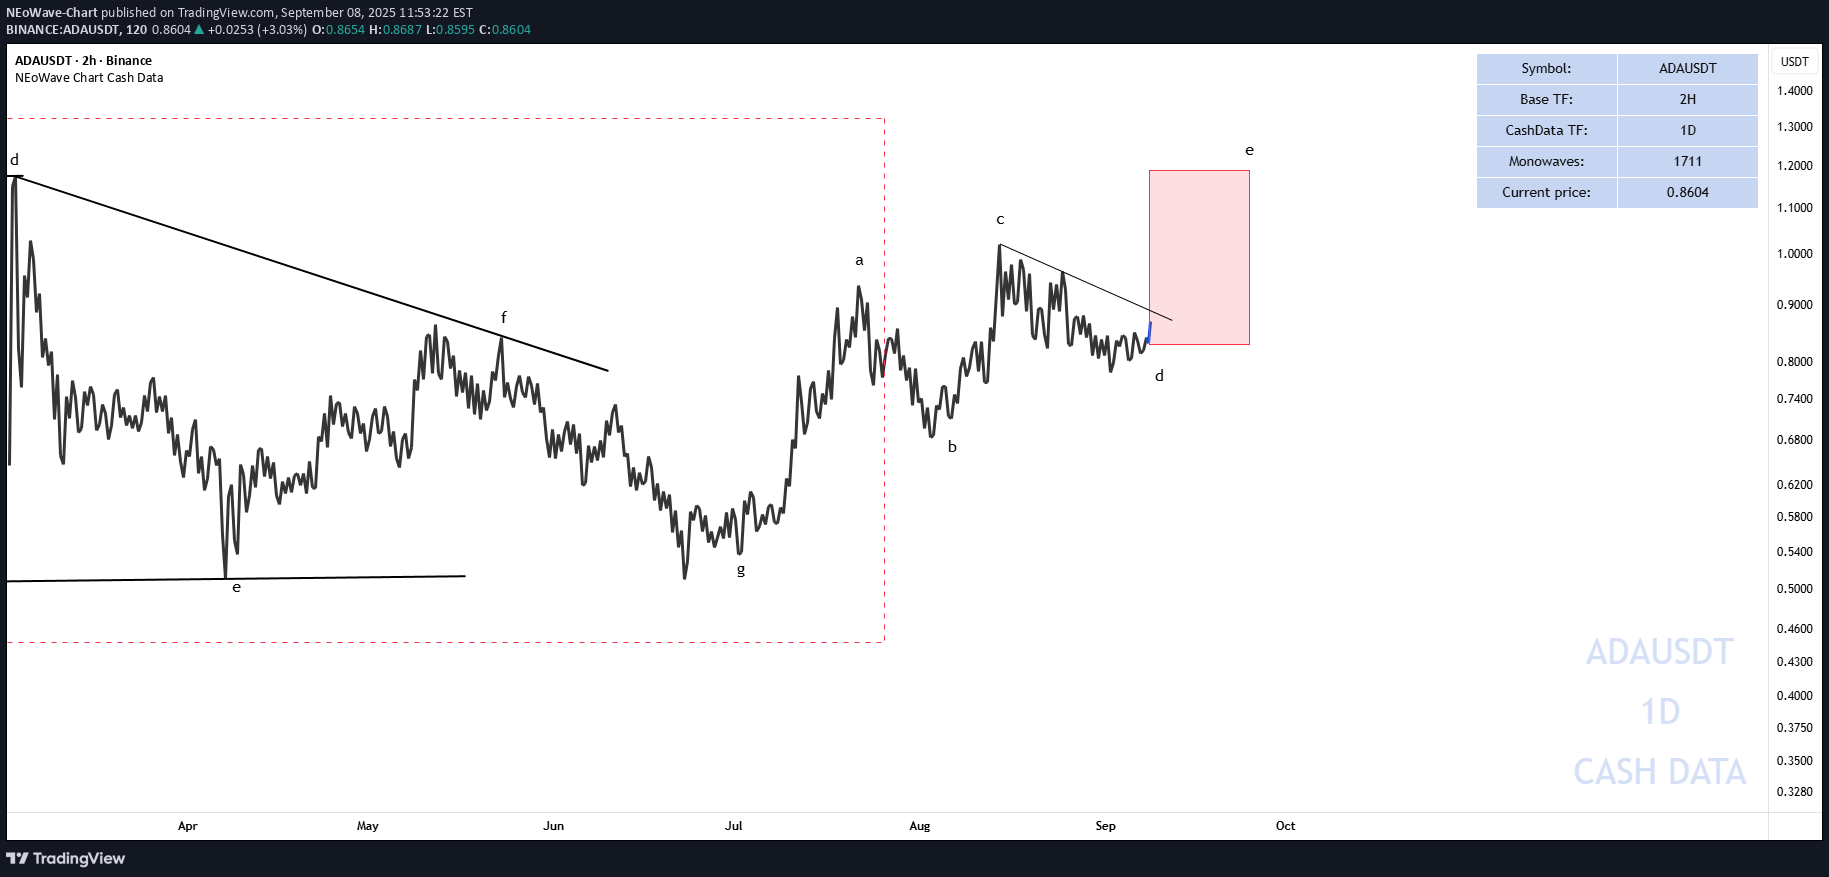
Cardano (ADA) is showing potential for an upward move towards the $1.1882 price level. This move could be initiated by a break of the downtrend line, drawn from point C (part of the highlighted price pattern). Traders should wait for a confirmation of this trendline break with high trading volume to increase the likelihood of this scenario succeeding. Good luck NEoWave Chart
NEoWave-Chart
Gold Forecast 2025: Expert NEoWave Analysis
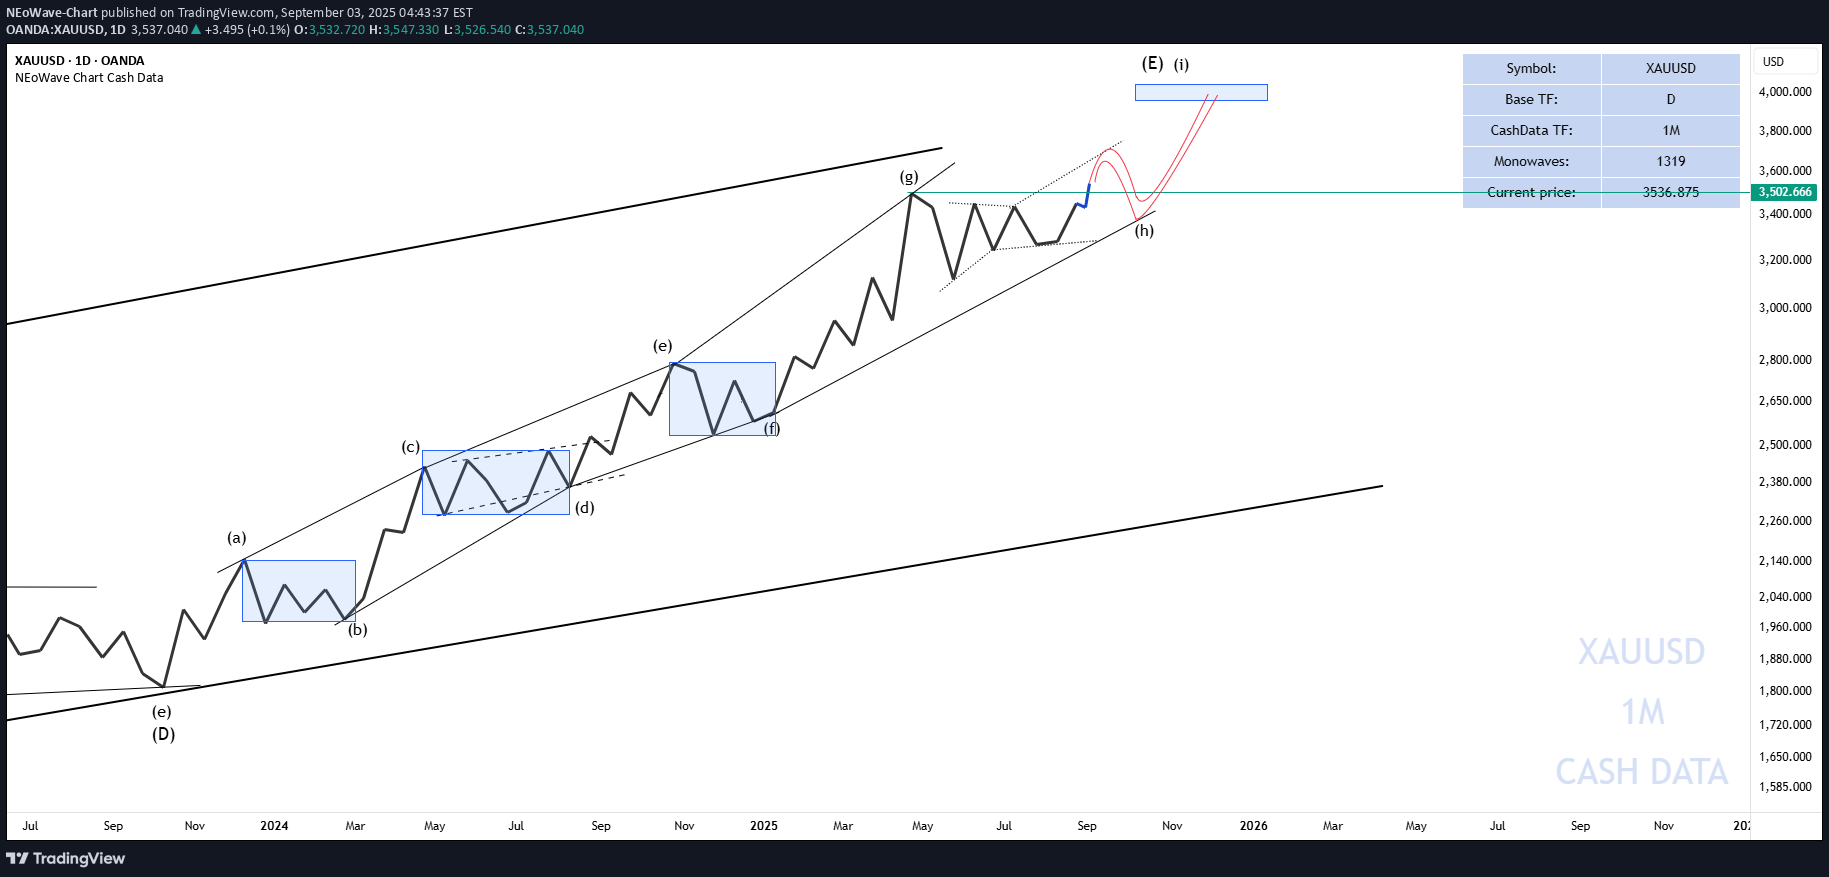
We previously mentioned that wave-(E) itself is forming a diametric pattern, and we considered wave-g of (E) to be a double pattern with a small X-wave. However, wave-b of the X-wave pattern has exceeded the allowable time range, and the current wave we are in shows similarities in terms of time and price with waves (b)-(d)-(f). Conclusion: Based on the points mentioned above, it appears that wave-(E) of the higher-degree diametric is transitioning into a symmetrical pattern, and we are currently in wave-(f) of this symmetrical pattern. Wave-(f) of the symmetrical pattern is forming a bow-tie diametric, and wave-f of this bow-tie diametric is not yet complete. This wave could complete in the price range of $3,540 to $3,740, followed by a price correction to the $3,460–$3,380 range, and then a move toward the target of $3,900–$4,050. Under normal circumstances, after reaching the $3,900–$4,050 range, we would expect wave-(F) of the higher-degree diametric to form. However, given the unusual global economic conditions and geopolitical issues, we may need to update our analysis, and it might not proceed as expected. For now, our final target remains $3,900–$4,050. Good luck NEoWave ChartGold touched $3700 Since I posted this analysis it has grown by 3785 pips (11%) and I have been saying that any correction in gold is a buying opportunity. ⚠️From here, I expect a short-term price correction and then a move to $3900-4050, meaning I have no buying offer at this price (the decision to sell is up to you). ⚠️ If a price correction occurs, we can buy again for the mentioned targets. ⚠️ Note that in my opinion, gold is still bullish in the long term.
NEoWave-Chart
Disclaimer
Any content and materials included in Sahmeto's website and official communication channels are a compilation of personal opinions and analyses and are not binding. They do not constitute any recommendation for buying, selling, entering or exiting the stock market and cryptocurrency market. Also, all news and analyses included in the website and channels are merely republished information from official and unofficial domestic and foreign sources, and it is obvious that users of the said content are responsible for following up and ensuring the authenticity and accuracy of the materials. Therefore, while disclaiming responsibility, it is declared that the responsibility for any decision-making, action, and potential profit and loss in the capital market and cryptocurrency market lies with the trader.