Muhannadchart
@t_Muhannadchart
What symbols does the trader recommend buying?
Purchase History
پیام های تریدر
Filter
Signal Type

Muhannadchart

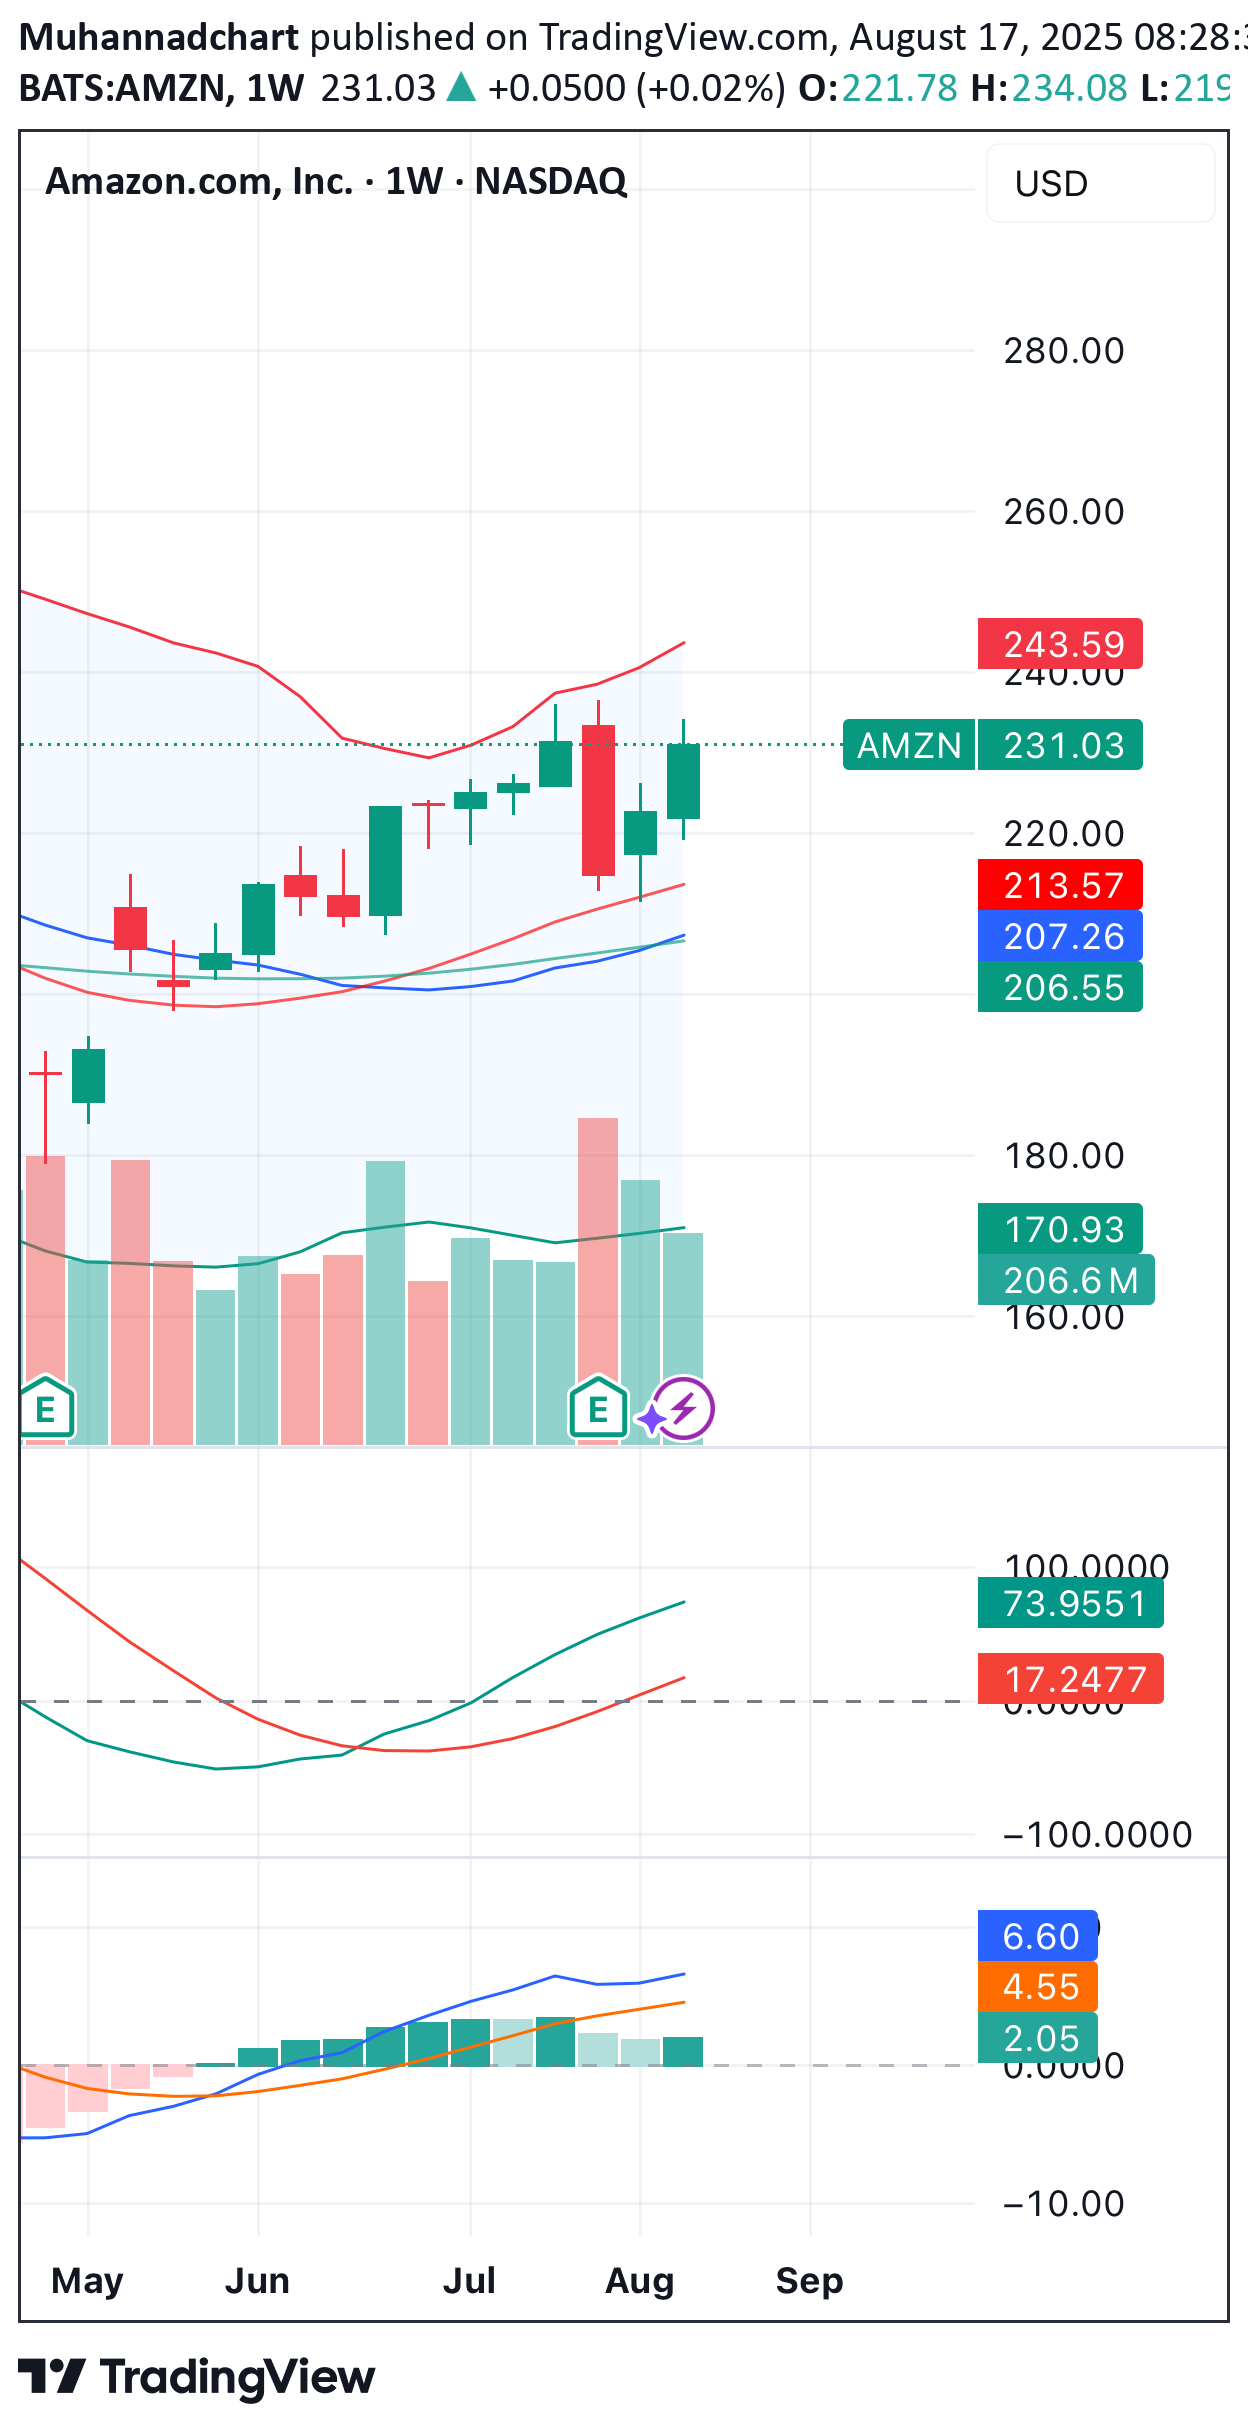
AMZN closed at $231.03 and is showing strength after bouncing from the support zone around $207 – $213. The weekly chart indicates buyers are regaining control, supported by increasing volume and positive momentum indicators. 🎯 Targets: •First target: $243 •Second target: $260 Stop-loss: Weekly close below $213.

Muhannadchart

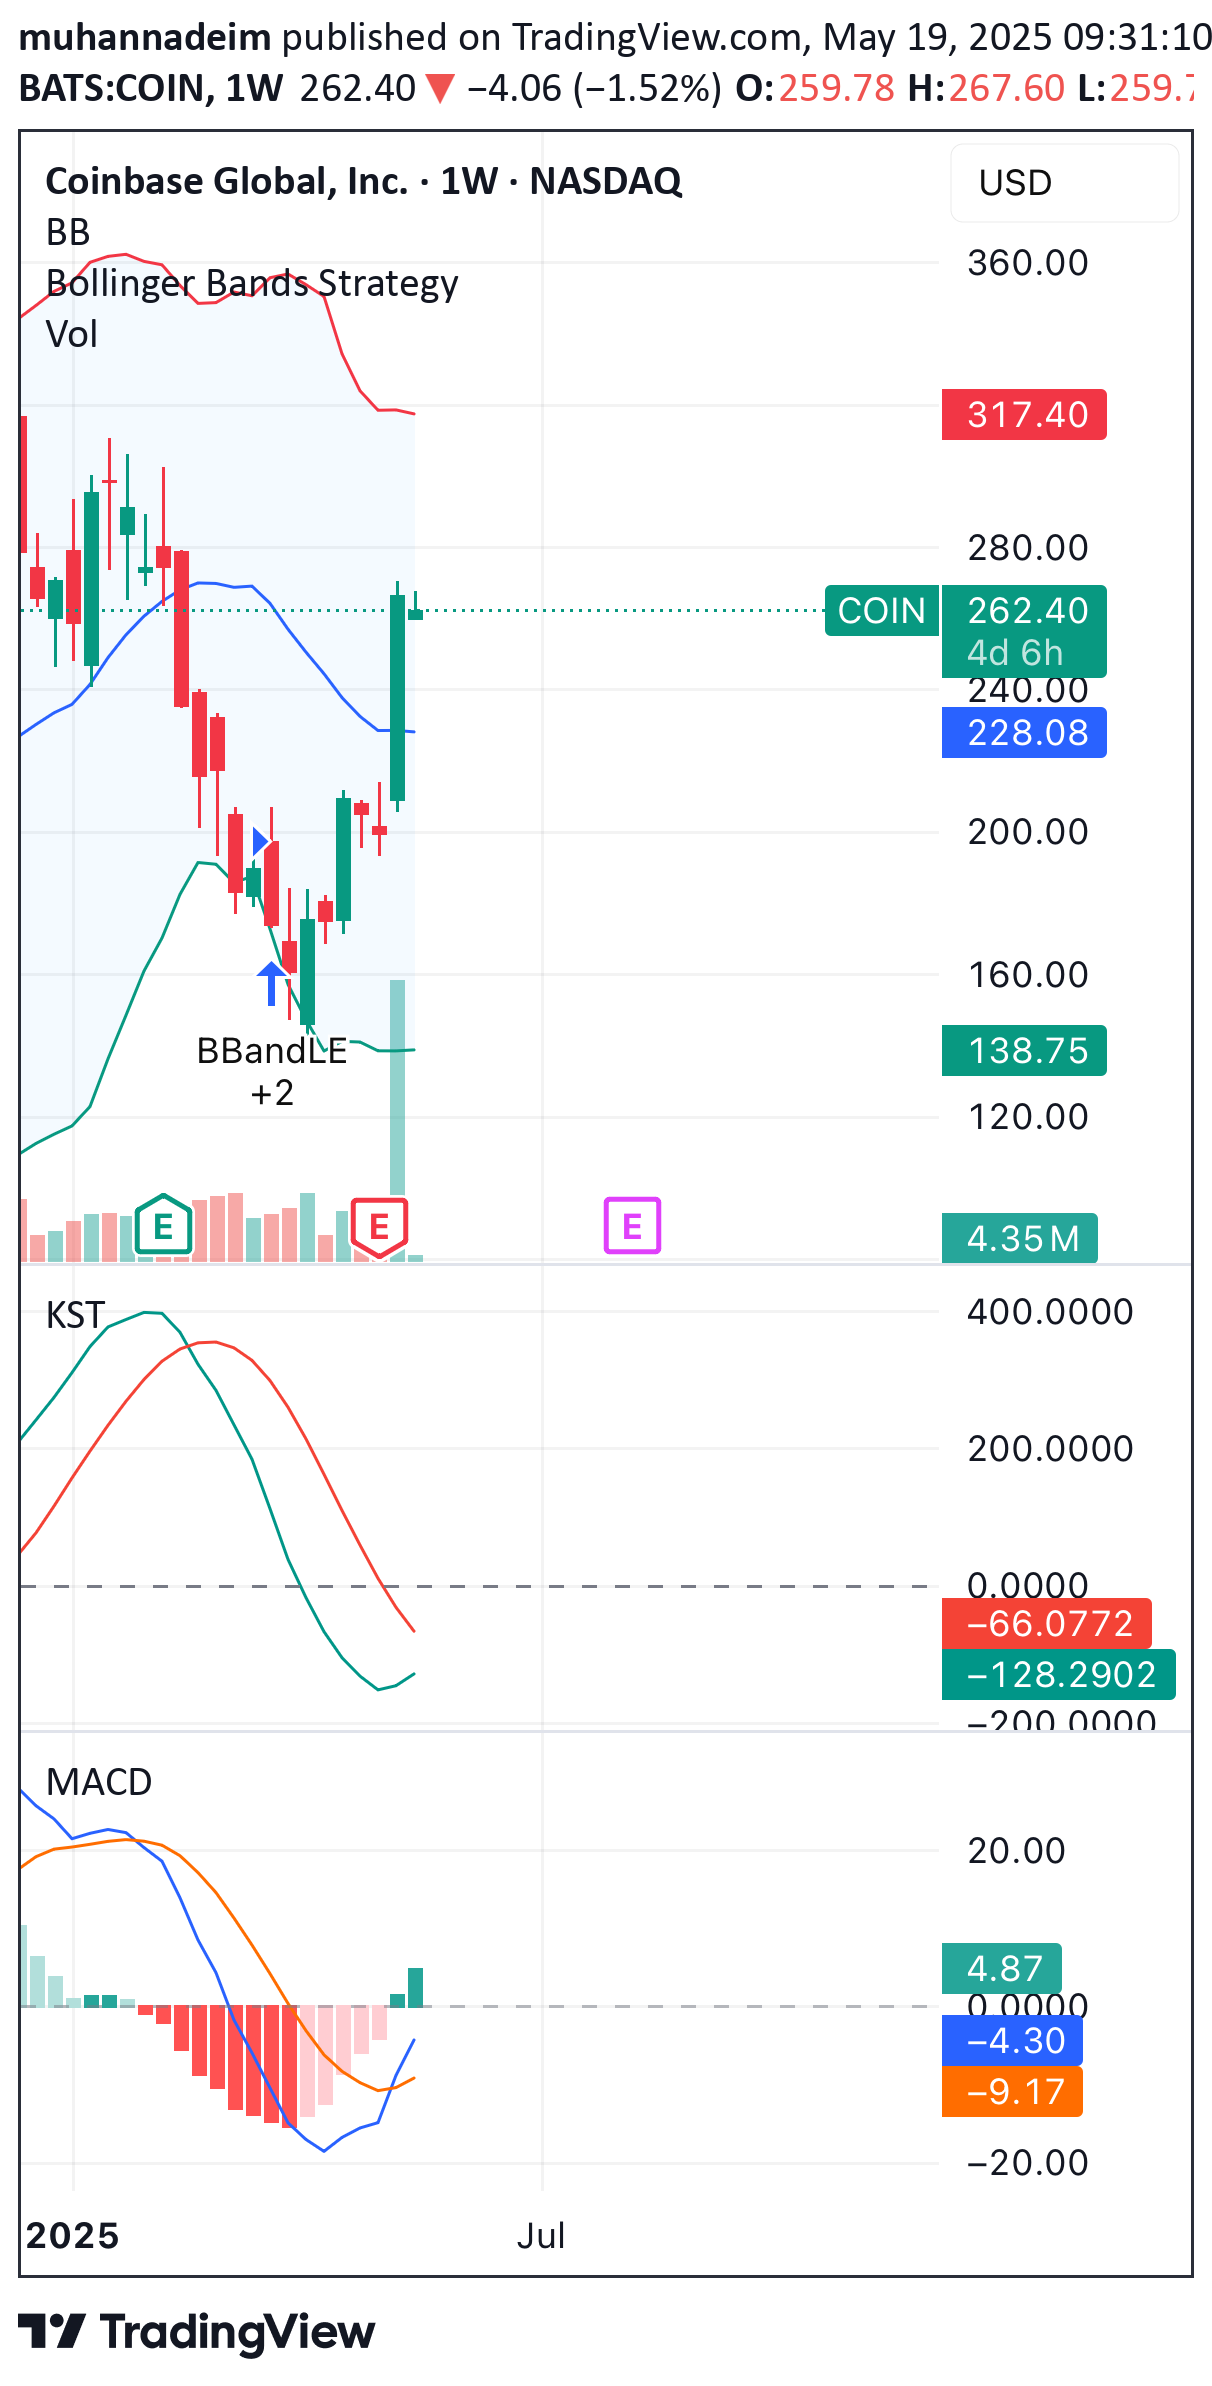
COIN (Coinbase) is showing strong bullish momentum after breaking above the $250 zone. The price is holding above the middle Bollinger Band with increasing volume. MACD is crossing to the upside, supporting further continuation toward the $317 resistance level. Trade Setup: •Entry Zone: $260 - $263 (Current Price) •First Target: $280 •Second Target: $317 •Stop Loss: Below $240 Technical Analysis Highlights: •Strong price action above the middle Bollinger Band. •Bullish MACD crossover. •Volume expansion confirms the breakout. Recommendation: Consider entering long positions above $260 with targets at $280 and $317, while managing risk below $240.
Disclaimer
Any content and materials included in Sahmeto's website and official communication channels are a compilation of personal opinions and analyses and are not binding. They do not constitute any recommendation for buying, selling, entering or exiting the stock market and cryptocurrency market. Also, all news and analyses included in the website and channels are merely republished information from official and unofficial domestic and foreign sources, and it is obvious that users of the said content are responsible for following up and ensuring the authenticity and accuracy of the materials. Therefore, while disclaiming responsibility, it is declared that the responsibility for any decision-making, action, and potential profit and loss in the capital market and cryptocurrency market lies with the trader.