
Mozart-BTC
@t_Mozart-BTC

What symbols does the trader recommend buying?
Purchase History
پیام های تریدر
Filter
Signal Type
Mozart-BTC
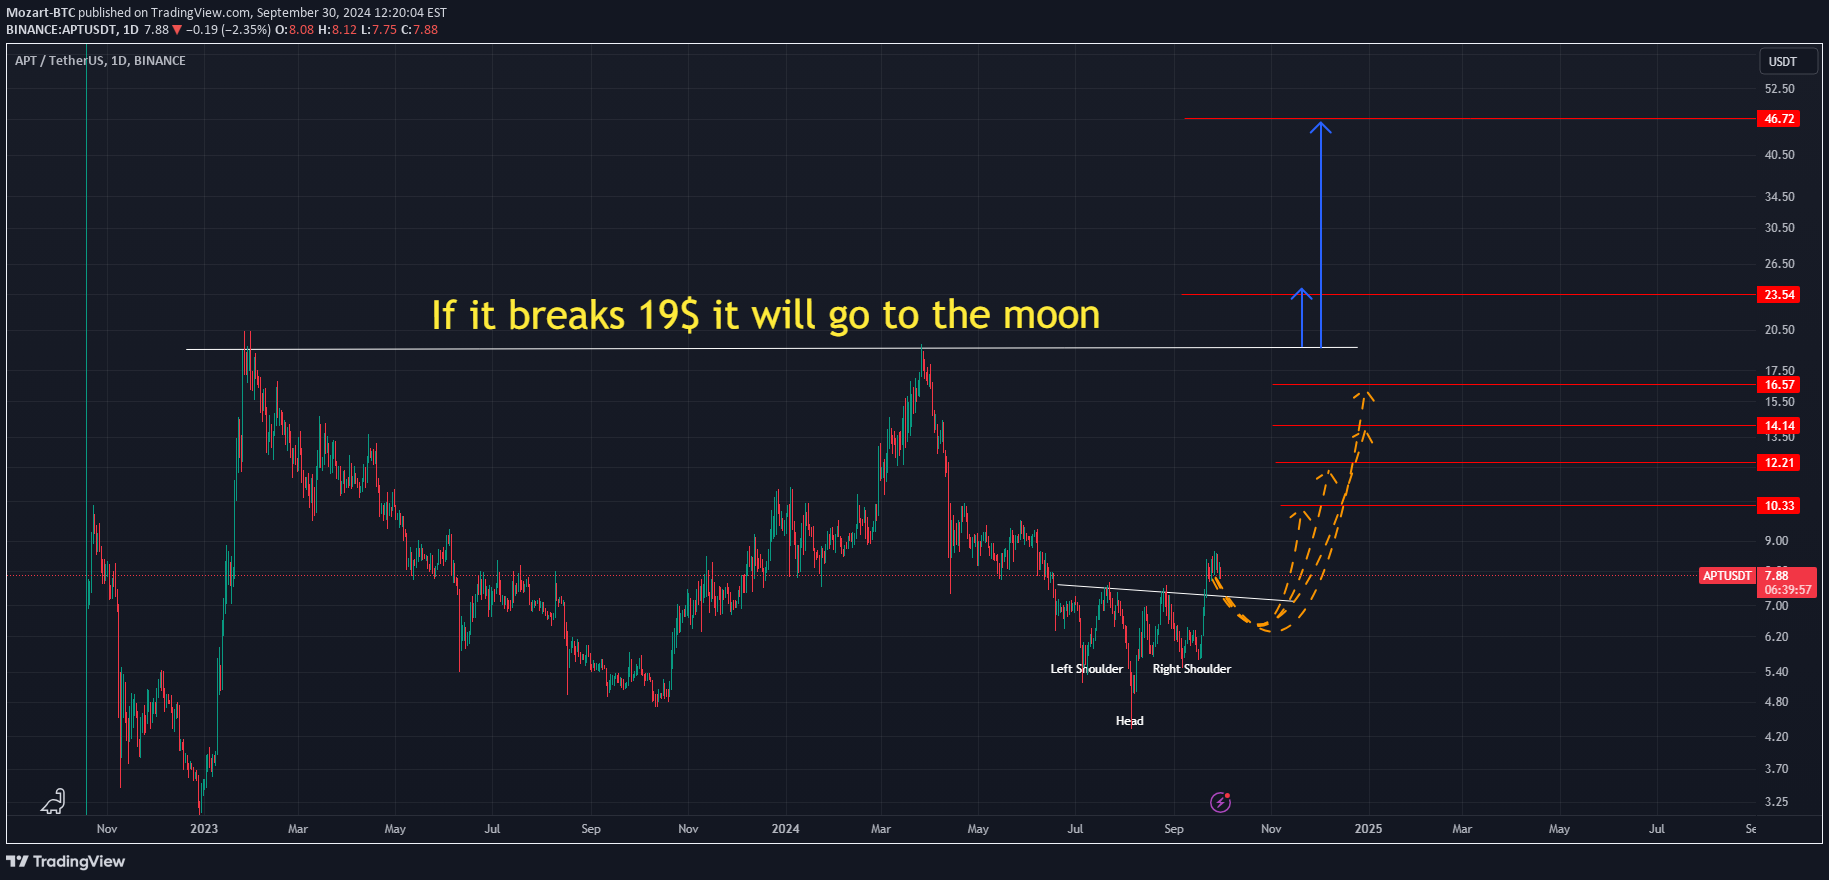
inverse Head and shouldersAn inverse head and shoulders is similar to the standard head and shoulders pattern, but inverted.It may be used to predict reversals in downtrends.An inverse head and shoulders pattern, upon completion, signals a bull market.Investors typically enter into a long position when the price rises above the resistance of the neckline.
Mozart-BTC
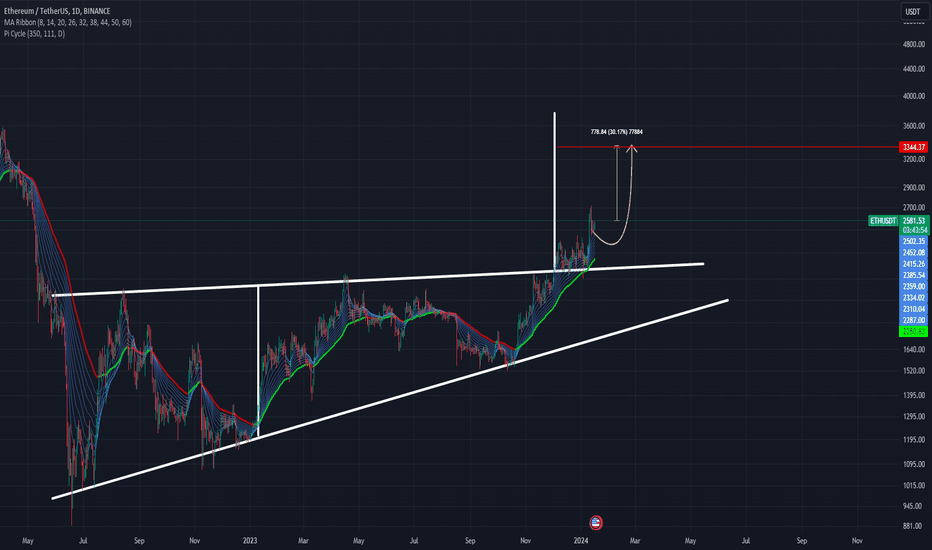
T=3344In technical analysis, a triangle is a continuation pattern on a chart that forms a triangle-like shape.Triangles are similar to wedges and pennants and can be either a continuation pattern, if validated, or a powerful reversal pattern, in the event of failure.There are three potential triangle variations that can develop as price action carves out a holding pattern, namely ascending, descending, and symmetrical triangles.
Mozart-BTC
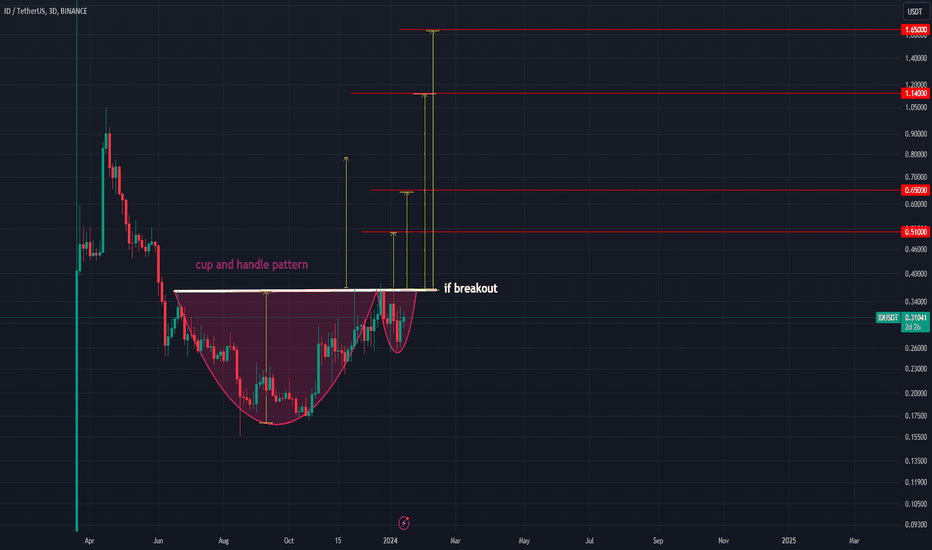
if breakout T=0.51T2=0.65T3=1.14A cup and handle is a technical chart pattern that resembles a cup and handle where the cup is in the shape of a "u" and the handle has a slight downward drift.A cup and handle is considered a bullish signal extending an uptrend, and it is used to spot opportunities to go long.Technical traders using this indicator should place a stop buy order slightly above the upper trendline of the handle part of the pattern.The pattern was first described by William J. O'Neil in his 1988 classic book on technical analysis, How to Make Money in Stocks.
Mozart-BTC
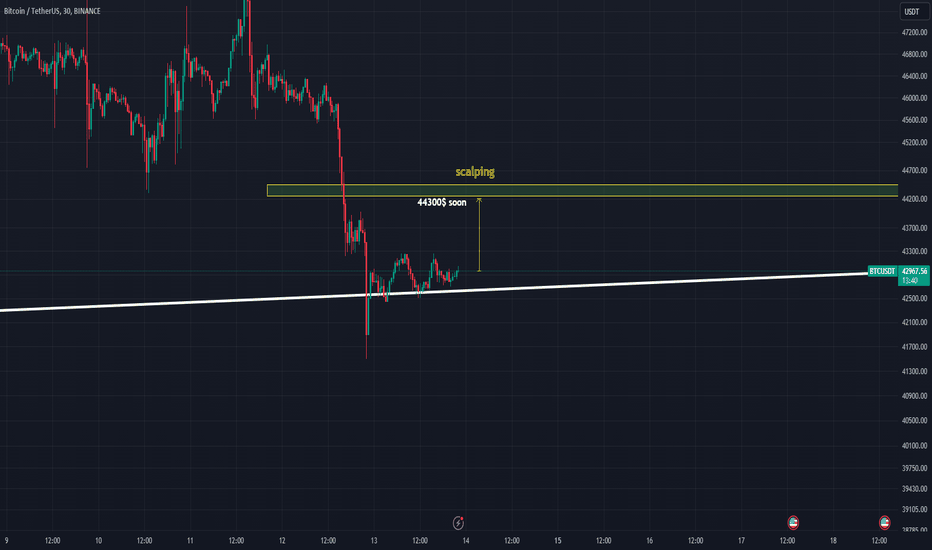
scalping T=44300Scalping is a trading style that specializes in profiting off of small price changes and making a fast profit off reselling.
Mozart-BTC
In technical analysis, a triangle is a continuation pattern on a chart that forms a triangle-like shape.Triangles are similar to wedges and pennants and can be either a continuation pattern, if validated, or a powerful reversal pattern, in the event of failure.There are three potential triangle variations that can develop as price action carves out a holding pattern, namely ascending, descending, and symmetrical triangles.
Mozart-BTC
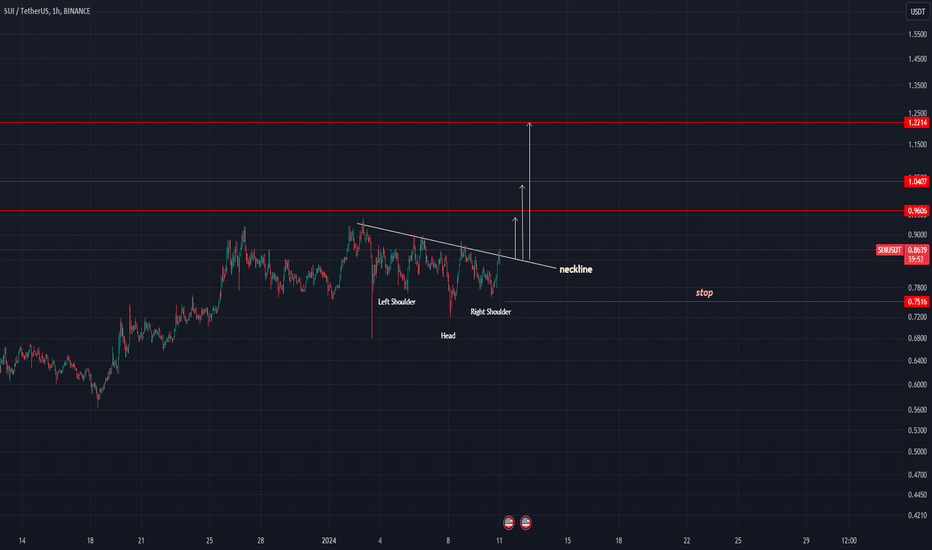
A head and shoulders pattern is a technical indicator with a chart pattern of three peaks, where the outer two are close in height, and the middle is the highest.A head and shoulders pattern—considered one of the most reliable trend reversal patterns—is a chart formation that predicts a bullish-to-bearish trend reversal.An inverse head and shoulders pattern predicts a bearish-to-bullish trend.The neckline rests at the support or resistance lines, depending on the pattern direction.
Mozart-BTC
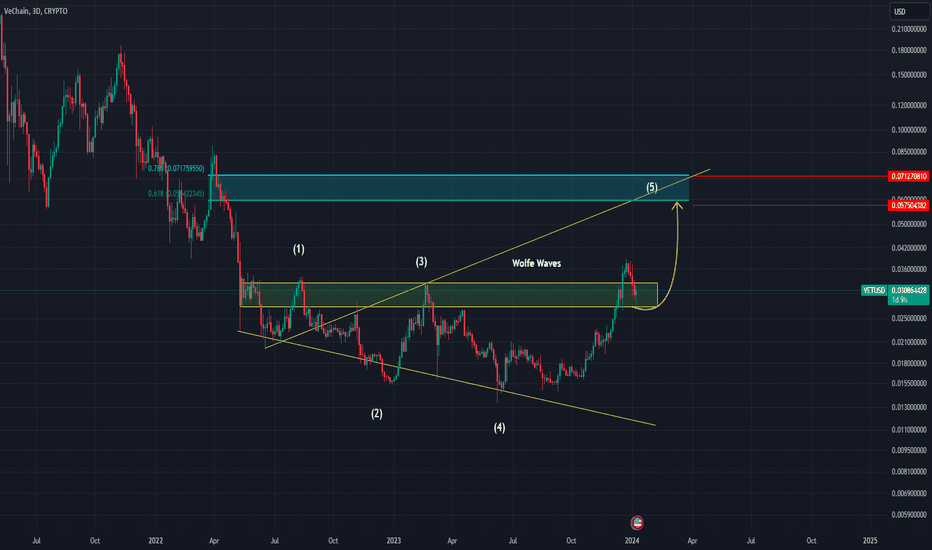
T=0.057T2=0.071In technical analysis, Wolfe Waves are price patterns consisting of five waves that indicate either bullish or bearish trends.To be properly identified as a Wolfe Wave a series of criteria must be met, such as wave cycles each being similar and distinct price action in the third and fourth waves.For a true Wolfe Wave, the fifth wave instance in the pattern will be followed by a breakout in price.
Mozart-BTC
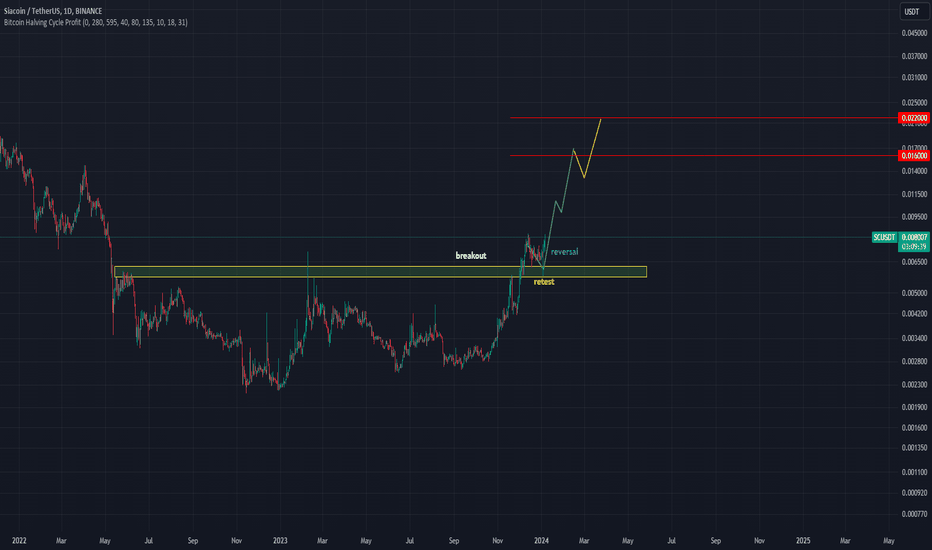
Update idea T=0.016T2=0.022The breakout: This is the initial movement where the price breaches a significant support or resistance level. It's essential to look for signs of genuine momentum and increased trading volume during this phase to validate the breakout.The retest: Following the breakout, the price retraces back to the level it previously broke through.The reversal: This is price action confirmation that broken resistance has turned into support (in the case of a bullish breakout) or broken support has turned into resistance if the (in the case of a bearish breakout). The confirmation comes in the form of a reversal candle. Typical reversal candles are long-tailed hammer or pin-bar candles, but they can also be engulfing candles or multi-candle reversal patterns.
Mozart-BTC
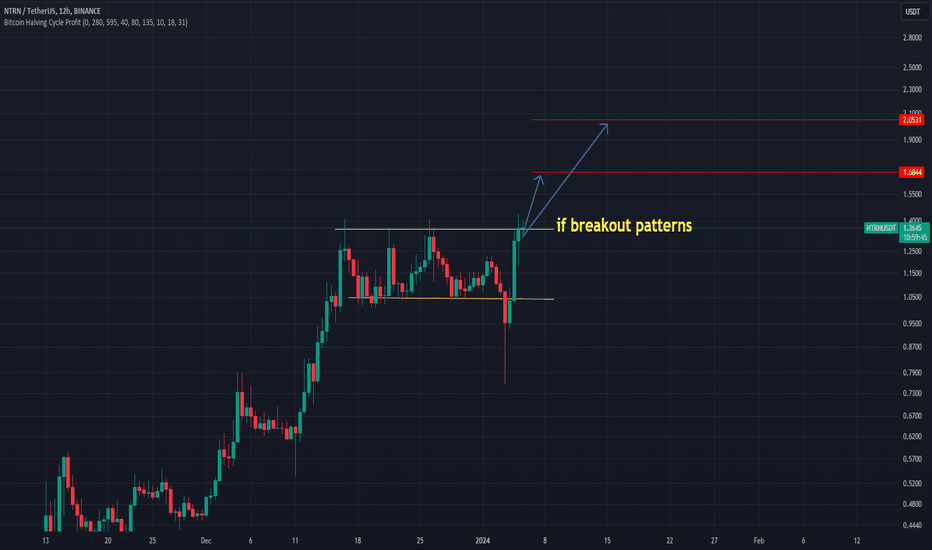
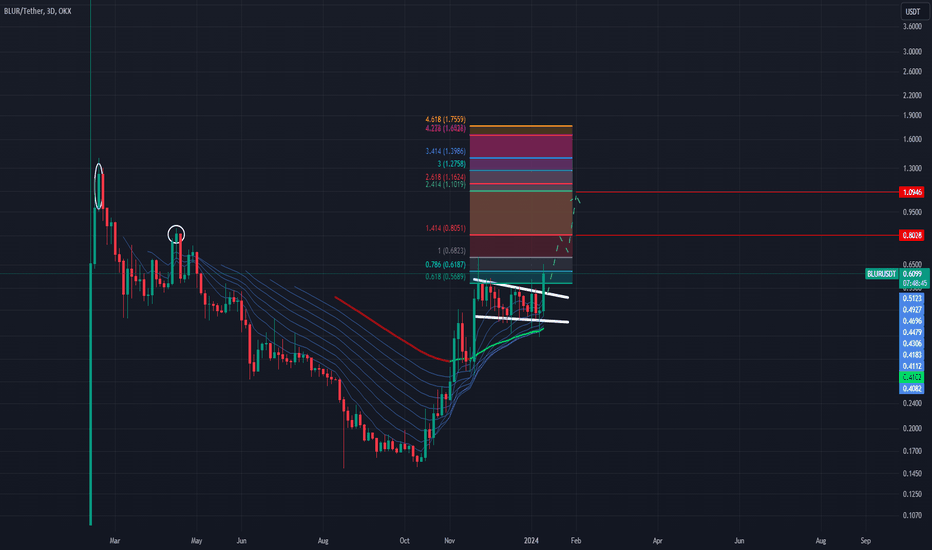
T=1.68T2=2A breakout is a potential trading opportunity that occurs when an asset's price moves above a resistance level or moves below a support level on increasing volume.The first step in trading breakouts is to identify current price trend patterns along with support and resistance levels in order to plan possible entry and exit points.Once you've acted on a breakout strategy, know when to cut your losses and re-assess the situation if the breakout sputters.As with any technical trading strategy, don't let emotions get the better of you. Stick with your plan and know when to get in and get out.
Mozart-BTC
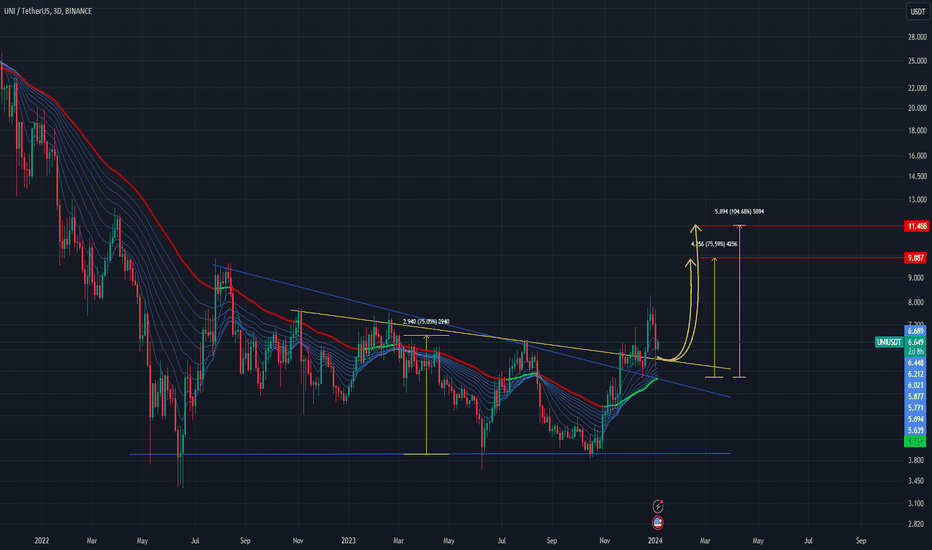
T=9.8T2=11.48In technical analysis, a triangle is a continuation pattern on a chart that forms a triangle-like shape.Triangles are similar to wedges and pennants and can be either a continuation pattern, if validated, or a powerful reversal pattern, in the event of failure.There are three potential triangle variations that can develop as price action carves out a holding pattern, namely ascending, descending, and symmetrical triangles.
Disclaimer
Any content and materials included in Sahmeto's website and official communication channels are a compilation of personal opinions and analyses and are not binding. They do not constitute any recommendation for buying, selling, entering or exiting the stock market and cryptocurrency market. Also, all news and analyses included in the website and channels are merely republished information from official and unofficial domestic and foreign sources, and it is obvious that users of the said content are responsible for following up and ensuring the authenticity and accuracy of the materials. Therefore, while disclaiming responsibility, it is declared that the responsibility for any decision-making, action, and potential profit and loss in the capital market and cryptocurrency market lies with the trader.