
MoriartyTrading
@t_MoriartyTrading

What symbols does the trader recommend buying?
Purchase History
پیام های تریدر
Filter
MoriartyTrading
#SOLUSDT maintains a bearish setup
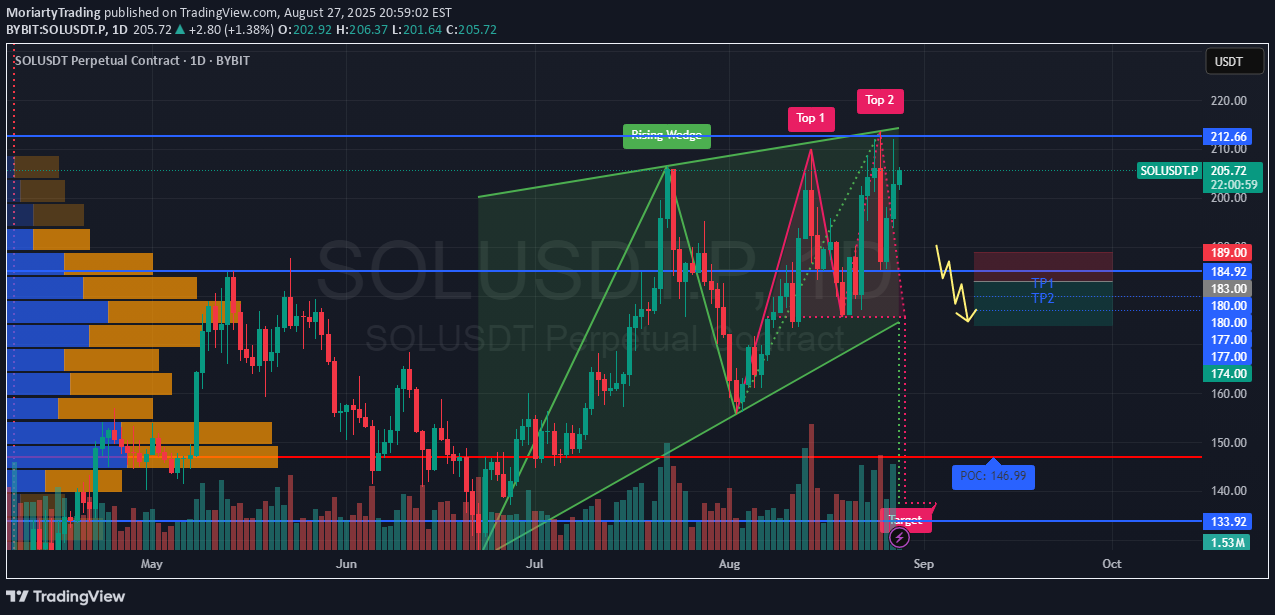
📉 SHORT from $183.00 🛡 Stop loss $189.00 🕒 Timeframe: 1D ❗ If the price consolidates above $189, the setup becomes invalid. ⚡ Overview: ➡️ On the daily chart, a Rising Wedge has formed — a bearish pattern signaling potential reversal. ➡️ The $183.00 level is the key zone where the short scenario gets activated. ➡️ The POC at $146.99 remains a strong long-term magnet for price. ➡️ Increasing volumes on red candles confirm seller interest. 🎯 TP Targets: 💎 TP 1: $180.00 💎 TP 2: $177.00 💎 TP 3: $174.00 📢 Short entry is optimal from $183 with a clear stop at \$189. 📢 Focus on holding below $183 — this will confirm the bearish continuation. 📢 In the long term, if $174 breaks, the target could extend to the $147 (POC) zone. 🚀 #SOLUSDT maintains a bearish setup — as long as price holds below $183, expect a move toward $174 and potentially further downside.
MoriartyTrading
Rising Wedge for #BTCUSDT

What’s visible on the BTCUSDT.P chart:📈 Rising Wedge:➡️ This is a potentially bearish pattern for BTCUSDT.P , especially when it appears after a strong rally following a deep drop (which is exactly the case here).➡️ The price has almost reached the upper boundary of the wedge and has already formed a second top (Top 2) — a signal of possible weakness.🔵 Levels:➡️ POC BTCUSDT.P — $82,490.8 has already been broken to the upside, indicating current market strength.➡️ The price is approaching major resistance at $83,807.1 — momentum is already slowing down in this zone.➡️ Support remains in the $80,449.7 – $78,412.7 area.📊 Volume:➡️ The rally was supported by high volume, but the most recent candles show declining volume as the price nears the top of the wedge.➡️ This could indicate weakening buying pressure.📉 Why it’s important to be cautious with long positions:➡️ A rising wedge can act as a bull trap.➡️ The price is near a critical resistance — even a small pullback could lead to a wedge breakdown.➡️ After such a steep run (from 73K to almost 84K), the chance of profit-taking and a pullback is high.➡️ Volume is declining — bullish momentum may be fading.📢 Conclusion:➡️ Opening a BTCUSDT.P long position right now is risky because:- the wedge structure suggests a potential reversal to the downside;- there’s no breakout above the previous high with confirmation;- and volume does not support further upward movement.❗️ It's better to watch how the price reacts to the wedge and BTCUSDT.P key levels — a long entry is only valid if the price breaks and holds above $83,800–84,000 with strong volume.➡️ Until then, a neutral or cautiously bearish position is more appropriate.
MoriartyTrading
#ATOMUSDT shows a strong bullish impulse

📈 LONG ATOMUSDT.P from $5.100🛡 Stop loss $4.948🕒 4H Timeframe⚡️ Overview:➡️ The POC (Point of Control) ATOMUSDT.P is at $4.628, which marks the high-volume area from which the current bullish move started.➡️ A breakout above the $5.00 resistance occurred with strong volume, confirming bullish strength.➡️ The upward move is supported by large green candles and rising trading activity.➡️ The $5.100 entry level aligns with previous consolidations and acts as a flipped support.🎯 TP Targets:💎 TP 1: $5.188💎 TP 2: $5.280💎 TP 3: $5.350📢 Watch for price holding above $5.00 — it’s key for continued upside.📢 If price drops below $4.948, the long setup becomes invalid. ATOMUSDT.P shows a strong bullish impulse — confirmation via volume and breakout supports the continuation scenario.
MoriartyTrading
#FILUSDT remains under bearish pressure

📉 SHORT FILUSDT.P from $2.616🛡 Stop loss $2.645🕒 1H Timeframe⚡️ Overview:➡️ The POC (Point of Control) FILUSDT.P is located at $2.766, far above the current price — this highlights strong historical selling pressure.➡️ Price is forming lower highs and lower lows, confirming a bearish trend.➡️ The breakdown below $2.616 triggered the short setup with further downside potential.➡️ Volume spikes during red candles indicate continued seller activity.🎯 TP Targets:💎 TP 1: $2.605💎 TP 2: $2.584💎 TP 3: $2.570📢 Watch the $2.616 zone — holding below increases downside probability.📢 If price moves above $2.645, the setup becomes invalid. FILUSDT.P remains under bearish pressure — short bias stays valid under current structure.
MoriartyTrading
#SEIUSDT remains in bullish continuation mode

📉 LONG SEIUSDT.P from $0.2747🛡 Stop loss: $0.2640🕒 Timeframe: 4H✅ Market Overview:➡️ Falling Wedge pattern has played out — confirmed breakout to the upside.➡️ A strong Inverse Head and Shoulders pattern is visible — neckline broken with momentum.➡️ Volume increases on upward impulse — bullish confirmation.➡️ Current price is consolidating slightly — likely preparing for the next leg up.➡️ POC at $0.1697 is far below — market structure flipped bullish.➡️ Clear upward projection toward the $0.2810–$0.2910 range.🎯 TP Targets:💎 TP 1: $0.2810💎 TP 2: $0.2870💎 TP 3: $0.2910📢 Holding above $0.2740 confirms bullish structure.📢 Watch for minor resistance near TP1, then potential continuation to TP2 and TP3.📢 Secure partial profits at TP1, and let the rest ride toward higher targets.📢 It’s advisable to partially take profits near the specified resistance levels.📢 A retest of the breakout zone (around $0.22) is possible — this can be used for adding to the position.🚀 SEIUSDT.P remains in bullish continuation mode — targets still active!
MoriartyTrading
#API3USDT is showing signs of recovery

📉 LONG API3USDT.P from $1.1236⚡️ Stop loss $1.1030 🕒 Timeframe: 1H✅ Overview API3USDT.P :➡️ The chart shows a gradual shift from a downtrend to possible reversal after forming strong support around $1.0680.➡️ Price is currently attempting to break above the key resistance zone $1.1234–$1.1236, which also marks the potential LONG entry point.➡️ Volume Profile indicates high trading activity above, with the Point of Control (POC) at $1.2541 — suggesting room for upside movement if breakout holds.➡️ Bullish volume spikes suggest growing buyer interest.➡️ Stop loss set at $1.1030, just below recent consolidation lows.📍 Important Note:Do not rush the entry!Wait for a clear hold above $1.1236 before entering the LONG — entering too early may expose you to fakeouts.🎯 Take Profit Targets:💎 TP 1: $1.1362💎 TP 2: $1.1544💎 TP 3: $1.1707⚡ Plan:➡️ Watch for breakout confirmation above $1.1236➡️ Enter LONG after volume or candle confirmation📢 Consider partial profit at TP1 and move SL to breakeven for risk-free management.🚀 API3USDT.P is showing signs of recovery — if the price holds above the entry zone, further upside is expected!
MoriartyTrading
#XLMUSDT is showing signs of growth

📈 Long XLMUSDT.P from $0.26325🛡 Stop loss $0.25955🕒 1H Timeframe⚡️ Overview:➡️ The main POC (Point of Control) is at 0.25511, indicating the area with the highest trading volume.➡️ The 0.25955 level acts as a local support, as the price previously bounced from this zone.➡️ The volume and market profile highlight areas of high trader activity, especially in the 0.24984 – 0.26325 range.➡️ The chart shows a forming bullish structure, confirming the potential for further upward movement.🎯 TP Targets:💎 TP 1: $0.26630💎 TP 2: $0.26930💎 TP 3: $0.27240📢 Monitor key levels before entering the trade!📢 If 0.25955 is broken downward, the trade may be invalidated.📢 If the price holds above 0.26325 and continues rising, the bullish momentum remains intact.XLMUSDT.P is showing signs of growth—expecting further upside movement!
MoriartyTrading
Scenario #BTCUSDT long

📉 LONG BTCUSDT.P from $104,353.0🛡 Stop loss: $103,572.0🕒 Timeframe: 1H✅ Market overview:➡️ The price confidently broke above $103,729 and held, confirming the uptrend.➡️ The next target zone is $104,720–$105,090 — nearest movement objectives.➡️ Volume increased during the impulse, indicating strong buyer presence.➡️ A local support level formed around $103,729 — on a pullback, this zone may hold the price.➡️ POC at $94,479 remains far below — the market has left the balance zone and is trading in an impulsive phase.🎯 TP Targets BTCUSDT.P:💎 TP1: $104,720.0💎 TP2: $105,090.0💎 TP3: $105,275.0⚠️ Important: current structure BTCUSDT.P suggests possible correction (wedge breakdown), requiring caution or exit on key level loss.⚠️ Despite the initial long from $104,353, a breakdown below $103,572 (stop loss) invalidates the long setup.📢 If H1 closes below $103,572 — better to exit, scenario invalid.🚀 Scenario BTCUSDT.P valid while holding above $103,729 — below that, correction likely toward lower targets!
MoriartyTrading
#HIVEUSDT is maintaining a bearish structure

📉 Short HIVEUSDT.P from $0.2424🛡 Stop loss $0.2455🕒 1H Timeframe⚡️ Overview:➡️ The POC (Point of Control) is at 0.2527, marking the area with the highest trading volume and now acting as major resistance.➡️ The 0.2455 level serves as local resistance — price has already started to decline from that zone.➡️ Price HIVEUSDT.P is steadily moving lower and staying below volume clusters, confirming the bearish structure.➡️ A breakdown below $0.2424 could lead to acceleration toward target zones.🎯 TP Targets:💎 TP 1: $0.2399💎 TP 2: $0.2379💎 TP 3: $0.2366📢 Watch for confirmation of the $0.2424 breakdown — it’s key for continuation.📢 If price reclaims $0.2455, the short setup becomes invalid.HIVEUSDT.P is maintaining a bearish structure — expect quick target reaction if the signal confirms.
MoriartyTrading
#WUSDT is setting up for a breakout

📉 Long WUSDT.P from $0,08897🛡 Stop loss $0,1985 1h Timeframe ⚡ Plan: ➡️ Waiting for consolidation near resistance and increased buying activity before the breakout. ➡️ Expecting an impulsive upward move as buy orders accumulate.🎯 TP Targets:💎 TP 1: $0,09275💎 TP 2: $0,09465💎 TP 3: $0,09566 🚀 WUSDT.P is setting up for a breakout—preparing for an upward move!
Disclaimer
Any content and materials included in Sahmeto's website and official communication channels are a compilation of personal opinions and analyses and are not binding. They do not constitute any recommendation for buying, selling, entering or exiting the stock market and cryptocurrency market. Also, all news and analyses included in the website and channels are merely republished information from official and unofficial domestic and foreign sources, and it is obvious that users of the said content are responsible for following up and ensuring the authenticity and accuracy of the materials. Therefore, while disclaiming responsibility, it is declared that the responsibility for any decision-making, action, and potential profit and loss in the capital market and cryptocurrency market lies with the trader.