
Med_In_Trade
@t_Med_In_Trade

What symbols does the trader recommend buying?
Purchase History
پیام های تریدر
Filter
Med_In_Trade
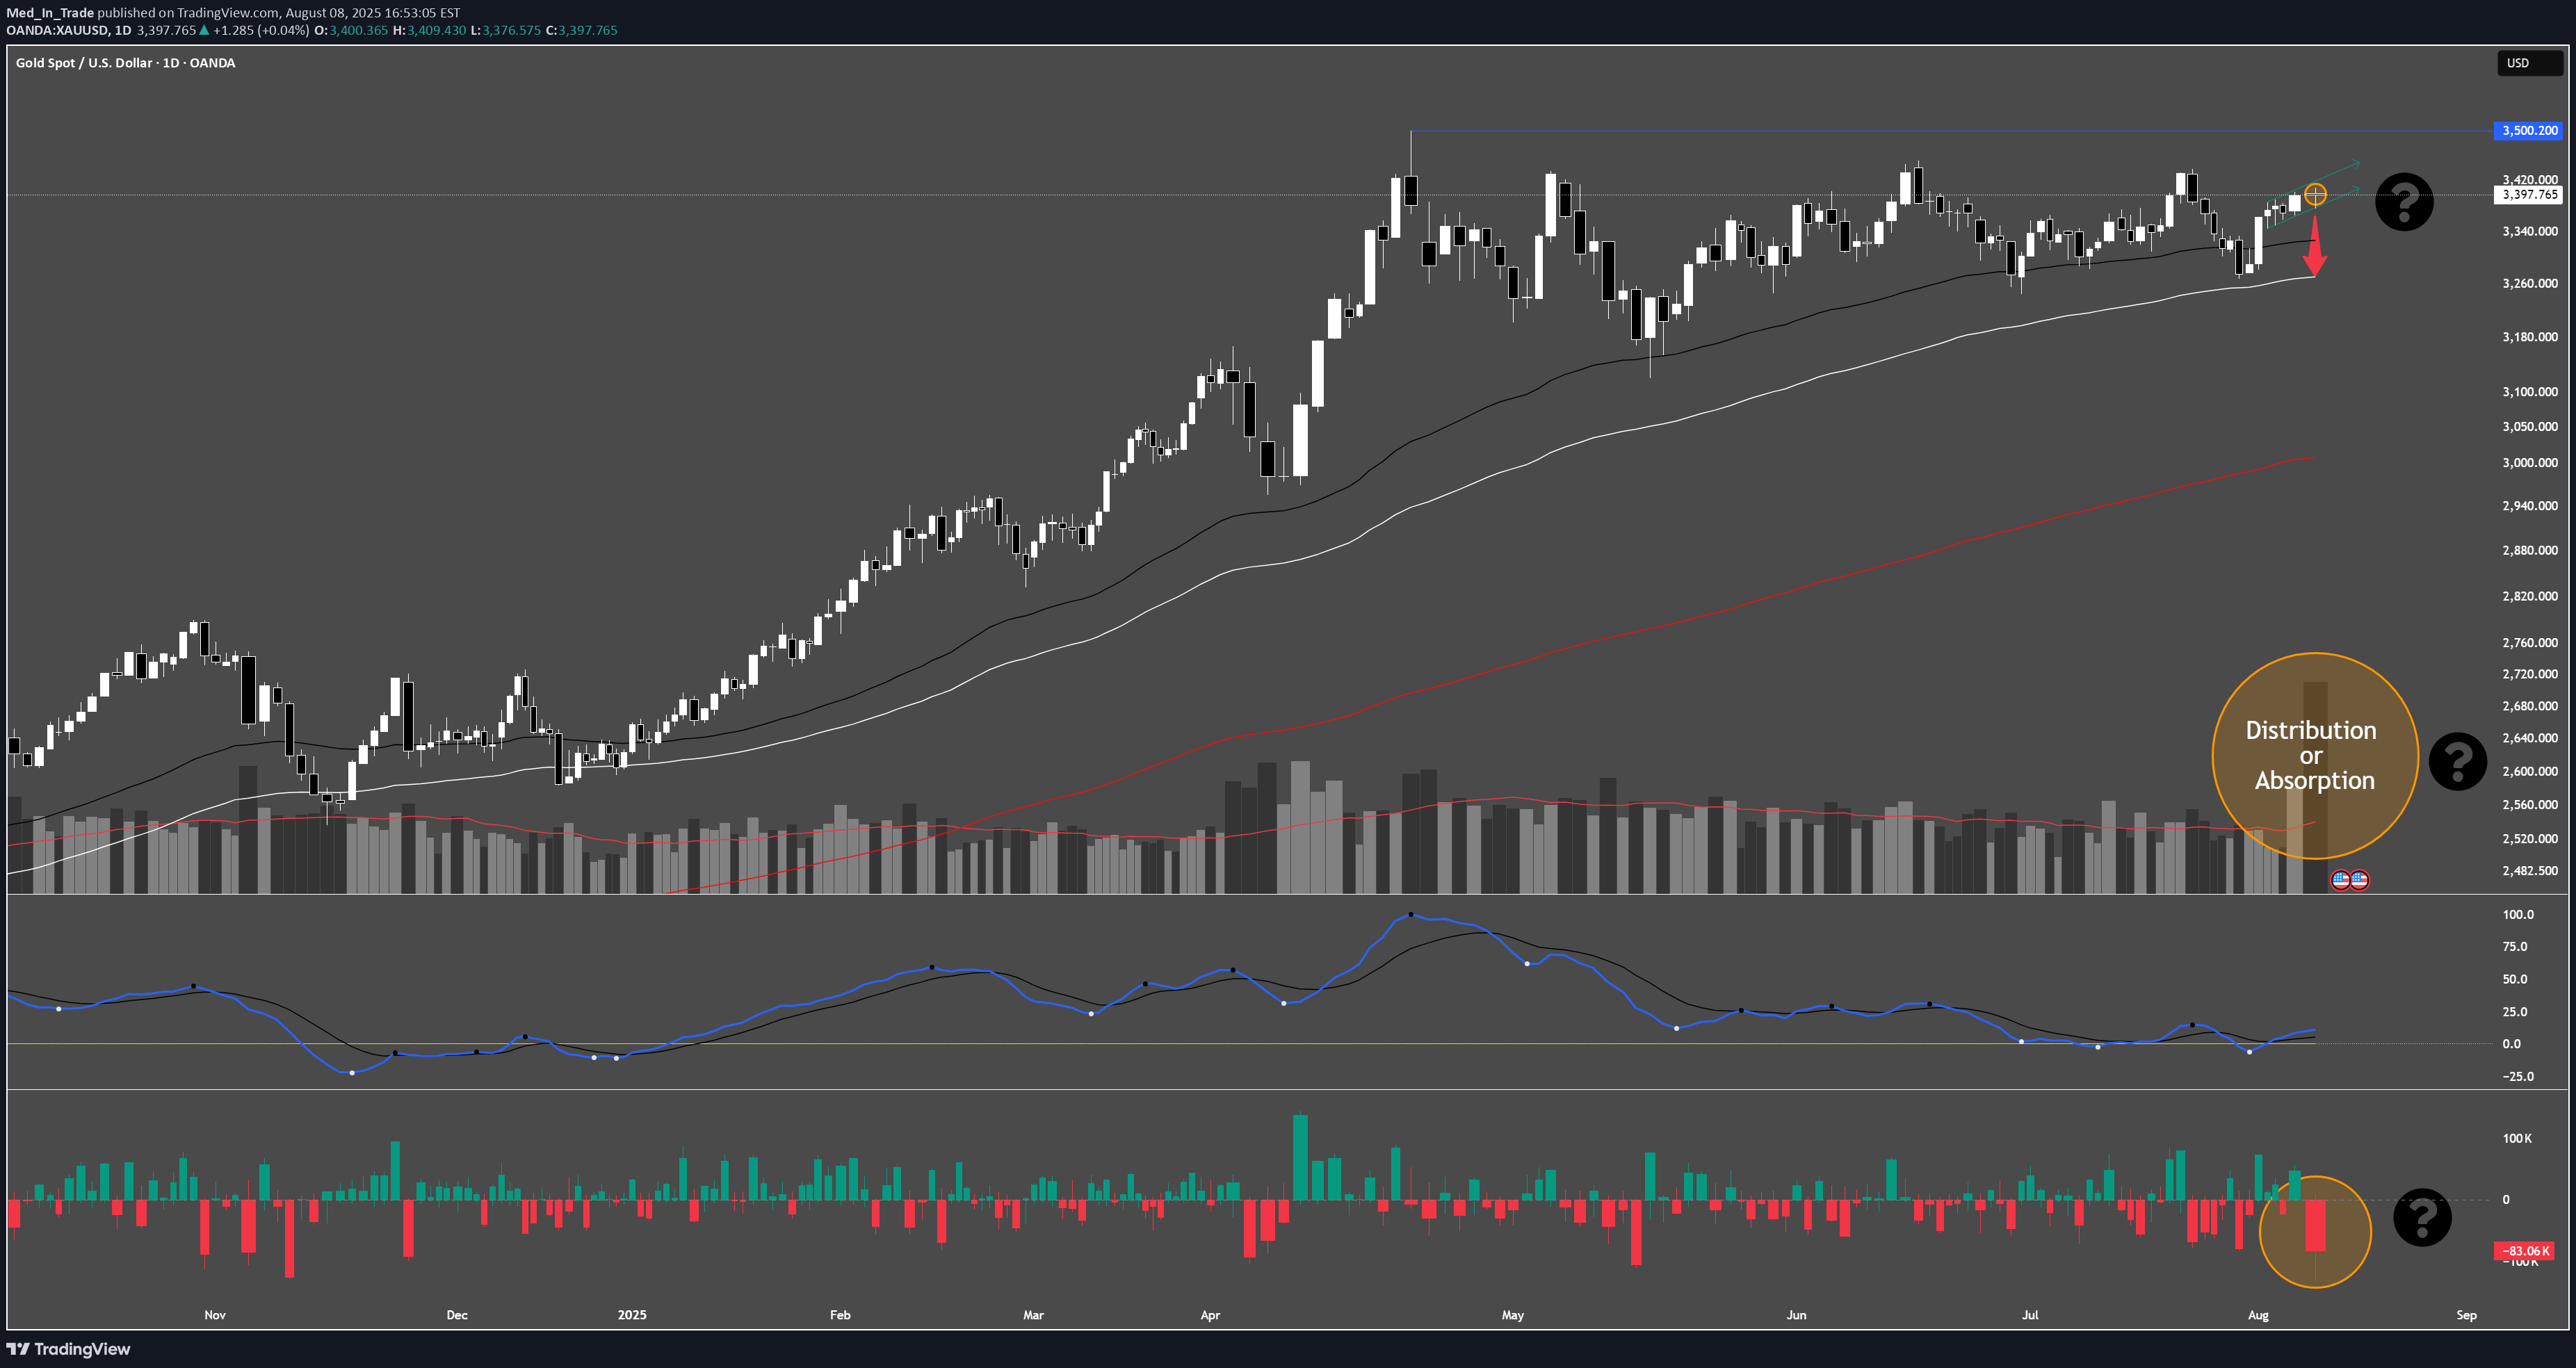
Gold closed the week strong, printing a large bullish daily candle. On the surface, it looks like momentum is ready to push us toward the all-time highs around $3,500. But here’s the tricky part, as always in trading… The volume delta on that candle is massively negative. That means heavy selling pressure came in while price was still moving up. So, what’s going on? Two possible scenarios for next week: 1.Absorption (Bullish Case) Large players are absorbing aggressive sellers, keeping price pinned at the highs. If that’s true, Monday could open with a gap up and follow-through toward new ATH. 2.Distribution (Bearish Case) The big boys are unloading positions into eager late buyers. A gap up that’s quickly sold into or a gap down from Monday’s open could signal a deeper retrace back to the $3,300 area. Key Levels to Watch: $3,400 → Break & hold = ATH in sight. $3,380 → Break & hold = distribution in sight. $3,300 → Possible downside target if distribution confirmed. Monday’s open is critical. The chart tells us there was massive orders on Friday and whichever positions they build up in Friday's range will show next week. And that could decide the trend for the rest of August. As always trade safely peeps!!Tokyo gave us an entry early on at the break of 3392 on LTF for our Daily scalp (250 pips). Hopefully you paid attention in the chaos of the minds section and caught some of that leg down. We also broke below 3380 and price is holding so far (2 hours pre-Europe). Everything indicate that Friday was indeed a distribution phase. Let's see how Europe develop it further OR not. I am most likely done for the day, as you know I don't swing Goldie. BUT if the mark down phase is confirmed with Europe so $3300 will become a very real target. As always be safe with your trades!!Europe has continue the mark down phase as anticipated. We seem to have find support around 3350 after a drop from 3400 area at this morning opening session in Sydney. Price might retrace during New York before resuming the move down to $3300. OR we found the bottom of the reversal move up. If you followed me along you know that I am no longer in the trade. Trade safely!!Still on its way down to $3300...I'll publish a new idea IF it reach $3300.
Med_In_Trade

We are between Phase B and Phase C of a potential Distribution on the higher range (around $3400. Here's the breakdown: Buying Climax (BC) and Automatic Reaction (AR) are well-formed. We are now waiting for the confirmation of the Secondary Tests and also a potential Upthrust Actions near the top around $3400 area. Next logical sweep target will be Buy-side liquidity above PDH area. Possibly creating Secondary test for confirmation. Then it should trigger a markdown phase. If distribution fails, Smart Money would invalidate the entire range with a full Breakout + Retest + Continuation above 3,400 but low probability without more volume or wars. Two scenarios here: Bearish (Higher Probability) Idea: Wait for a Secondary Test or Lower High around the resistance/POI near 3,390–3,396 Entry: Short on rejection or bearish M5 structure break after tagging that area SL: Above 3,400 (or 30-40 pips above ST candle wick) TP1 = 3377 (gap close) TP2 = 3360 (Daily Gap) TP3 = 3338 (PDL retest) 🟩 Bullish (Only if invalidation happens) Idea: If we break above 3400 clean and hold on retest, it means Phase D of Accumulation started instead. Entry: Long on retest of 3400 as support SL: Below 3400 TP: Trail it... Stay reactive around 3,390–3,396 for short opportunity only if price shows signs of failure there. By the time it took me to post this idea the price has already move up 100 pips. Trade safely!!Well, not only I missed the long at 9:30 am while I was making this post but Israel also attacked Iran so here is our buying volume and "news" to invalidate the set up. I will most likely not waste my time with those post anymore lol.
Med_In_Trade

The chart is based on the 30-minute timeframe, so short-mid term. Market Bias: Bearish correction underway after an extended 5th wave up. The correction could unfold in an ABC pattern, with Fibonacci confluences lining up at 2870, 2847, and 2809. Once we clear PDL and close below it, we will have confirmation and a shift in market structure. From there, our potential targets for the corrective move are: Target 1: 2864 Target 2: 2854 Target 3: 2837 Target 4: 2829 Target 5 (1.618 Extension): 2809 Expect bearish continuation as long as price holds below 2914 area. Manage risk carefully, as corrective waves can be choppy. Trade safe!0.618 Fibo reached 1st target!!Key Levels to Watch: If price holds above C → Look for bullish confirmation. If price breaks below C → Expect further correction down. If price remains choppy → It’s likely ranging before a bigger move. Would you be looking for a bullish entry, or do you think we need more confirmation?
Med_In_Trade

This analysis breaks down the 4 possible scenarios for Gold (XAUUSD) based on the chart structure and liquidity levels. Chart Overview & Context Price is currently consolidating near $2,860 after a sharp move up and rejection from previous ATH. Plenty of liquidity below, where price may sweep before making new ATH or continuation down trend. Higher timeframe trend remains bullish, but short-term corrections are possible. Key Scenarios for Monday and the Week. Scenario 1 – Bearish Breakdown (Short-Term Move Down) Price rejects from $2,860 and breaks below the lower support $2,855 and retest the lower liquidity around $2,850. Target around $2,835 - $2,832 for a deeper liquidity grab. Confirmation: Break of structure (BoS) below $2,855 and failed bullish attempts. Invalidation: Strong bullish reaction at $2,855. Scenario 2 – Bullish Reclaim and Re-Accumulation. Price holds above $2,855 and starts forming higher lows. A breakout above the resistance of $2,872 - $2,875 will confirms a bullish push and continuation of the pump. Target: Reclaiming $2,884 ATH and possibly testing $2,890-2900 area. Confirmation: Break above $2,872 and retest of structure as support. Invalidation: Price loses $2,855 support and breaks lower. Scenario 3 and 4 will most likely develop later in the week... Trade safe and stay patient!Scenario 2 completed and scenario 4 developed into the break above ATH. Stay tune for next idea!!
Med_In_Trade

Date: February 6, 2025 Timeframe: M15 Instrument: Gold (XAU/USD) Market Overview : We might have found a short-term top at ATH and nearest resistance is $2,871. A Head & Shoulders pattern is starting to form. Elliott Wave (EW) suggests Wave 5 is complete, and a retracement has begun across multiple timeframes. BUT if momentum continues, $3,000 is still possible today. Key Levels to Watch : Resistance: $2,871 (nearest resistance) Support & Retracement Zones : $2,864 - $2,860 → First test zone $2,845 → Key retracement target $2,834 (1.618 Fib extension) → Deeper correction possible Scenario 1 : Retracement Confirmed If price fails to reclaim $2,871 and starts breaking below support. Target downside: $2,845 and possibly $2,834. Scenario 2 : Fake Retracement & Pump to $3K Trading Plan & Bias: Wait for confirmation at the Singapore session open. Short-term bias: Bearish only if price starts rejecting resistance & breaking structure. Invalidation : If $2,871 flips into support, the bullish trend resumes. Trade safe!!On its way to 2846 it seems, I am taking 100 pips profit here and will keep monitoring as I only scalp but the bigger move still in play so far. Be safe!!I was out at 100 pips but price just reached 200 pips. I would T/P if you haven't yet and see what NYSE will do. PS: vroom vroom beep beep lol
Med_In_Trade

Chart Overview & Context Structure: A strong rally followed by sideways movement, which can indicate either reaccumulating or distribution. Current Price: ~2815 Key Observations: Buying Climax (BC) & Automatic Reaction (AR): The price made a strong impulse move up and is now consolidating. We see multiple taps into resistance (purple zones), suggesting supply absorption. Break of Structure: A recent move down suggests weakening demand, supporting a potential distribution thesis. Key Levels & Liquidity Zones ATH Resistance at 2832-ish – Previous highs, which may act as a strong liquidity zone. Supply Zones 2822 area – Multiple rejections from these levels suggest sellers are active. Low 2808 – If broken, it could confirm a markdown phase. First Target is 2794 – A key level where liquidity likely sits. If price reaches here, a reaction is expected. PDL at 2772 – Stronger liquidity area, potential final target for a markdown. Short Setup (High Probability). Breaking 2808 would confirm markdown to 2794 then maybe 2772. We have good signs of distribution (failed breakouts, structure shifts etc...). Entry: After a lower high near 2815–2818, confirmation with bearish momentum. Target 1: 2794 Target 2: 2772 Invalidation: If price breaks above 2822 and further ATH Long Setup: I won't take any, my final Bias is bearish and of course I might be wrong... Trade safely!!Didn't happen...
Med_In_Trade

Market Overview: Gold (XAUUSD) recently had a strong bullish push but is now consolidating. The current price action suggests a possible liquidity grab before a move lower. Key Levels: Resistance / Supply Zone: 2817 - 2822 Support / Target Zone: 2794 - 2792 Previous Day Low (PDL): 2772 All-Time High Resistance: 2830 📉 Bearish Plan: 1️⃣ Price may push into 2817-2822 to grab liquidity. 2️⃣ Look for MSS/BOS + FVG Retest on M1-M5 for confirmation. 3️⃣ If confirmed, enter shorts targeting 2794-2792. 4️⃣ Final target could extend toward 2772 if momentum continues. Watch Out For: If price fails to reach 2817-2822, it might break lower directly. Avoid early shorts—wait for liquidity sweep + structure shift. Volume drop before reversal = extra confluence. Trade Safe! Let the setup come to you.Plan is being cancelled like your favourite Netflix show season 2 lol... Price arrived at POI too fast, too much buying momentum. No trade for me during Asia session...
Med_In_Trade

Price has been bullish throughout the day, reflecting strong momentum, driven by post-holiday liquidity and market participants returning. New York session opens in 1 hour, hopefully introducing volatility and liquidity for continuation or reversals, enough to catch a BIG move!! Scenario 1: Bullish Continuation from Current Levels Price holds above the yellow mid-level and breaks the recent high. Confirmation: A bullish MSS or CHoCH near the mid-level or current consolidation. Target: Higher liquidity zones beyond the current high. Scenario 2: Bearish Pullback to the Blue Support Zone Price rejects the yellow mid-level and breaks structure downward. Confirmation: A retest of an FVG/OB below the mid-level. Target: Blue support zone for potential reversal or continuation. Scenario 3: Bullish Reversal from the Blue Support Zone Price dips into the blue support zone, sweeps liquidity, and reverses bullish. Confirmation: A bullish CHoCH or MSS after the liquidity sweep. Target: Retest of the yellow mid-level and beyond. Scenario 4: Bearish Breakdown Price breaks below the blue support zone, invalidating bullish bias. Confirmation: A retest of the blue zone as resistance. Target: Lower liquidity zones below the chart. Happy New Year and Trade safe!!Bonus scenario as the market as infinite options. Considering it, it would align very well with NYSE behaviour, let's watch!! Scenario 5: tradingview.com/symbols/XAUUSD/minds/?mind=oEAiU1G5TH2IHT0fMVoVKg&exchange=OANDAScenario 1 it was!!
Med_In_Trade

Sorry guys, Singapore opening in 10 mins, not much time to elaborate but everything is on the chart. Trade safe!!Scenario target achieved with London open. Watching now to see if scenario 4 entry is activated or scenario continue the downtrend. NYSE will make the next move. Trade safe and Happy New Year!!NYSE filled scenario 4 and then extended scenario 2 which was a good 250 pips. I hope everyone was able to catch some pips out of those moves. See you Next year!!
Med_In_Trade

If you know me from mind you know my strategy and trading style doesn't really look at HTF but here it is, what could January hold for us on H4. The market is in a consolidation phase, with indecisive candles and no clear directional bias. Price appears to be trading within a defined range, with resistance near 2640 and support near 2600 A large imbalance remains below the current price all the way to 2580, which may act as a magnet for liquidity. Daily Key Levels: Upside: 2640: Immediate resistance and previous high. 2680: Key resistance level near the December high. 2740-2760: Unfilled gap above; potential liquidity target. Downside: 2600: Key support zone (gap fill and liquidity level). 2580: Secondary support below the gap. 2540: Weekly low and structural support. Market is still neutral but slightly turning bearish: The inability to break decisively above 2640 suggests a lack of bullish momentum. The imbalance below at 2600 remains untested, increasing the likelihood of a retracement to fill it. However, the higher timeframe structure (D1) still leans bullish, so any downside move might be corrective before resuming the uptrend. Scenarios to look for: 1.Bullish Scenario: If price reclaims 2640 with strong momentum, it could target the December high at 2680 or the unfilled gap above 2740-2760. Look for a break-and-retest structure above 2640 to confirm bullish continuation. 2.Bearish Scenario: A break below 2620 could lead to a move towards the 2600 gap fill. If 2600 fails to hold, expect further downside to 2580 or even 2540 (weekly low). The current consolidation reflects indecision in the market. Be cautious and wait for clear confirmations before taking a position. The gap below 2600 and resistance at 2640 are critical zones to watch. Trade safe!!
Disclaimer
Any content and materials included in Sahmeto's website and official communication channels are a compilation of personal opinions and analyses and are not binding. They do not constitute any recommendation for buying, selling, entering or exiting the stock market and cryptocurrency market. Also, all news and analyses included in the website and channels are merely republished information from official and unofficial domestic and foreign sources, and it is obvious that users of the said content are responsible for following up and ensuring the authenticity and accuracy of the materials. Therefore, while disclaiming responsibility, it is declared that the responsibility for any decision-making, action, and potential profit and loss in the capital market and cryptocurrency market lies with the trader.