
MarthaStokesCMT-TechniTrader
@t_MarthaStokesCMT-TechniTrader

What symbols does the trader recommend buying?
Purchase History
پیام های تریدر
Filter
MarthaStokesCMT-TechniTrader
شرایط بازار، استراتژیهای معاملاتی: نقشه راه موفقیت تریدرها
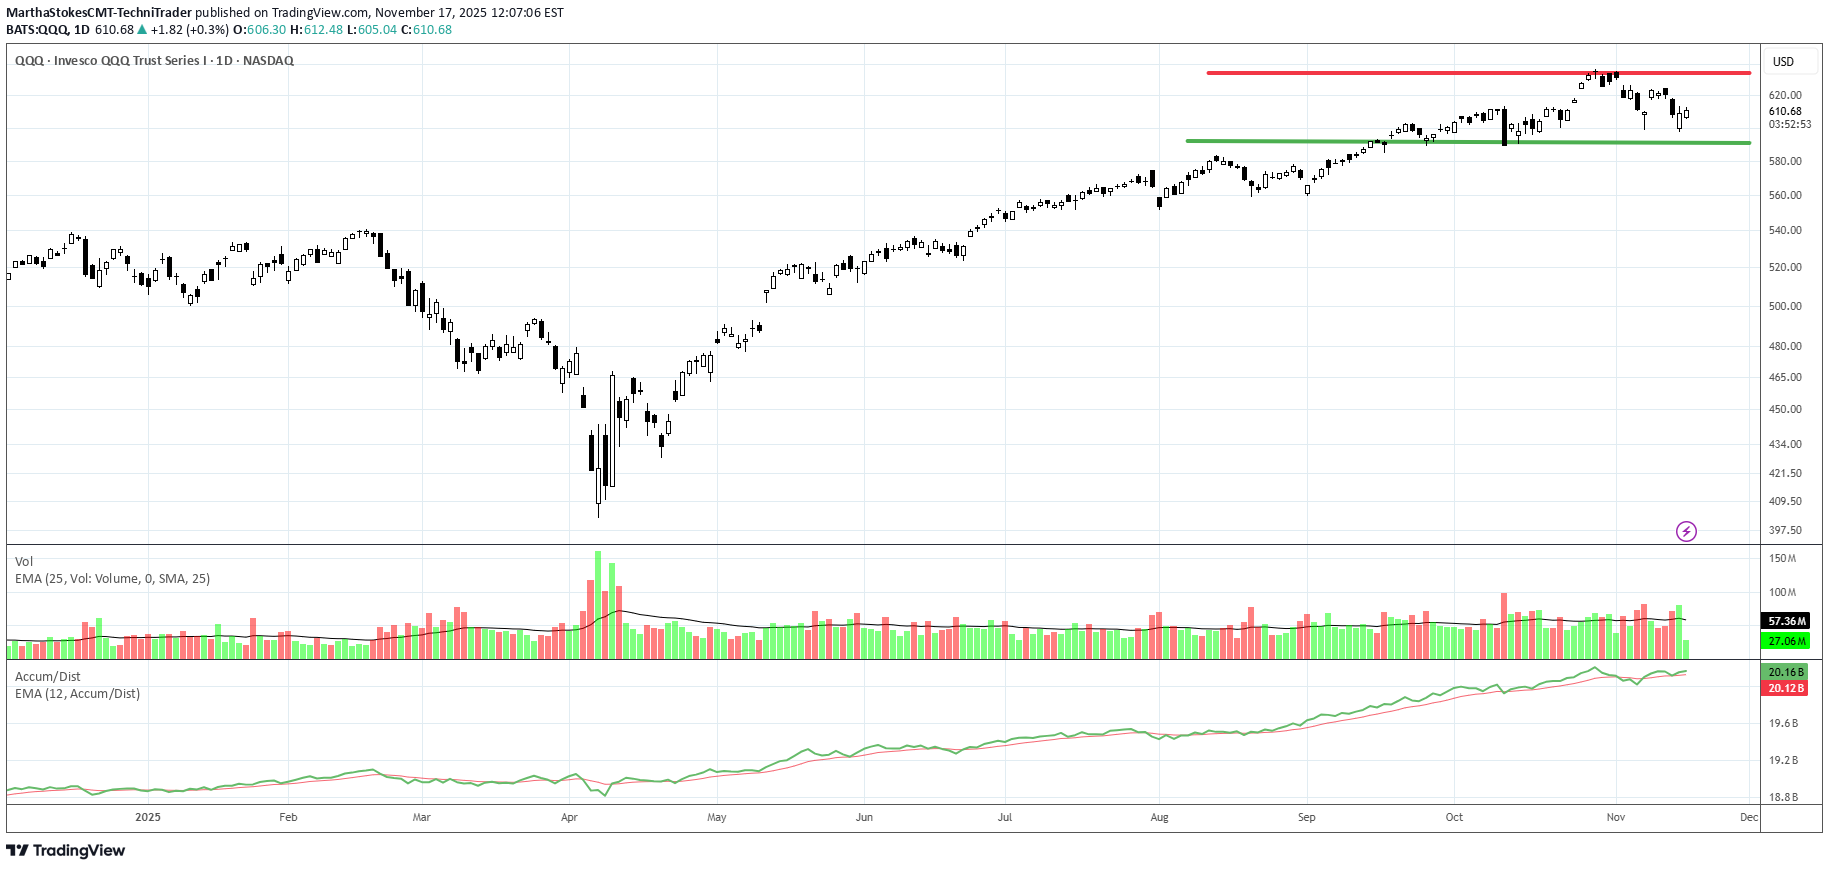
Here are some important terms for traders to understand. Market Condition refers to the overall long-term trend, where we are in the CYCLE of the Stock Market. Trading Conditions are identified and traded by using the day over day and week over week trends and trendline patterns within that Cycle. Strategies relate to a specific trading style based on the current Market Condition and the Trading Condition(s) within that particular Market Condition. The Market is in a Moderately Uptrending Market Condition at this time. Trading conditions vary from sideways trends to Velocity runs, to minor corrections. The market is choppy and sideways. Volatile markets have huge white and black candles that change abruptly from one day to the next based upon WHO IS CONTROLLING price. In the sideways trend we’re experiencing now, different market participants are taking different actions: Professional Traders are mostly trading to the upside. There are also smaller funds managers with less than $3 billion in assets under management, aka Retail Side Asset Managers. There are fewer retail investors and retail traders are mostly sidelined right now since they are worried. There is some minor Dark Pool rotation to lower inventories of specific stocks in the NASDAQ 100 index, which impacts the QQQ ETF. Understanding the dynamics of the Stock Market helps you trade with confidence, making decisions based on real market conditions instead of retail news—which is always late and often drives manipulative activity.
MarthaStokesCMT-TechniTrader
کالبدشکافی شکاف گسستگی (Breakaway Gap): رازهای حرکت بعدی سهام AMZN
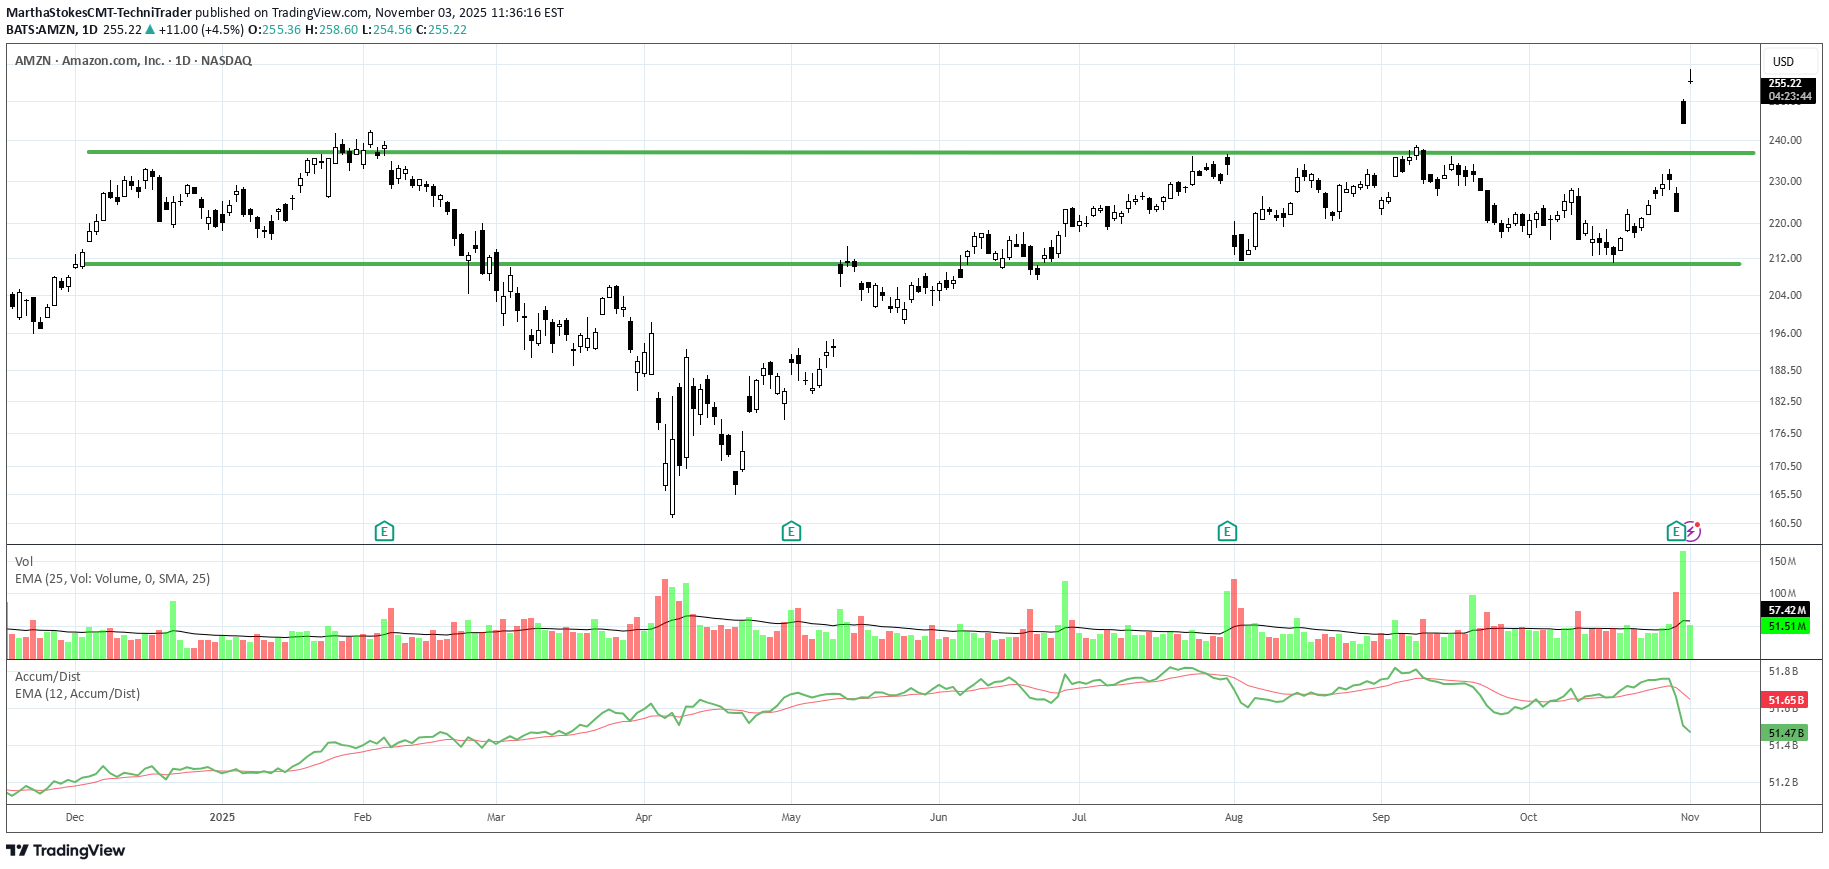
AMZN is an excellent example of a Breakaway gap due to improvement of the company's fundamentals. The prior fundamental level is clearly defined on the chart and easy to see. The new fundamental level has not yet been fully established and will begin to form over the next few weeks. Even if there is a Flash Crash, the fundamental lows of the previous level are very strong support. What to watch for in the stock price action over the next few weeks: 1. Dark Pool accumulation in the Buy Zone. 2. Pro Trader nudges. 3. Speculative trading by Smaller funds managers.
MarthaStokesCMT-TechniTrader
Learn What a VOID is and how it Impacts Your Trading
A void is a trading condition that occurs when small lot buyers and Odd Lot investors run out of capital to invest. These two retail groups tend to have very little savings to invest so they buy Odd Lots (under 100 shares for one transaction) or Fractional Shares, which is a fraction of ONE single share of stock of a company. These groups are the LAST buyers in during a Velocity or Speculative Trading Condition which happens often during highly emotional trading activity in a Moderately Up Trending Market Condition. When the Odd lot and low capital base NEW retail day traders run out of money they stop buying and a VOID of BUYERS occurs. The Sell Side Institutions, Giant Hedge Funds, Professional Independent Traders all recognize the volume and price patterns that form due to a VOID of BUYERS on the retail side. Volume bars are the number of ORDERS that are rapidly moving through the huge and very complex stock market systems. Volume, therefore is a primary indicator that warns of an impending VOID of BUYERS. When that occurs, the professionals mentioned above start to prepare to sell short and determined how low they can place a buy-to-cover order to maximize their profits when selling short. Thus, with a surge of HFT sell short orders, the market would gap down at open. HFTS use very small lot orders to fill the queues ahead of the market open and thus force the computers that run the market to lower the price of the stock to where the buy to covers are waiting. So that is WHY there is a sudden collapse of price after a speculative run up as we have had recently and will have again.
MarthaStokesCMT-TechniTrader
How to recognize the Fundamentals Support in a stock chart.
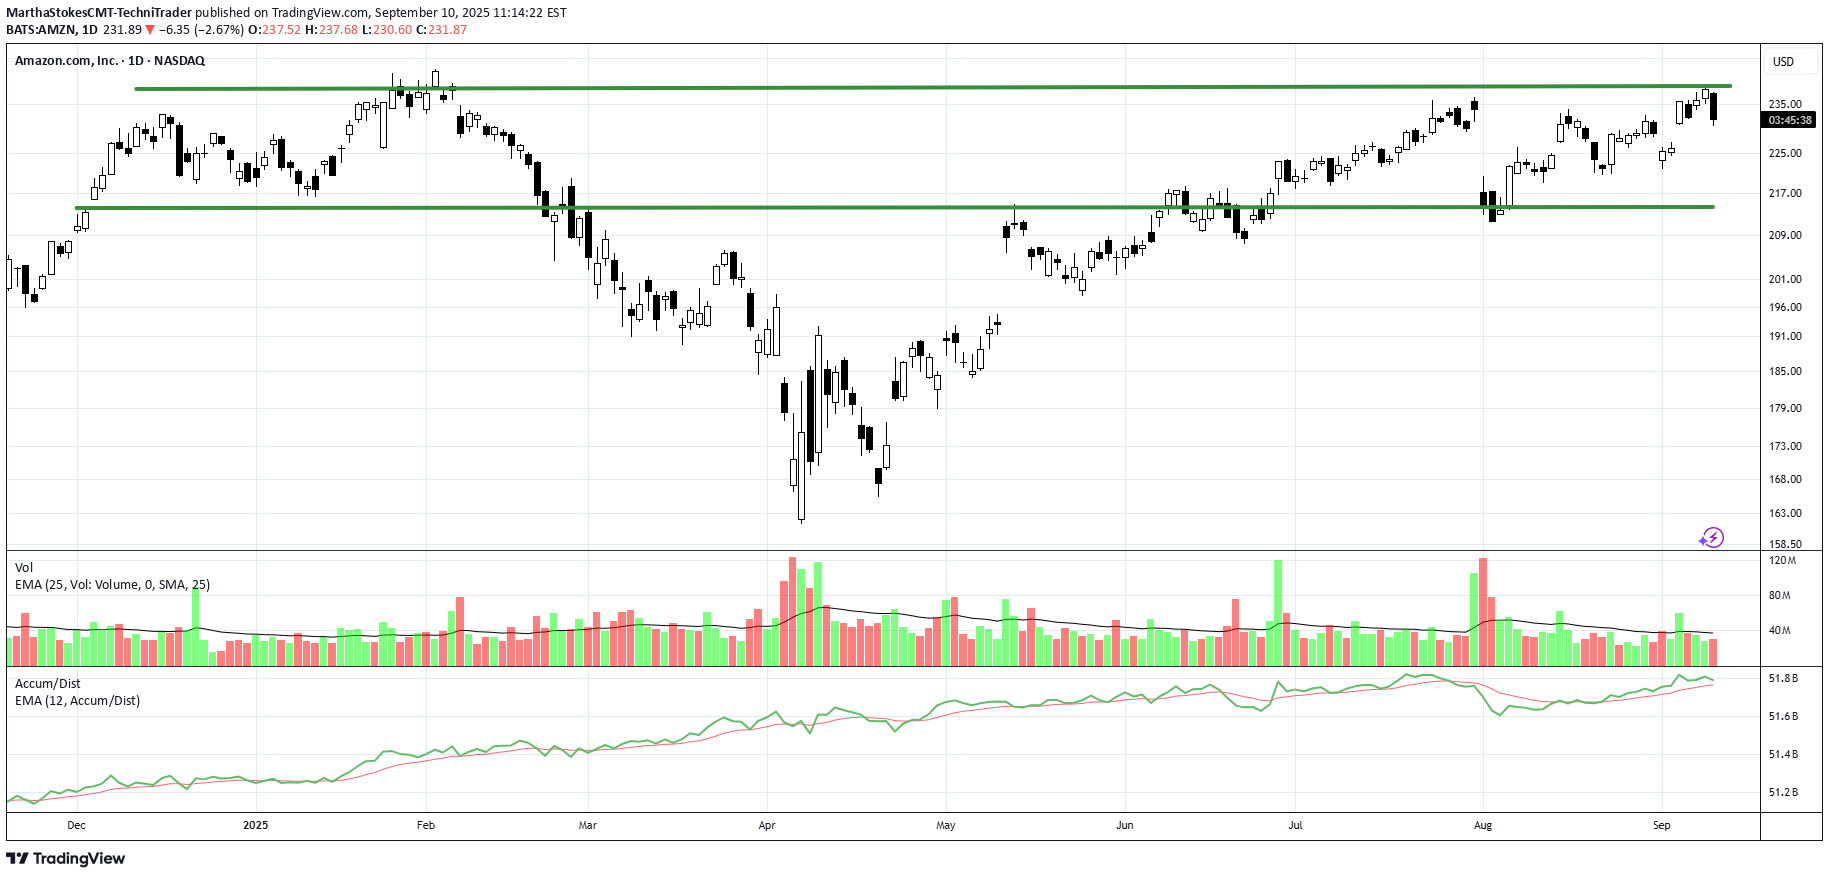
Candlesticks are more than just a buy entry signal or a sell short entry signal. Candlesticks offer far more information such as where are the fundamentals of a company in relation to its stock price? The chart of AMZN shows the current level of fundamentals at this time which is within the outlined price level. AMZN is an excellent example of a company that is prospering during a time of rising tariffs and trade wars. AMZN chart also show Buy Side "Support the Market" activity and quiet accumulation for much of this year. The steady rise of Accum/Dist is a pattern in the indicator that represents quiet accumulation over time. Reminder: When Dark Pools are in accumulation mode they do not move price in huge price action. The candles will be small, uniform, and periodic. TWAP orders, Time Weighted at Average Price are used to set an automatic ping to buy when a stock falls below the fundamental level of a sideways trend. Fundamentals are always sideways trends. If the stock moves beyond the high price set for the TWAP order, then the accumulation buying ping halts and waits. Therefore, you can see the area where the majority of Dark Pool TWAP orders are buying and when the orders pause. This is very useful information as Professional Independent Traders are monitoring the Dark Pool Buy Zone and will buy with the Dark Pools in anticipation that the liquidity draw is going to drive price upward suddenly as HFTs AI suddenly find the liquidity draw which occurs slowly over time, often several months.
MarthaStokesCMT-TechniTrader
learn how to read and use Angle of Descent

Angle of Descent is the inverse of Angle of Ascent. However, the downtrend runs faster and steeper than the uptrend. WHY? Because the uptrend builds on uncertainty and doubt from retail groups, while Dark Pools and professional traders buy quietly with the that the stock is at bargain prices and will resume and uptrend. Their buying creates the bottoms and nudges price to the upside. Their activity provides near term price direction for YOU to trade shortly after the Dark Pools have accumulated and when pro traders nudge price upward anticipating and setting up for HFT gap ups and smaller funds VWAPS chasing the HFT gaps. Angle of Descent will always be faster, steeper and end abruptly as prices for shares fall well below the fundamental levels. Studying the indicators that professionals use that indicate extreme selling helps you avoid getting into a sell short that whipsaws causing huge losses. When the Dark Pools start to trigger and buy, they are often buying stocks that retail day traders are trying to sell short. Retail traders often lack an understanding of who controls price. When a stock falls sufficiently below its fundamental values, Dark Pools will start buying in a slow steady TWAP Time Weighted at Average Price, creating a Buy Zone that can be seen on the stock chart if you know what to look for. That is your warning signal not to try and sell short.
MarthaStokesCMT-TechniTrader
How Sell Side Institutions Move Price: Buybacks

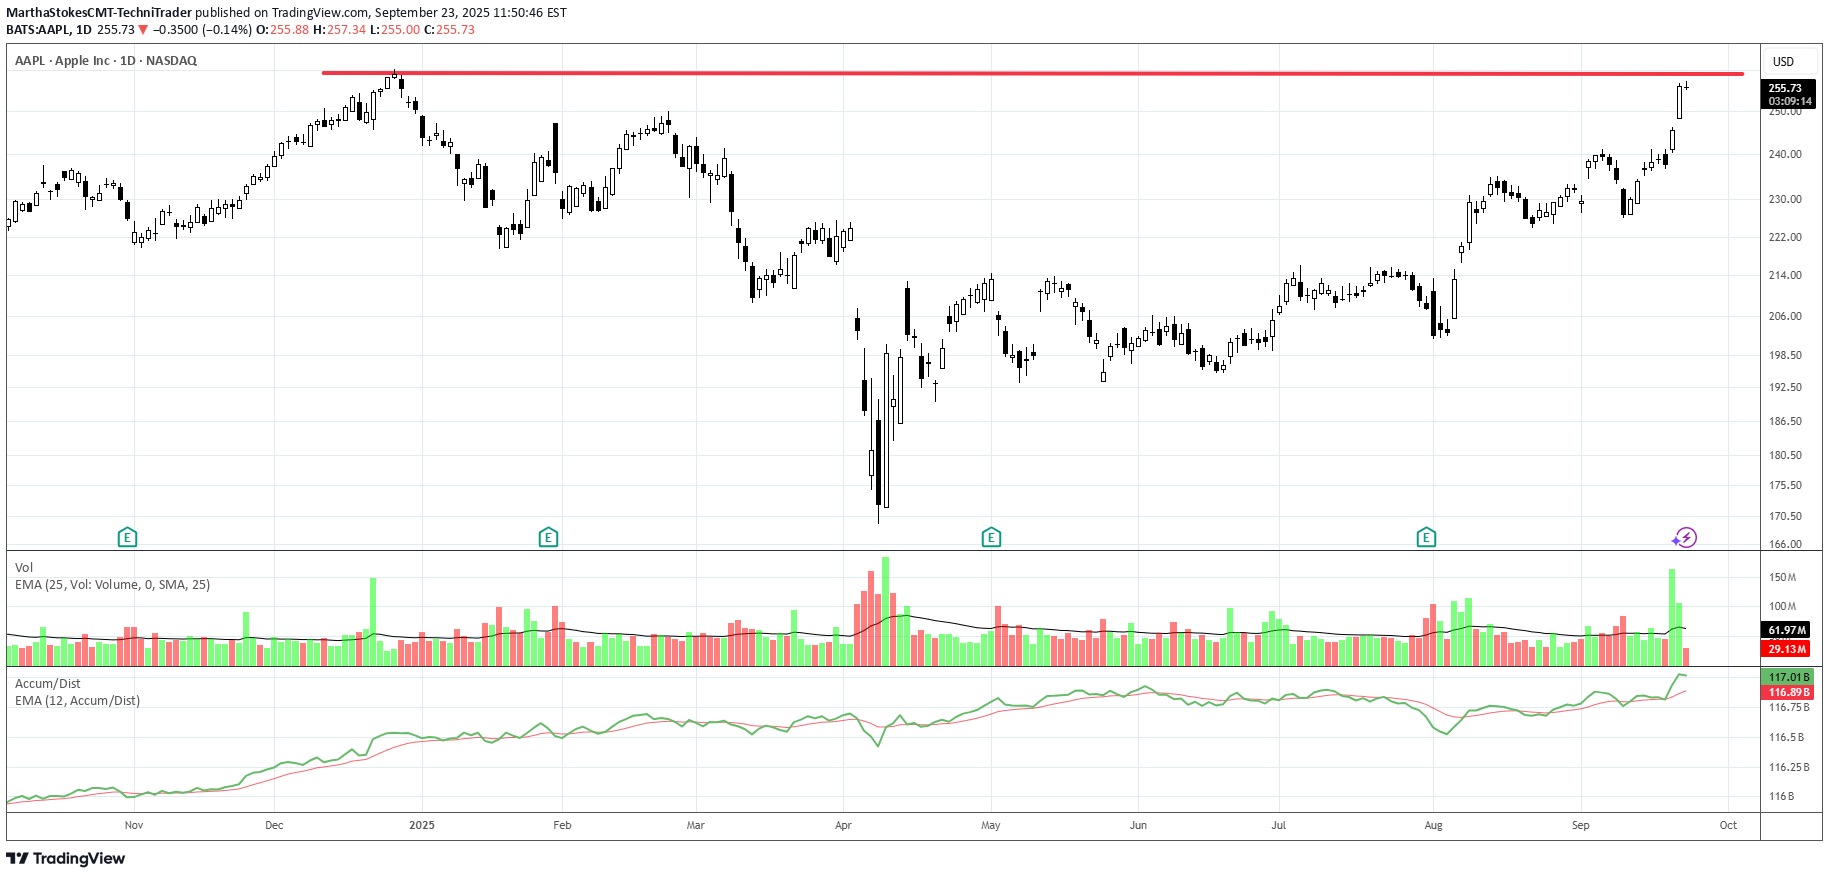
There are Buy Side Institutions, aka Dark Pools, and there are Sell Side Institutions, the Money Center Banks and Giant Financial Services companies. These two groups dominate the market activity and move price in entirely different ways and for entirely different reasons. Sell Side Institutions are short-term TRADERS. They are not allowed, nor do they wish, to hold stocks for the long term. The Sell Side trades stocks and has the most experienced, most talented, and most sophisticated floor traders in the world. Buy Side Dark Pools have floor traders as well but they are strictly long-term investment companies managing the 401ks, pension funds, ETF long-term investments on behalf of the Middle Class of America and, in some instances, other nations. Sell Side Institutions may buy a stock and hold for a few weeks or months but strictly for the short-term profits. The Sell Side are also the Banks of Record who do the BUYBACKS on behalf of the Corporation which has made the decision by the Corporation's Board of Directors to do a buyback program, which tend to last many months or longer. Corporations do not have stock traders on staff. So the Bank of Record does the actual buying of the shares of stock. The reasons for doing a Buyback: To lower the outstanding shares which can create some momentum runs during high buying demand from retail groups and other investors. Buybacks are intended to move price UPWARD in runs. The price range is established by the corporation. The runs are created by the Bank of Record. Buybacks also increase dividend yields for long term investors, including pension fund investors. AAPL has a mega buyback that was approved in May but has just started now. Buybacks can be a great strategy for trading stocks this year as many corporations will be doing buybacks due to the reduction of their taxes and more benefits to corporations. Now is the time to start watching for buyback runs.
MarthaStokesCMT-TechniTrader
Learn how to trade EOD / FOD Professional Strategy

EOD /FOD is an acronym for End of Day buy or sell short entry that holds overnight and the First of Day sell the ETF or stock at Market Open. This is a strategy for experienced to Elite aka Semi-Professional Traders. Beginners need to hone skills and practice in a simulator. Professional Traders use this strategy all the time. They rarely intraday trade aka "day trading" unless they are Sell Side Institution floor traders who do intraday trading all daylong. EOD /FOD is a very simple, easy to learn strategy for when Buy Side Giant Dark Pools have accumulated OR have Supported the Market and the Dark Pools foot print of a rectangle that is narrow with consistent highs and lows. TWAP Dark Pool orders trigger at a low price or lower and usually move price minimally. When in Support the Market mode. The run up is a long white candle. TWAPs are automated Time Weighted At Average Price. These orders ping at a specific time and buy in accumulation mode. If the stock price suddenly moves up beyond the high range of the TWAP, then the orders pause or halt. Then pro traders do nudges and runs are instigated by either Gap Ups by HFTs, OR smaller funds VWAP ORDERS, or MEME's or other large groups of retail traders all trading and entering orders in sync or as close to sync as possible to create a flood of small lots that do move price upward OR downward rapidly. Using the EOD /FOD requires understanding of how the Dark Pools, Pro Traders and other groups react to price and what, where and when orders are automated. When ever you see a platform trend pattern such as we have on the QQQ yesterday at close and early this morning, then the entry would have been in the last 5 minutes of yesterday's market.
MarthaStokesCMT-TechniTrader
Using Advanced Hybrid Leading Indicators for Swing Trading

The professional side of the stock market has undergone massive infrastructural changes in the past 5 years. These changes are unknown to most retail traders and that can pose major problems for you success and profitability no matter what trading style you use. A trading style is a type of trading that has specific parameters to which strategies can be applied based on the current market condition. Currently, we have a Bottoming Market Condition that is poised to shift to a Moderately UpTrending Market condition. The 3 sets of data used in stock indicators are Price Time and Quantity. Most retail traders use outdated price and time indicators from the 80's and 90's. Unfortunately these indicators no longer work in the modern, millisecond transaction market which is dominated by Dark Pools and professional traders. Hybrid Leading indicators use all 3 data sets in a complex mathematical formula that provides a leading indicator for you to use. The Chaikin Oscillator is an excellent Hybrid Leading Indicator that has a CENTER LINE oscillation which provides more information about price direction, change of direction, duration of the run up or down and leads price. An indicator that LEADS price means that it signals a day or a minute ahead of the change of direction of price on the candlestick charts. This is invaluable to swing and day traders who need to be able to quickly sell or buy-to-cover to net the highest profits from each trade while reducing risk factors of whipsaw action especially intraday. Intraday traders must use indicators that signal ahead of the price direction change. Unfortunately, most traders are using outdated price and time cross overs which ALWAYS lag as the price must move down or up before the crossover can form on the indicator chart. To improve your profitability start using center line indicators that have all 3 data sets within the mathematical formula.
MarthaStokesCMT-TechniTrader
How to Trade with Professional Traders

The most important professional side group you need to learn to trad with are the professional traders. Many work for the Sell Side Institutions on huge trading floors or from their home office. Some work for the Buy Side Institutions and trade for the Giant Pension funds companies, Mutual funds companies and Derivatives Developer companies. There are also Independent Professional Traders which is a growing number of floor traders who now trade in the home office for themselves. One thing about pro traders you need to remember is they are highly competitive and do not share anything. They are loners and prefer a quiet place where they can trade uninterrupted. They do not have chat groups. They do not have guru groups. They are reclusive and you will never see them giving a retail news interview. Their trading is to track the Dark Pool hidden quiet accumulation or quiet rotation to sell short. They do not move price in big runs up or down. Instead the use very controlled, bracketed orders that keep a tight penny to few penny spread as their entry price. The do not use VWAP. Instead, they use TWAP Time Weighted at Average Price which sets up an order on the millisecond time frame to ping automatically at a specific price range that is very tight. Learning to read stock charts so that you can see the pro trader setups which start often 3-5 days ahead of the actual momentum run that follows their pro trader nudges candle patterns. These candle entry signals are not in the older Candlestick books. Nudges as an entry signal started a few years ago and now is the standard for most pro traders. When you can read a stock chart, and in particular candlesticks, then you will be able to pick out the professionals easily. Volume is often below its average as professionals are not making the momentum, they are using their strategies for swing trading to entice smaller funds, or HFTs or retail traders to move price for them. Thus they have an easy free ride of price movement. Instead of waiting for a big gap learn how to enter early. Learn how to be patient and wait and then learn how to exit when the pros are selling into the buying spree of smaller funds and retail groups.
MarthaStokesCMT-TechniTrader
TWAP and Chaikin's Osc vs VWAP Orders and VWAP Indicator
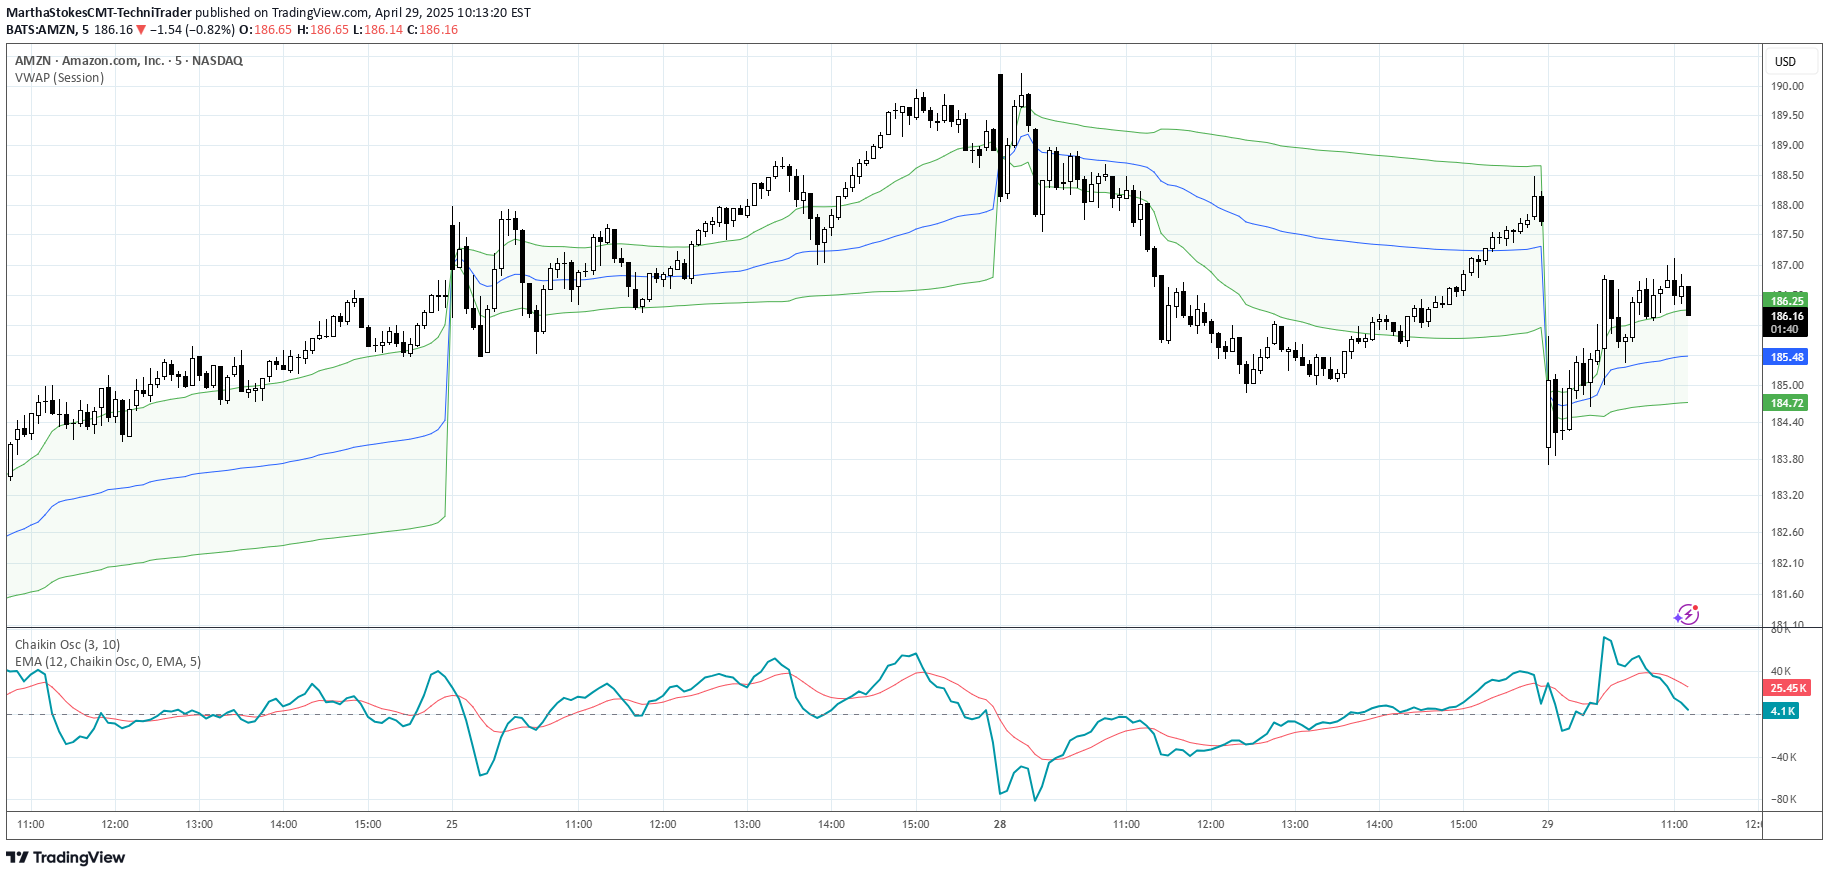
There are two primary Order Types that the Professional Side of the market use. 1. Time Weighted at Average Price, aka TWAP , is used extensively by the Dark Pool Buy Side, Derivative Developers, and Sell Side Banks of record for Buybacks for corporations. The TWAP can be set at a penny to few pennies spread and pings and transacts on a specific TIME to PRICE. It can be set to time intervals shorter or longer. This is why the stock market is called "fully automated". TWAP is used most of the time. It is rare for the Giant Institutions to use VWAP orders due to the May 2010 FLASH CRASH when a fundamental trader of e-minis accidentally hit the VWAP order type rather than the TWAP order type which caused a massive collapse of all stocks as VWAPs accelerate selling as volume increases. 2. Volume Weighted at Price or VWAP is ALSO an ORDER TYPE. It is primarily used by Small Funds Managers and Small Asset Managers who are independents trading their customers' investment money actively, often intraday. Volume Weighted at price ORDER TYPES are also automated and ping to trigger the order to transact as volume increases. This is an easy, simple way for a busy small fund manager to cope with the complexity of buying and selling stocks with 10,000 share lots to 100,000 share lots. These are the NEW "whales" of the market. Professional Traders Swing trade 1 million to 5 million or higher share-lot sizes. The size of the orders of the professional trader has increased significantly in the past decade. All of you need to be aware of the market participants on the professional side as they control 80% of the 1 trillion dollars that exchange hands daily on the US Markets. Using Chaikin's Oscillator is ideal for tracking the Dark Pool Buy Side who create the bottoms. This excellent indicator analyzes all 3 data sets: price, volume and time. Thus, it can signal early that the Dark Pools have slowly started to accumulate over time and the runs down will turn into a bottom and then pro traders will nudge price to inspire VWAP orders from the Smaller funds managers. The VWAP INDICATOR is excellent for tracking the smaller funds managers' trading activity and it ALSO has price, volume, and time in the formula. So this is great for those of you who need an indicator for following smaller funds activity as these smaller funds VWAP orders trigger more and more volume and then runs that can move up or down for several days. TradingView has an awesome group of indicators to use. You should customize your indicators to which market participant groups you wish to track so that you can be ready and in a position before the big runs up or down. Trade Wisely, Martha Stokes CMT
Disclaimer
Any content and materials included in Sahmeto's website and official communication channels are a compilation of personal opinions and analyses and are not binding. They do not constitute any recommendation for buying, selling, entering or exiting the stock market and cryptocurrency market. Also, all news and analyses included in the website and channels are merely republished information from official and unofficial domestic and foreign sources, and it is obvious that users of the said content are responsible for following up and ensuring the authenticity and accuracy of the materials. Therefore, while disclaiming responsibility, it is declared that the responsibility for any decision-making, action, and potential profit and loss in the capital market and cryptocurrency market lies with the trader.