
MaBaCapital2
@t_MaBaCapital2

What symbols does the trader recommend buying?
Purchase History
پیام های تریدر
Filter
MaBaCapital2
سقوط ناگهانی سهام متا: دلیل واقعی و فرصت خرید پنهان!
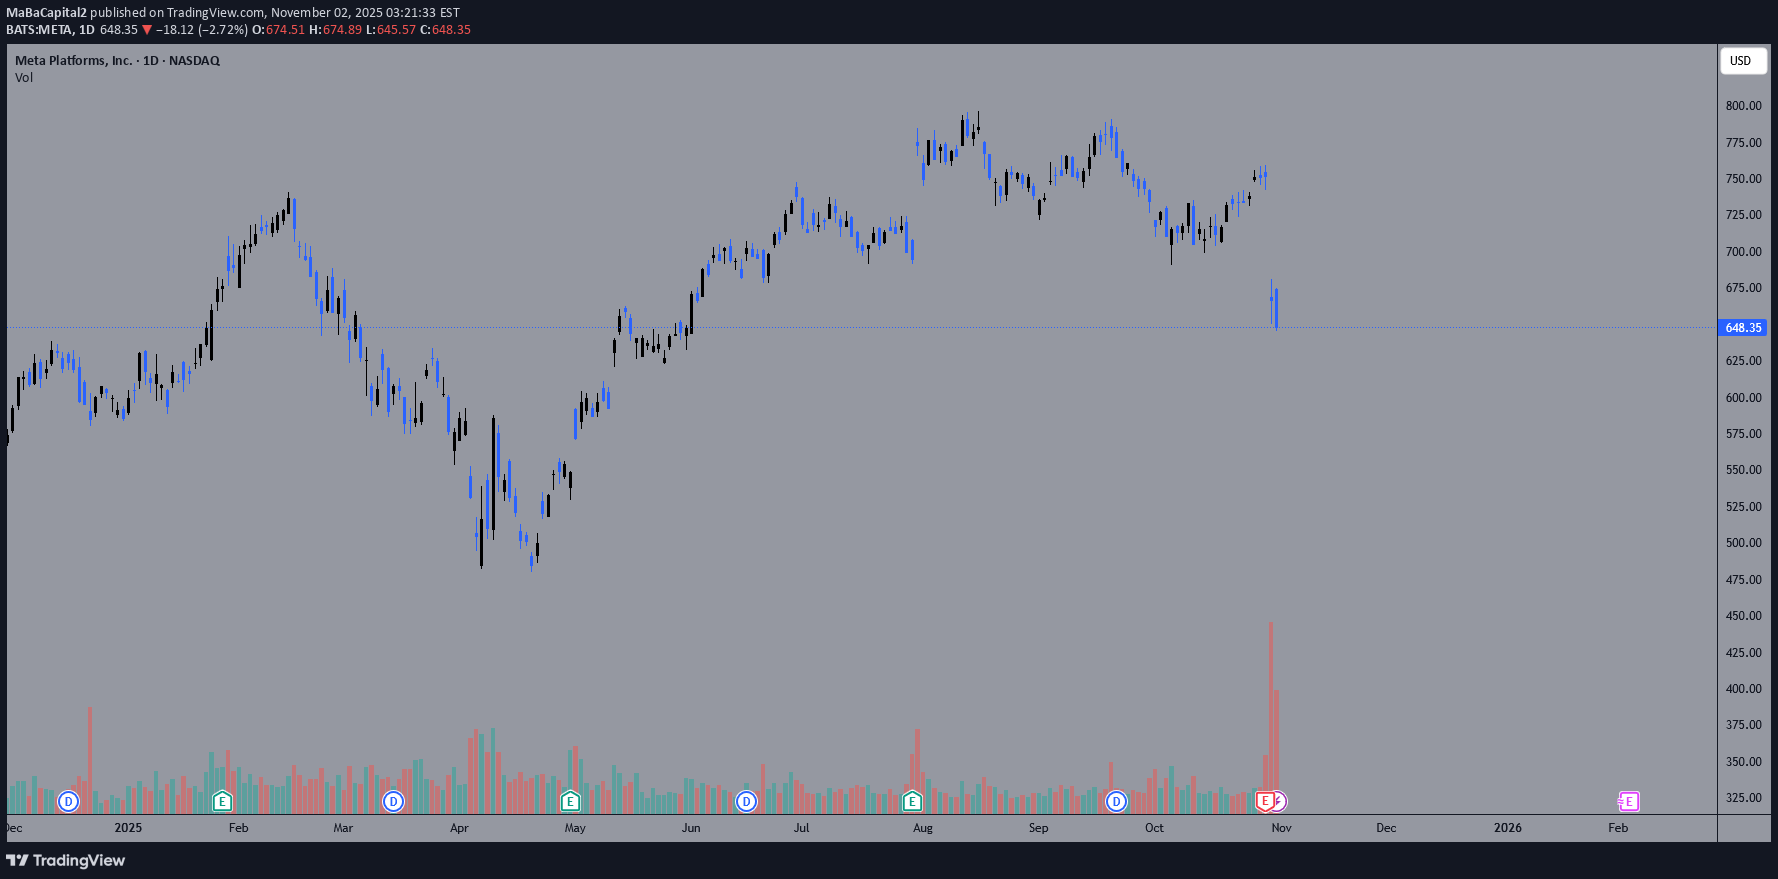
So what happend to META last week: I see a lot of you wondering what happend to the stock and what caused the drop. The answer is simple. The EPS was not so good. We can see on the chart that the EPS is only 1.05 and that they expected 6.723 . That is a chance of -84.38%. So for that big of a chance this is a small drop. The Reason: So the reason that this happend is because they need to pay some extra in taxes. The tax that they need to pay is around 15,9 billion dollar. This is because Trump has passed some tax laws that state that big companies need to pay taxes on profits that they have made outside of the US. This is only a one time tax that they need to pay and the reason that they are doing this is because they want to avoid companies to do tax evation and book more profits outside of the US. What we also do need to know is that made up profits outside of the US are being re-evaluated and that they need to pay tax on a portion of that profit because the see a portion of it as domestic assets. What we need to keep in mind: What we need to keep in mind here is that the EPS only dropped because of this tax and that there are people saying that the EPS without this tax would have been around 7.25 . So a good boost from what the analysist are expecting of META. So you could see this as a big discount you get on the stock price.
MaBaCapital2
XAU/USD trade idea

We are back!!! So when we look at the chart we can see that the price is reversing off a zone that was support in the past already. We already have some candles that closed above that zone so for that reason it is also looking good. I would either wait and see if we can drop a little and get a good price to buy of I would just risk it and go in now. The fundamentals also look good for #Gold to go up so this could be a very good and profitable trade.
MaBaCapital2
Short idea for XAU/USD (GOLD)

Okay so we can see on the chart that the price is moving into a zone that we got some resistance in the past at. What I want to do now here is see if we could get a chance to go short here if we do get a hit at that level. Entry: (Around) 2471.854 SL: 2488.787 TP1: 2444.464 TP2: 2397.153 TP3: 2362.293 Once we get a hit of the TP1 we will be moving our SL to entry and let the trade run. I will be looking to close it all at around the percentage. So each TP will be around 33% of the trade closed.
MaBaCapital2
BTC/USD trade

So when we look at the chart we can see that the price is moving in a zone that was a support zone in the past. We can also see that we got a first reversal in that zone. What this could mean is that this support zone from the past will be acting as a resitance zone now. We do need to keep in mind that just only 1 reversal is not enough to make it a real zone chance so we need to keep looking here to see if we can get more reversals here. For now it does look good and I will be keeping an eye out here to see if there is a chance that we could go long here. Maybe at the low side of the zone. We could also go in and maybe look at a trade to do for a daytrade. We could do this if we see it trading in the zone. Then we can just zone trade it with a SL just above/below the zone. We do also need to keep in mind that we are looking at crypto here so we can see some big volume moves happening that can just take us out. For now I will be doing nothing and just see. If I daytade this I will keep you updated. Feel free to tell me what you think of this and if you have any questions feel free to PM me.
MaBaCapital2
ETH/USD trade maybe?

So as we can see on the chart we see that the price is closing in on a possible rising wedge. What we need to look for now is what the price is going to do here. We need to see how the volume will be over the next few days to see what the move here is going to be. You do need to be carefull here and see that you don't get tricked. This is still crypto that we are trading so we could see a nice break of the wedge to than see it really shoot up. So if you take this I would be carefull. At this point and moment in time I don't really see any goods things to go and day trade this so if I would go in it would be with a smaller trade over a longer timeframe. Let me know what you think of this and if you have any questions feel free to send me A pm.
MaBaCapital2
XAU/USD trade idea

So when we have a look at the chart we can see that the price is moving into some sort of support that we hade in the past. We can also see that the price has already broken that leven in the past so we need to be aggressive here with the risk management and keep an eye out for what the price is going to do. I would be going into this trade with 0.5% risk because we need to be aggressive. Entry: 2312.668 TP: 2343.354 SL: 2303.996 R/R: 3.54Keeping a close eye here to see what the price does. Maybe close early and re-enter with a different stop loss level. Keep you posted!Looking for a new one
MaBaCapital2
Barrick gold investment maybe?

Technical analysis: So when we have a look at the chart we can see that the price has reached some sort of resistance and we see that it bounced back yesterday to the top side. This could be a good indicator that the price has done dropping en is going to go up from this point. Fundamental analysis Okay so when we have a look at the basic and most important fundamental numbers of the company we do can see that the number have been good overall for the last earnings reports. Numbers: Net income YoY = 165.17% Turnover YoY = 10.27% Watered WPA = 164.29% There are some more numbers that are looking good but that is something you need to look at for yourself.
MaBaCapital2
XAU/USD trade idea

When we look at the chart we can see that the price is moving to some sort of resistance that we had in the past. What I wanne do now is trade off this and see if we could maybe get some profit. Sell Limit: 2042.818 SL: 2048.797 TP: 2027.849What we could also do now because it is moving good, is taking a second TP and just close 50% at our TP on the chart and then let the other 50% run with you SL at you entry level.
MaBaCapital2
ETH/USD possible trading idea

Okay so when we have a look at the chart we can see that the price is not moving much these days. What we can see now is that the price has not gone below a small time frame support now and that we also have a possible ascending wedge happening. I think that this could be a valid ascending wedge because we got at least 3 times that the wedge was touched and did not got crossed. What I am now waiting for is for the price to go back to that wedge and see what it will do then.I think that the price will go above the wedge and then do a retest of that wedge before we get the real big and good pump to the top. I think that this could take a while before we got this and that the big profits could even take longer because we have all of the trading in crypto that is going a little slower then we are used to. So for now it is waiting and just keep an eye out the price to get to the wedge and then wait for the retest before we can enter the trade. If you have any questions, feel free to send me a PM.If you like the idea don't forget to leave a like and feel free to comment your idea for this pair.
MaBaCapital2
ETH/USD trade update

Okay so when we now look at the chart we can see that the price did reverse and went back up and did clean break through the small resistance that we can see on the chart.The next zone that I will be looking at is the zone of interest that is drawn up on the chart in orange and that is close to the price now. We could see a small reversal here but I think that the price should be able to break this zone and go up even more. If you have any questions feel free to send me a message.If you like the idea do not forget to give it a like and feel free so share your idea on this in the comments. Everything you see on my profile is just for educational purposes only.
Disclaimer
Any content and materials included in Sahmeto's website and official communication channels are a compilation of personal opinions and analyses and are not binding. They do not constitute any recommendation for buying, selling, entering or exiting the stock market and cryptocurrency market. Also, all news and analyses included in the website and channels are merely republished information from official and unofficial domestic and foreign sources, and it is obvious that users of the said content are responsible for following up and ensuring the authenticity and accuracy of the materials. Therefore, while disclaiming responsibility, it is declared that the responsibility for any decision-making, action, and potential profit and loss in the capital market and cryptocurrency market lies with the trader.