MMFlowTrading
@t_MMFlowTrading
What symbols does the trader recommend buying?
Purchase History
پیام های تریدر
Filter
MMFlowTrading
XAU/USD: ارتداد داخل القناة، الأولوية للشراء!
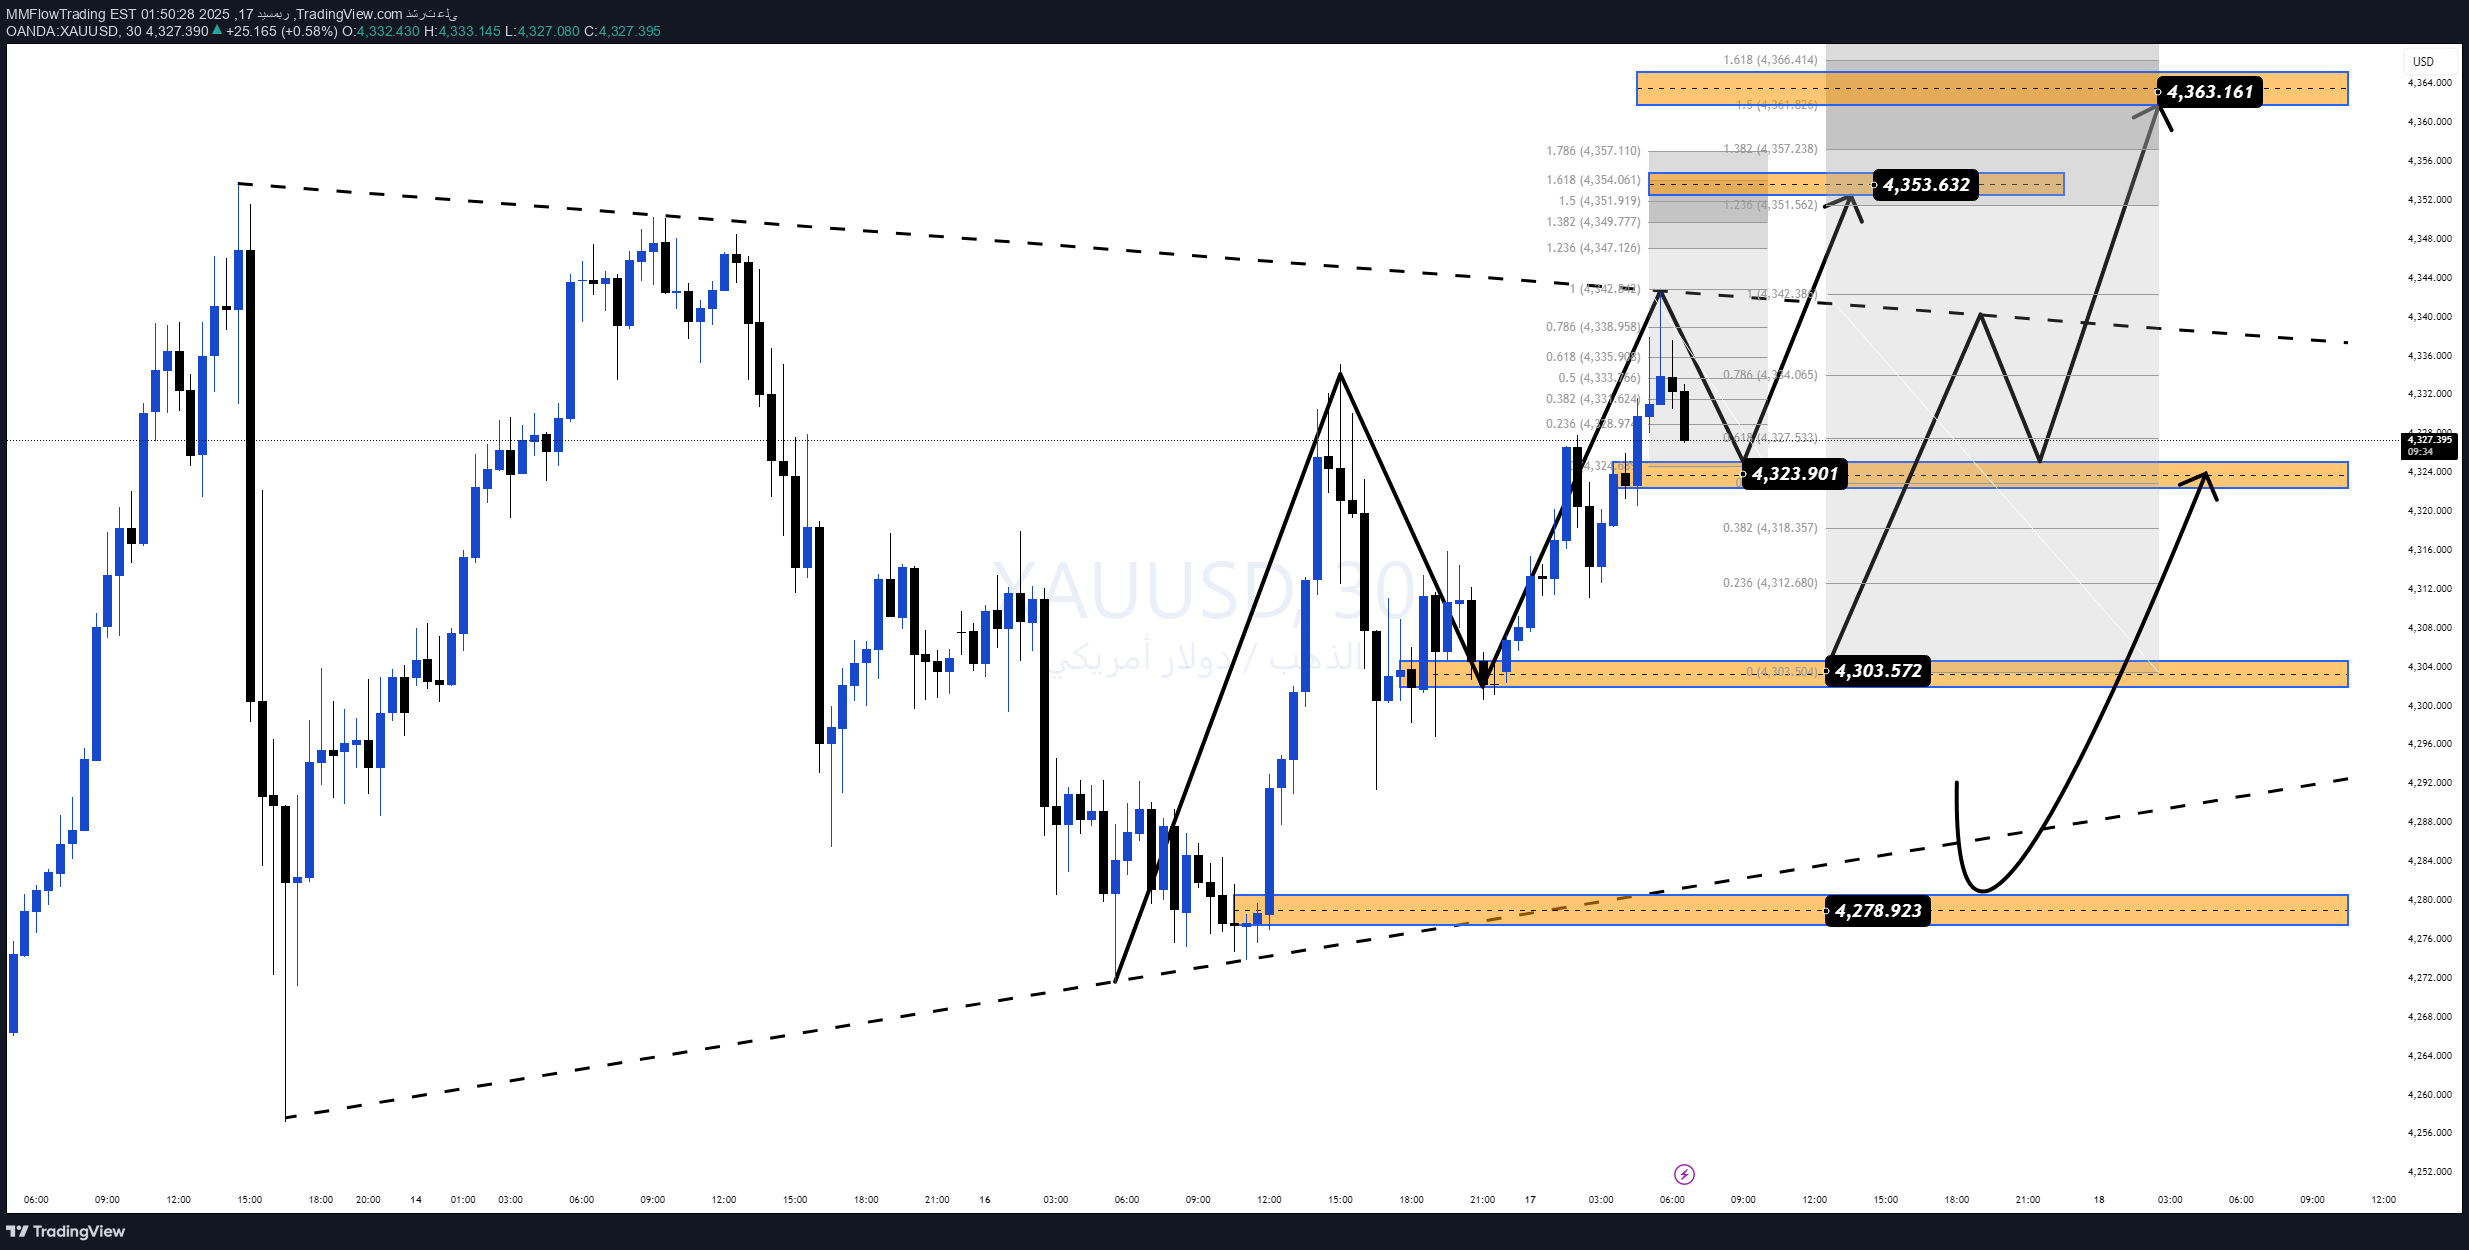
بعد الانخفاض القوی السابق، حافظ الذهب على منطقة الطلب فی قاع القناة وظهرت ردود فعل ارتفاع واضحة. حالیًا، السعر فی مرحلة التعافی الفنی، وفی نفس الوقت یعود لاختبار مناطق السیولة فی الأعلى. من الناحیة الکلیة، یمیل شعور السوق نحو توقع أن یحافظ الفیدرالی على موقف أکثر لیونة، مما یوفر دعمًا للذهب فی فترات التصحیح الهبوطی. الهیکل الفنی (M30–H1) السعر یتحرک داخل قناة صاعدة قصیرة الأجل المنطقة 4,278 – 4,280 تلعب دور الطلب المهم (قاع الهیکل) بعد تکوین قاع أعلى، ارتفع السعر وحافظ على الهیکل الصاعد المناطق فی الأعلى هی السیولة + العرض، یجب مراقبة ردود فعل السعر خطة التداول – أسلوب MMF السیناریو الرئیسی – الشراء وفقًا للهیکل منطقة الشراء المفضلة: 4,300 – 4,304 الشرط: ارتداد السعر إلى منطقة الطلب، دون کسر القاع السابق الأهداف: TP1: 4,324 TP2: 4,353 TP3: 4,363 (السیولة فی الأعلى) السیناریو الثانوی إذا لم یرتد السعر بعمق بل کسر وحافظ فوق 4,324، انتظر إعادة الاختبار للشراء وفق الاتجاه. منطقة الإبطال (Invalidation) إذا کسر السعر بقوة تحت 4,278، یتم إبطال الهیکل الصاعد القصیر الأجل عندها: البقاء خارجًا، انتظار تأکید هیکل جدید وجهة نظر MMF الاتجاه القصیر الأجل یدعم الشراء عند ارتداد السعر إلى منطقة الخصم. لا تطارد الأوامر فی منطقة القمة – کن صبورًا وانتظر عودة السعر إلى الطلب، وتداول وفقًا للهیکل بدلاً من العواطف. التحیز الیومی: صاعد فوق 4,278 – الأولویة للشراء عند الارتداد.
MMFlowTrading
XAU/USD: Buy on Price Retracement in Discount Area
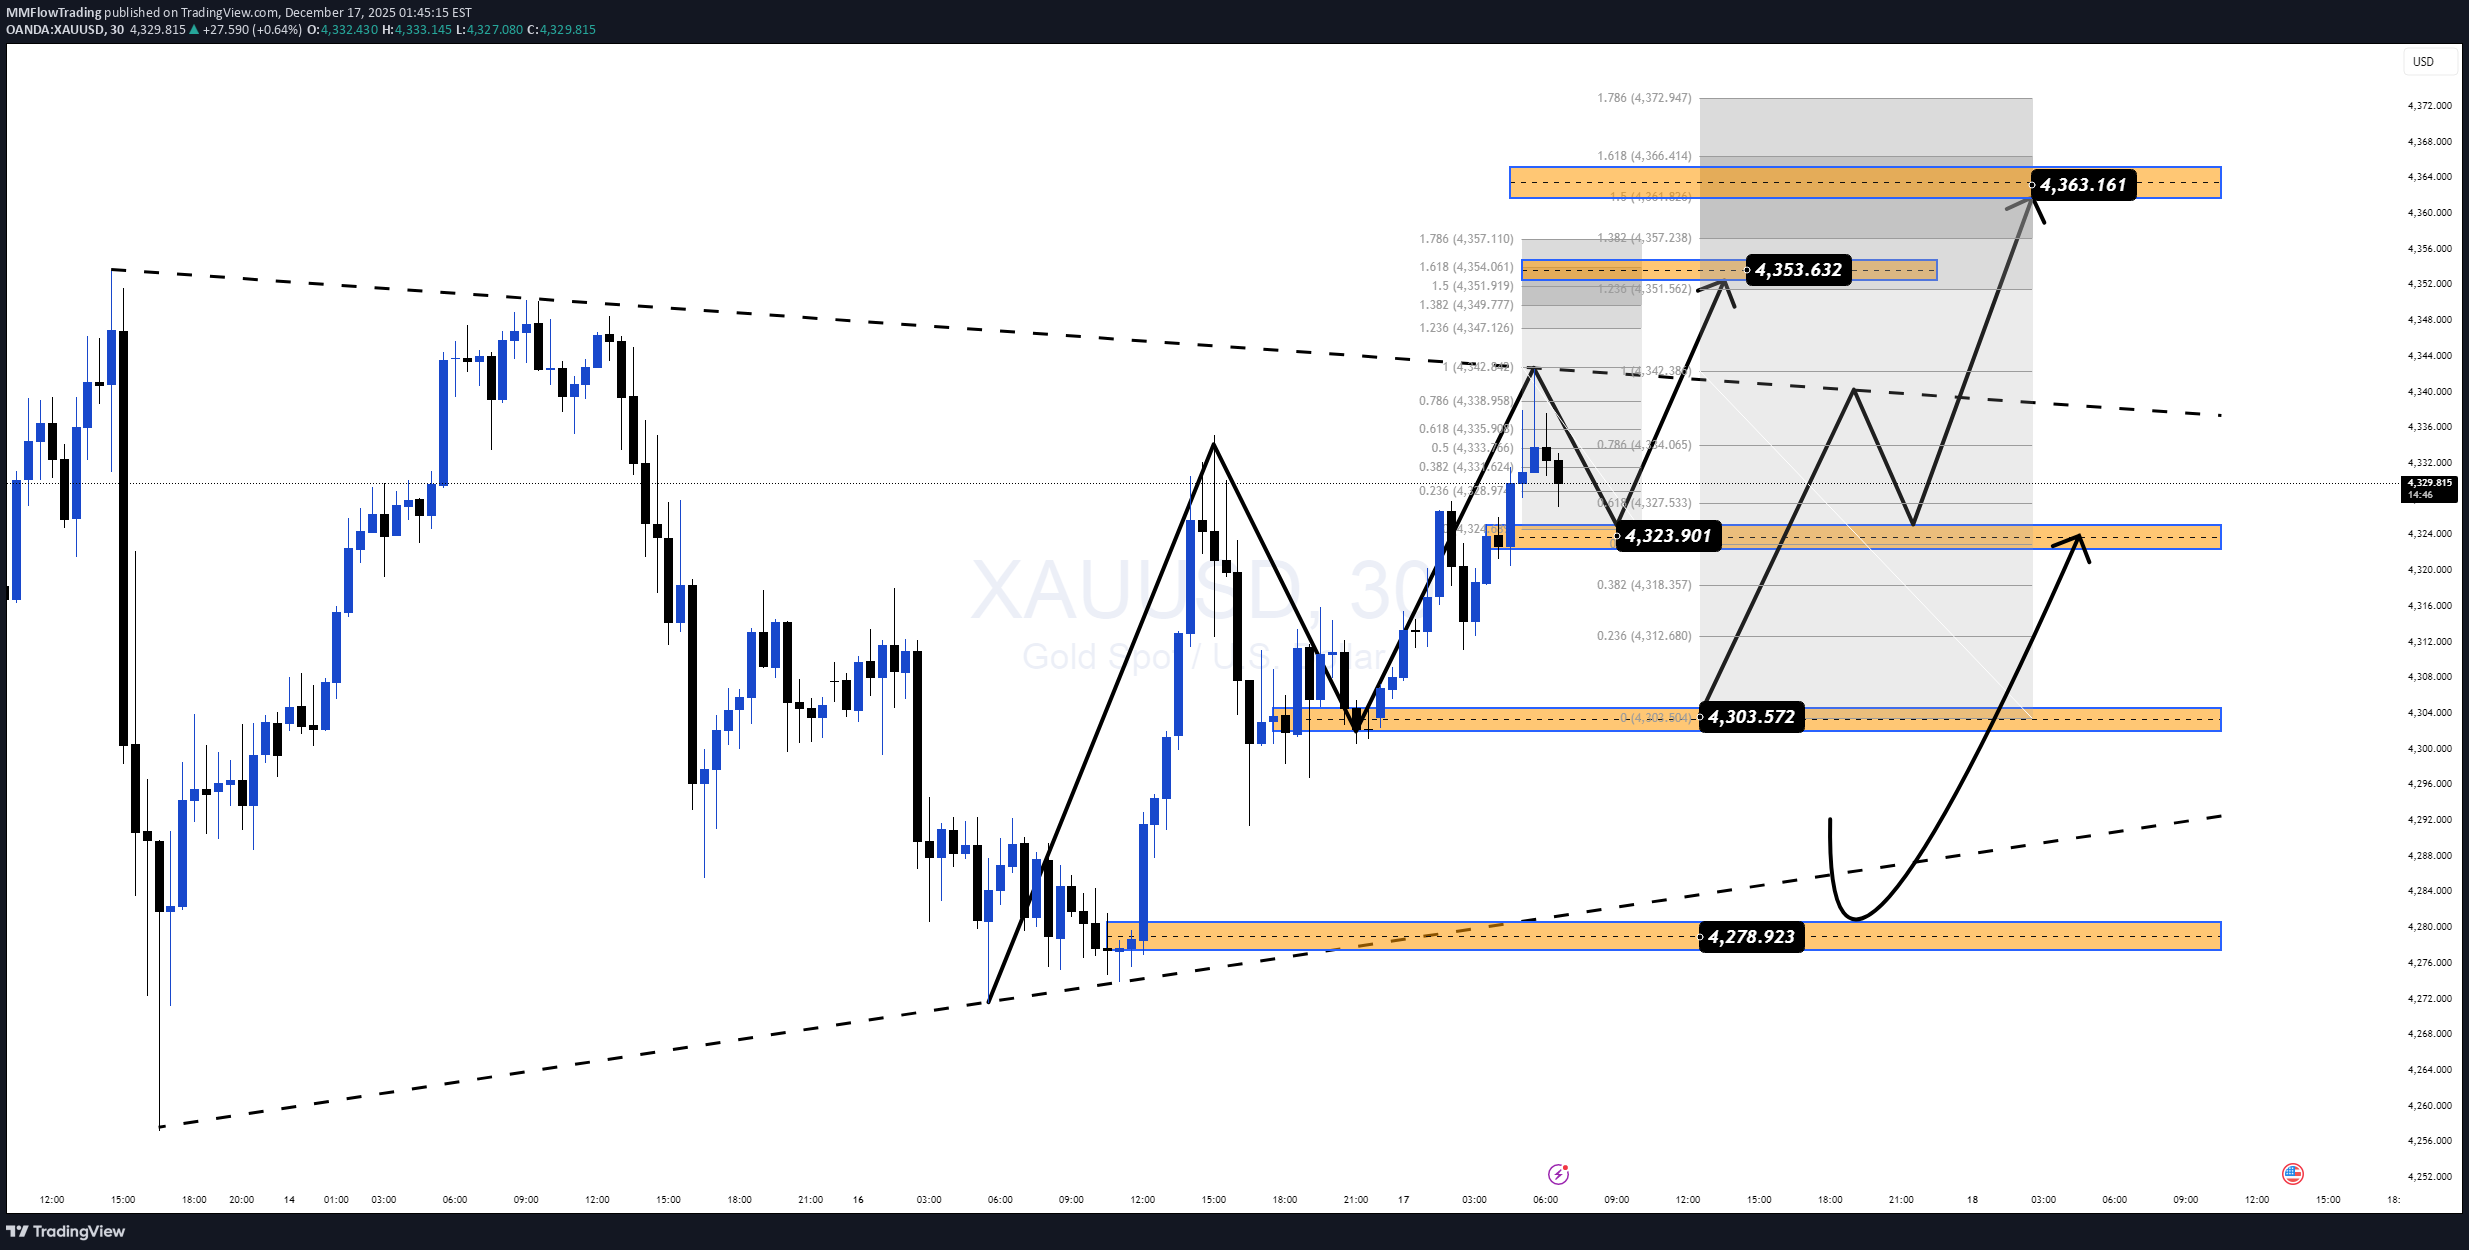
After the previous strong decline, gold has held firm at the channel bottom demand area and showed a clear upward reaction. Currently, the price is in a technical recovery phase, simultaneously returning to test the liquidity areas above. On the macro side, market sentiment still leans towards the expectation that the Fed will maintain a softer stance, providing support for gold during downward adjustments. Technical Structure (M30–H1) The price is moving within a short-term upward channel The 4,278 – 4,280 area plays an important demand role (structure bottom) After forming a Higher Low, the price bounced up and maintained the upward structure The areas above are liquidity + supply, need to observe price reactions Trading Plan – MMF Style Main Scenario – BUY according to structure Priority BUY area: 4,300 – 4,304 Condition: price retraces to demand area, does not break the previous bottom Targets: TP1: 4,324 TP2: 4,353 TP3: 4,363 (liquidity above) Alternative Scenario If the price does not retrace deeply but breaks and holds above 4,324, wait for a retest to BUY following the trend. Invalidation Area If the price breaks strongly below 4,278, the short-term upward structure is invalidated In that case: stay out, wait for new structure confirmation MMF Perspective The short-term trend supports BUY when the price retraces to the discount area. Do not chase orders in the premium area – patiently wait for the price to reach demand, trade according to structure instead of emotions. Daily Bias: Bullish above 4,278 – Priority to BUY pullback.
MMFlowTrading
XAU/USD – توزيع في القمة، بيع عند الارتفاعات سياق السوق
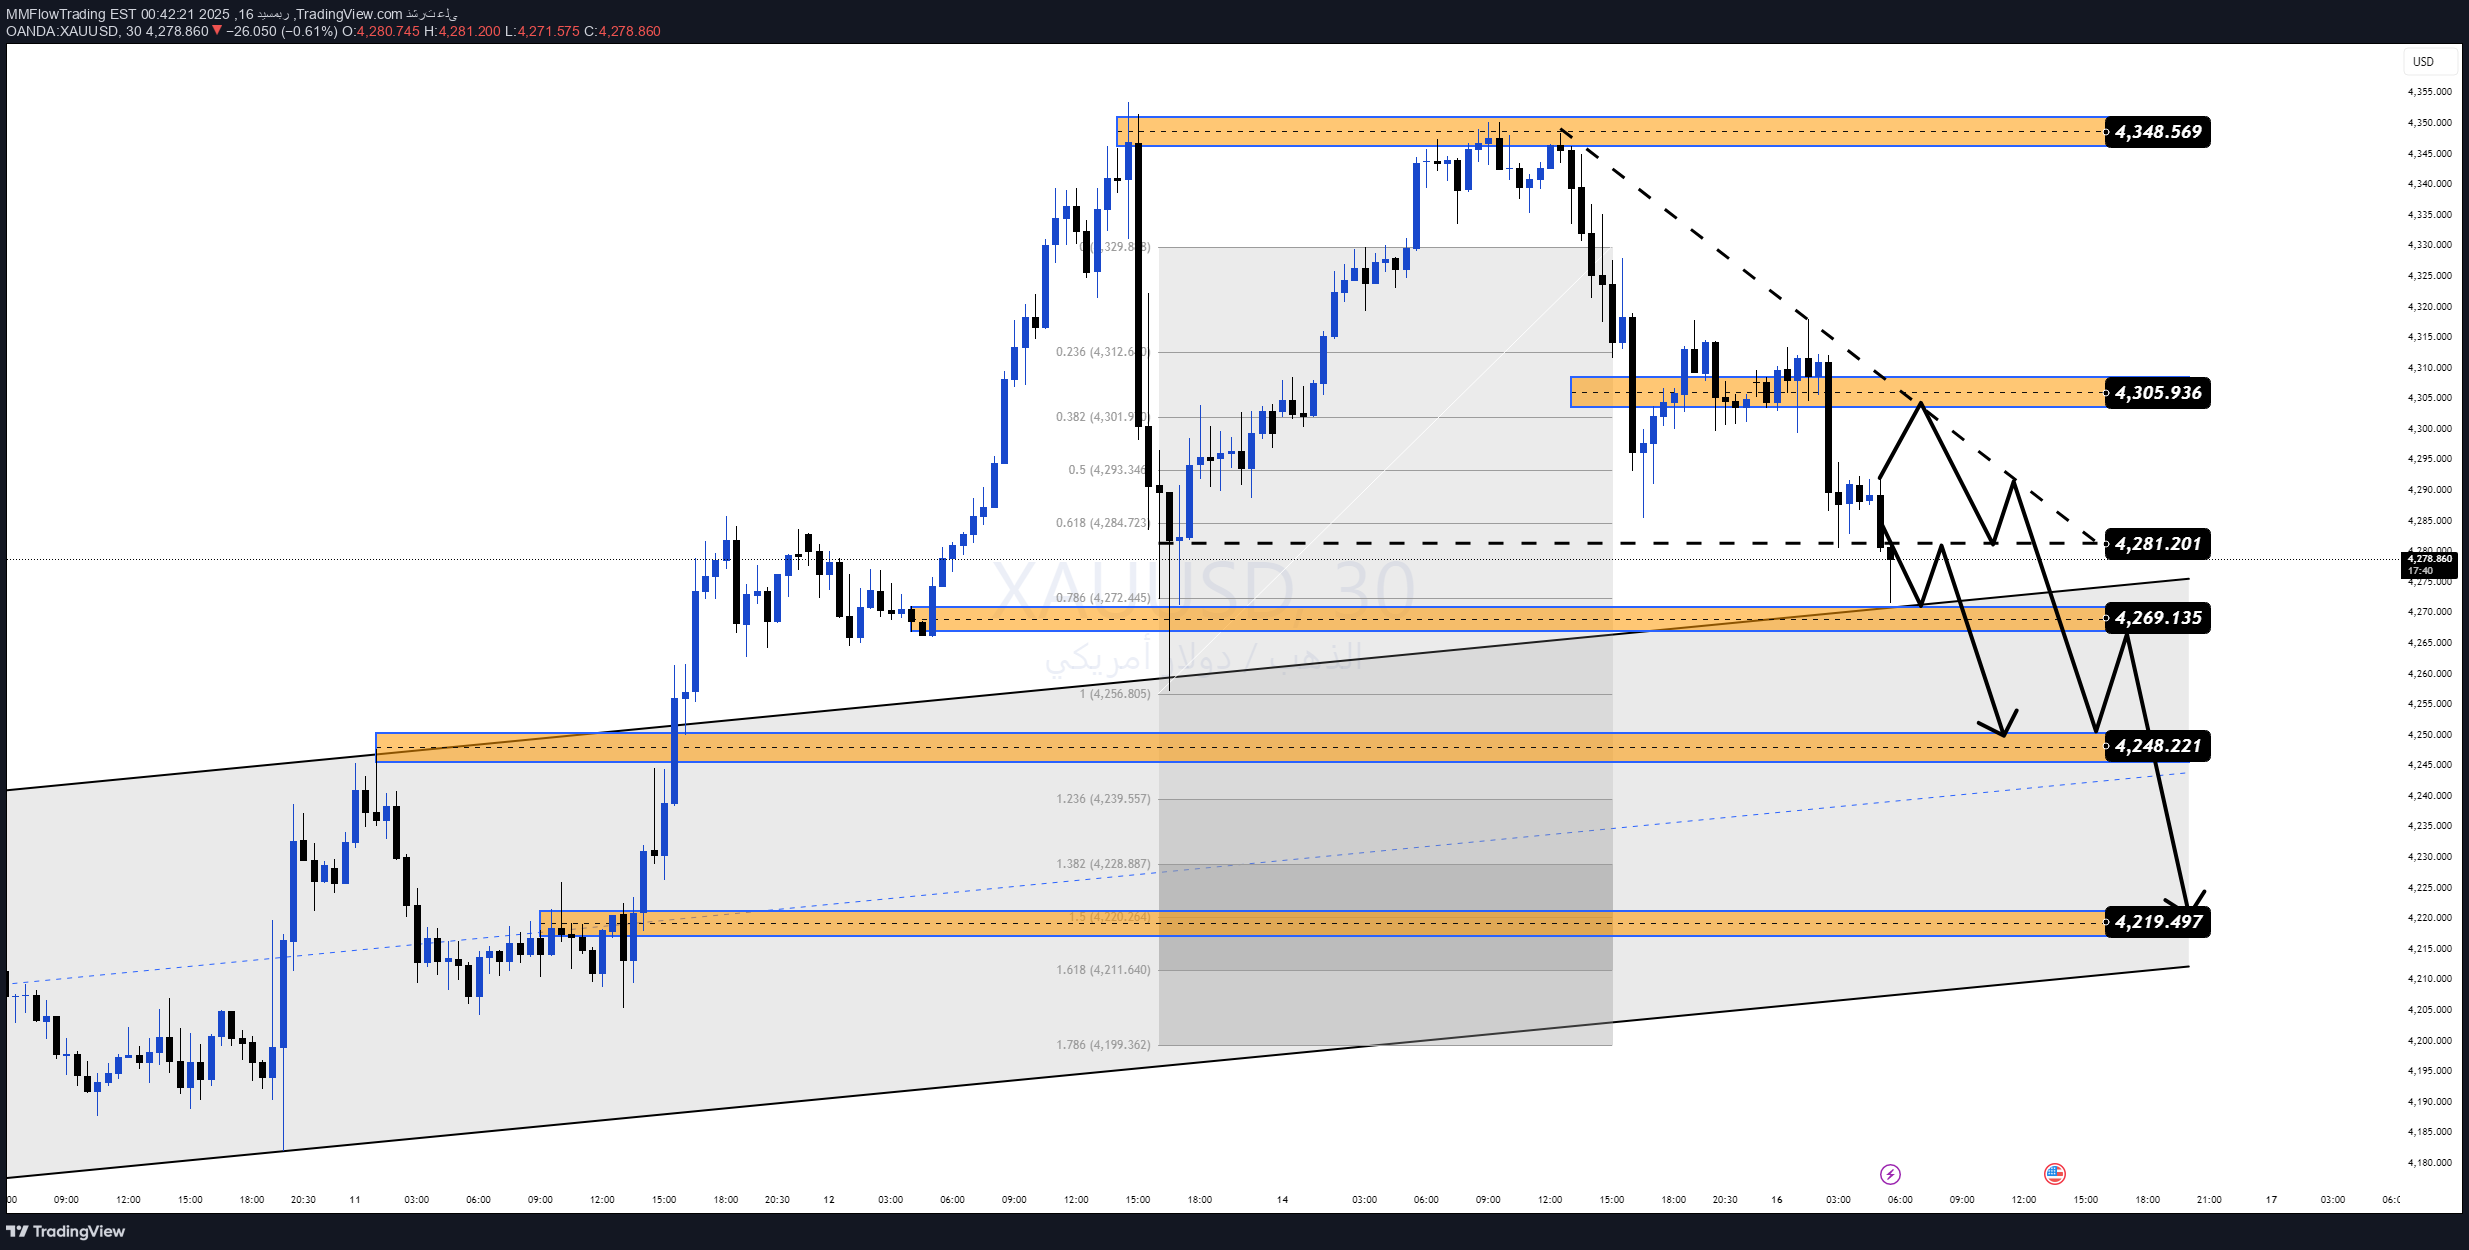
بعد دفعة صعودیة قویة، یظهر الذهب الآن علامات واضحة على الإرهاق بالقرب من منطقة السیولة العلیا. فشل السعر فی الحفاظ على الارتفاع الأخیر وبدأ فی الدوران للأسفل، مما یشیر إلى مرحلة توزیع بدلاً من الاستمرار. من منظور کلی، على الرغم من أن التوقعات حول سیاسة الفیدرالی لا تزال مختلطة، إلا أن التمرکز قصیر الأجل یبدو مزدحماً على جانب الشراء، مما یزید من احتمال حدوث حرکة تصحیحیة لإعادة توازن السیولة. الهیکل الفنی (M30–H1) رفض السعر بشکل حاد من منطقة العرض / السیولة 4,348 تکون قمة أقل تحت مقاومة خط الاتجاه الهابط یتداول السوق تحت الهیکل الرئیسی الیومی، مما یشیر إلى ضغط هبوطی یفضل حرکة السعر الحالیة نهج بیع الارتفاعات خطة التداول – أسلوب MMF السیناریو الأساسی – استمرار البیع منطقة البیع المفضلة: 4,300 – 4,306 التأکید: رفض هبوطی / زخم صعودی ضعیف الأهداف: TP1: 4,281 TP2: 4,269 TP3: 4,248 الهدف الممتد: 4,219 (طلب رئیسی + دعم القناة) الإبطال اختراق نظیف وثبات فوق 4,348 سیبطل الانحیاز الهبوطی قصیر الأجل. فی هذه الحالة، انتظر جانباً وانتظر تأکید هیکل جدید. منظور MMF عند المستویات الممتازة، یفضل المخاطرة الصبر على مطاردة الشراء. الترکیز الآن على حمایة رأس المال وبیع الارتفاعات، انتظار وصول السعر إلى مناطق الطلب الأعمق قبل النظر فی أی إعدادات صعودیة جدیدة. الانحیاز الیوم: هبوطی تحت 4,348 – بیع الارتفاعات، إدارة المخاطر بصرامة.
MMFlowTrading
XAU/USD – Distribution at the Top, Sell on Rallies Market Contex
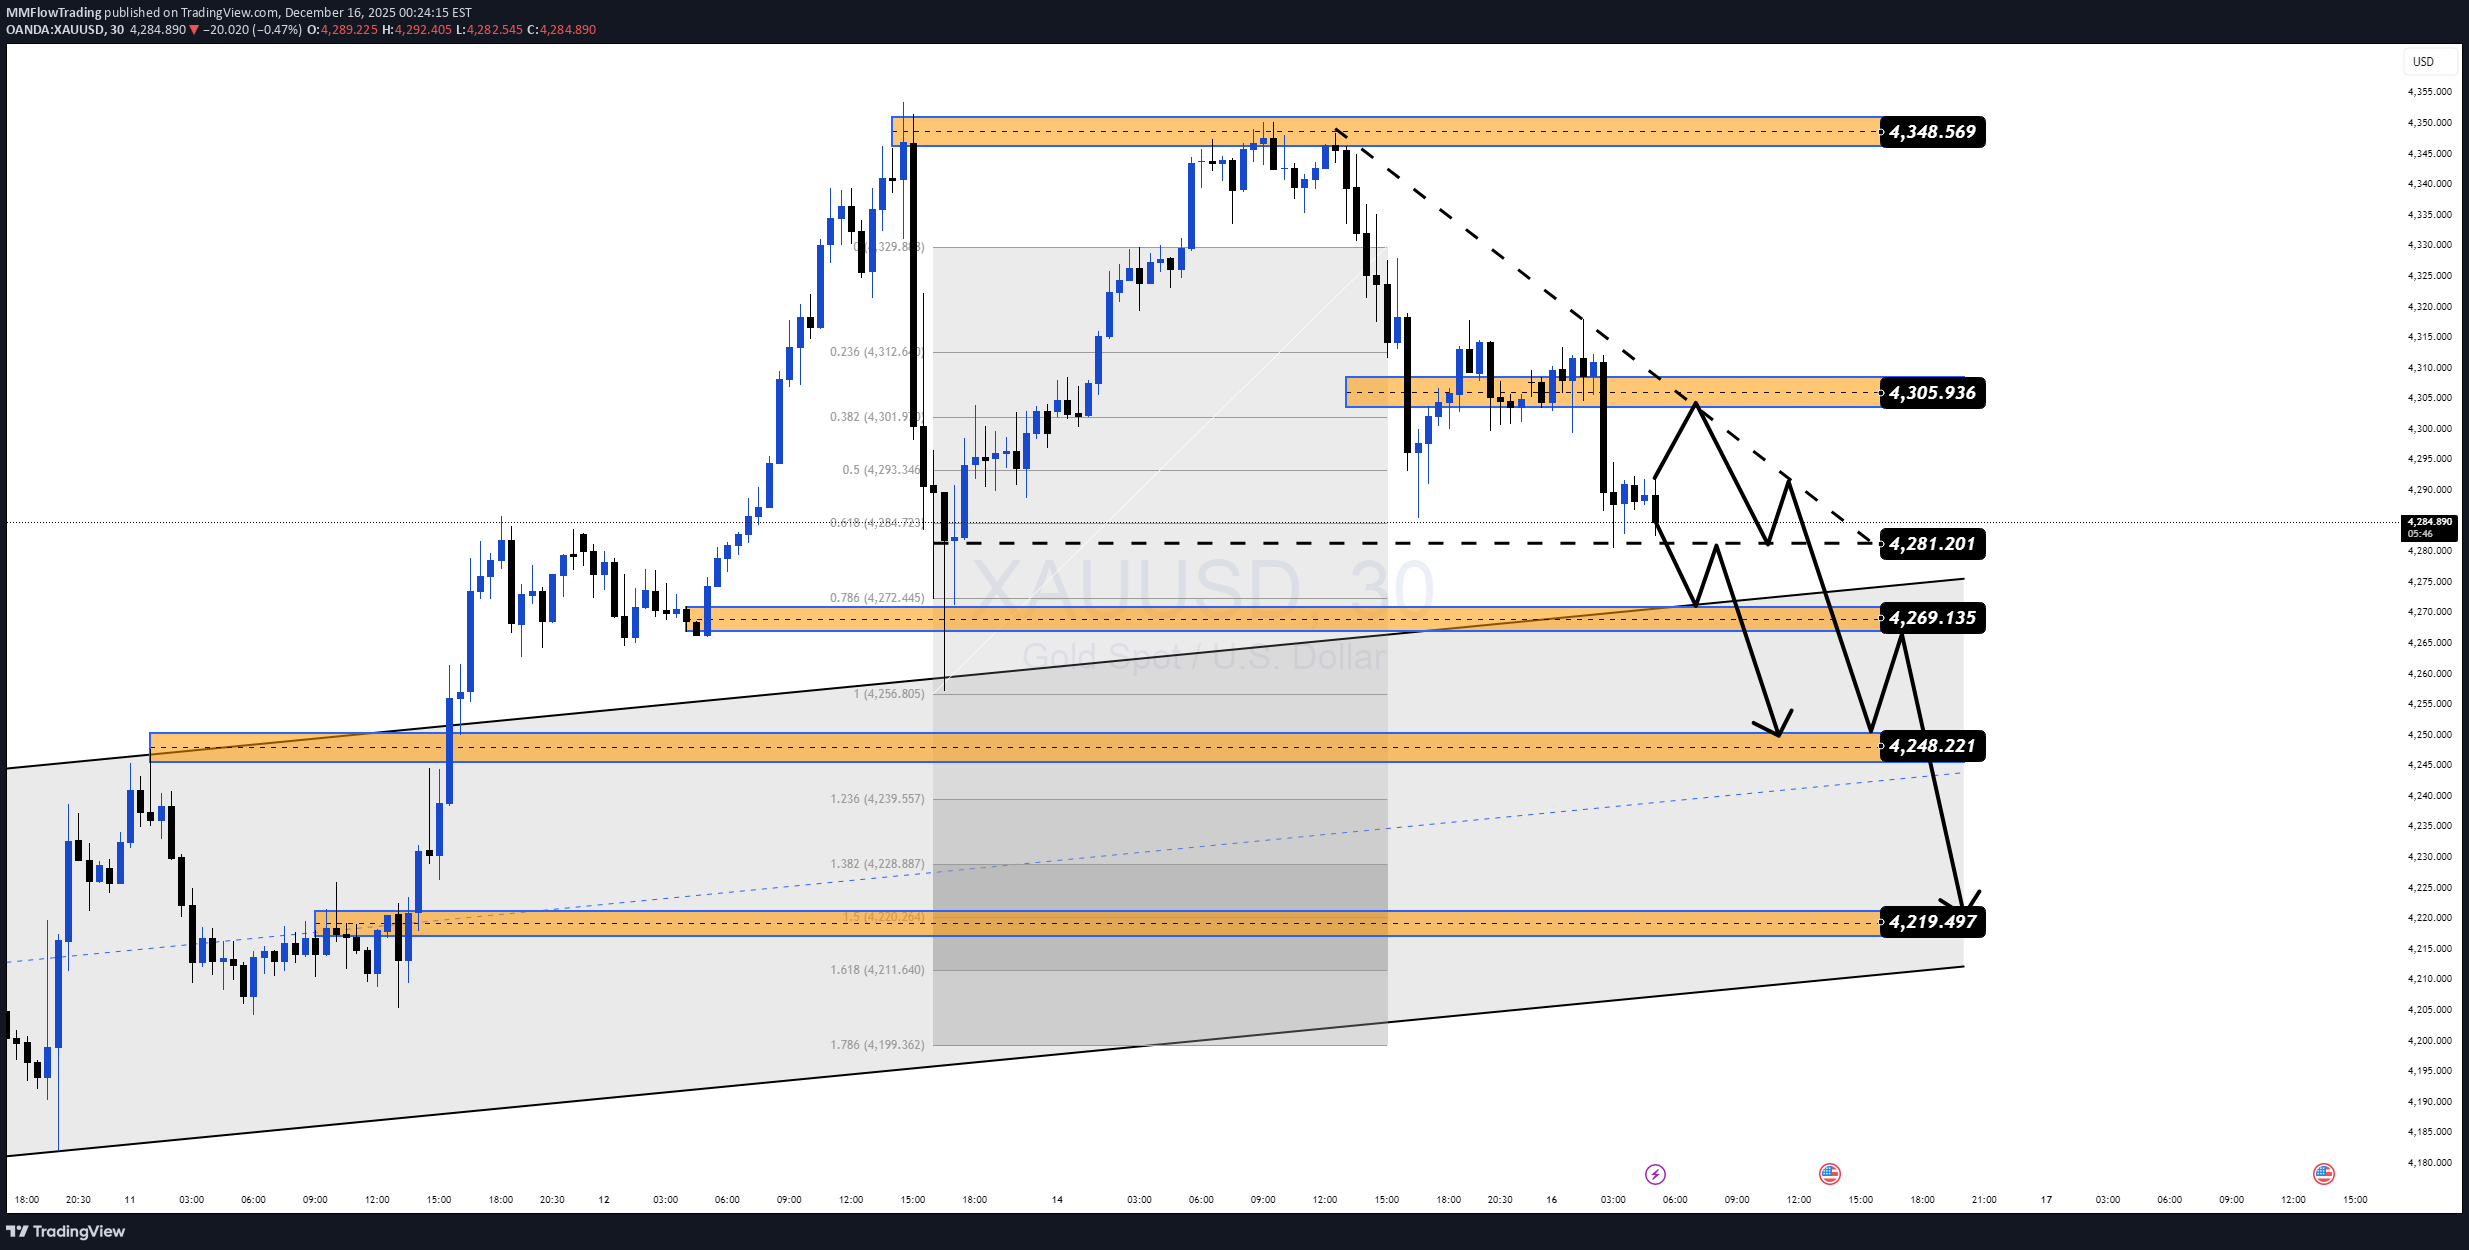
After a strong bullish impulse, Gold is now showing clear signs of exhaustion near the upper liquidity zone. Price failed to sustain above the recent high and has started to rotate lower, suggesting a distribution phase rather than continuation. From a macro perspective, although expectations around Fed policy remain mixed, short-term positioning looks crowded on the buy side, increasing the probability of a corrective move to rebalance liquidity. Technical Structure (M30–H1) Price rejected sharply from the 4,348 supply / liquidity zone A lower high has formed under descending trendline resistance Market is trading below key intraday structure, signaling bearish pressure Current price action favors a sell-the-rally approach Trading Plan – MMF Style Primary Scenario – SELL Continuation Preferred SELL zone: 4,300 – 4,306 Confirmation: bearish rejection / weak bullish momentum Targets: TP1: 4,281 TP2: 4,269 TP3: 4,248 Extended target: 4,219 (major demand + channel support) Invalidation A clean break and hold above 4,348 would invalidate the short-term bearish bias. In that case, stand aside and wait for new structure confirmation. MMF Perspective At premium levels, risk favors patience over chasing buys. The focus now is on capital protection and selling rallies, waiting for price to reach deeper demand zones before considering any new bullish setups. Bias today: Bearish below 4,348 – Sell rallies, manage risk strictly.
MMFlowTrading
XAU/USD – تأكيد الاتجاه الصاعد، الشراء عند التصحيحات
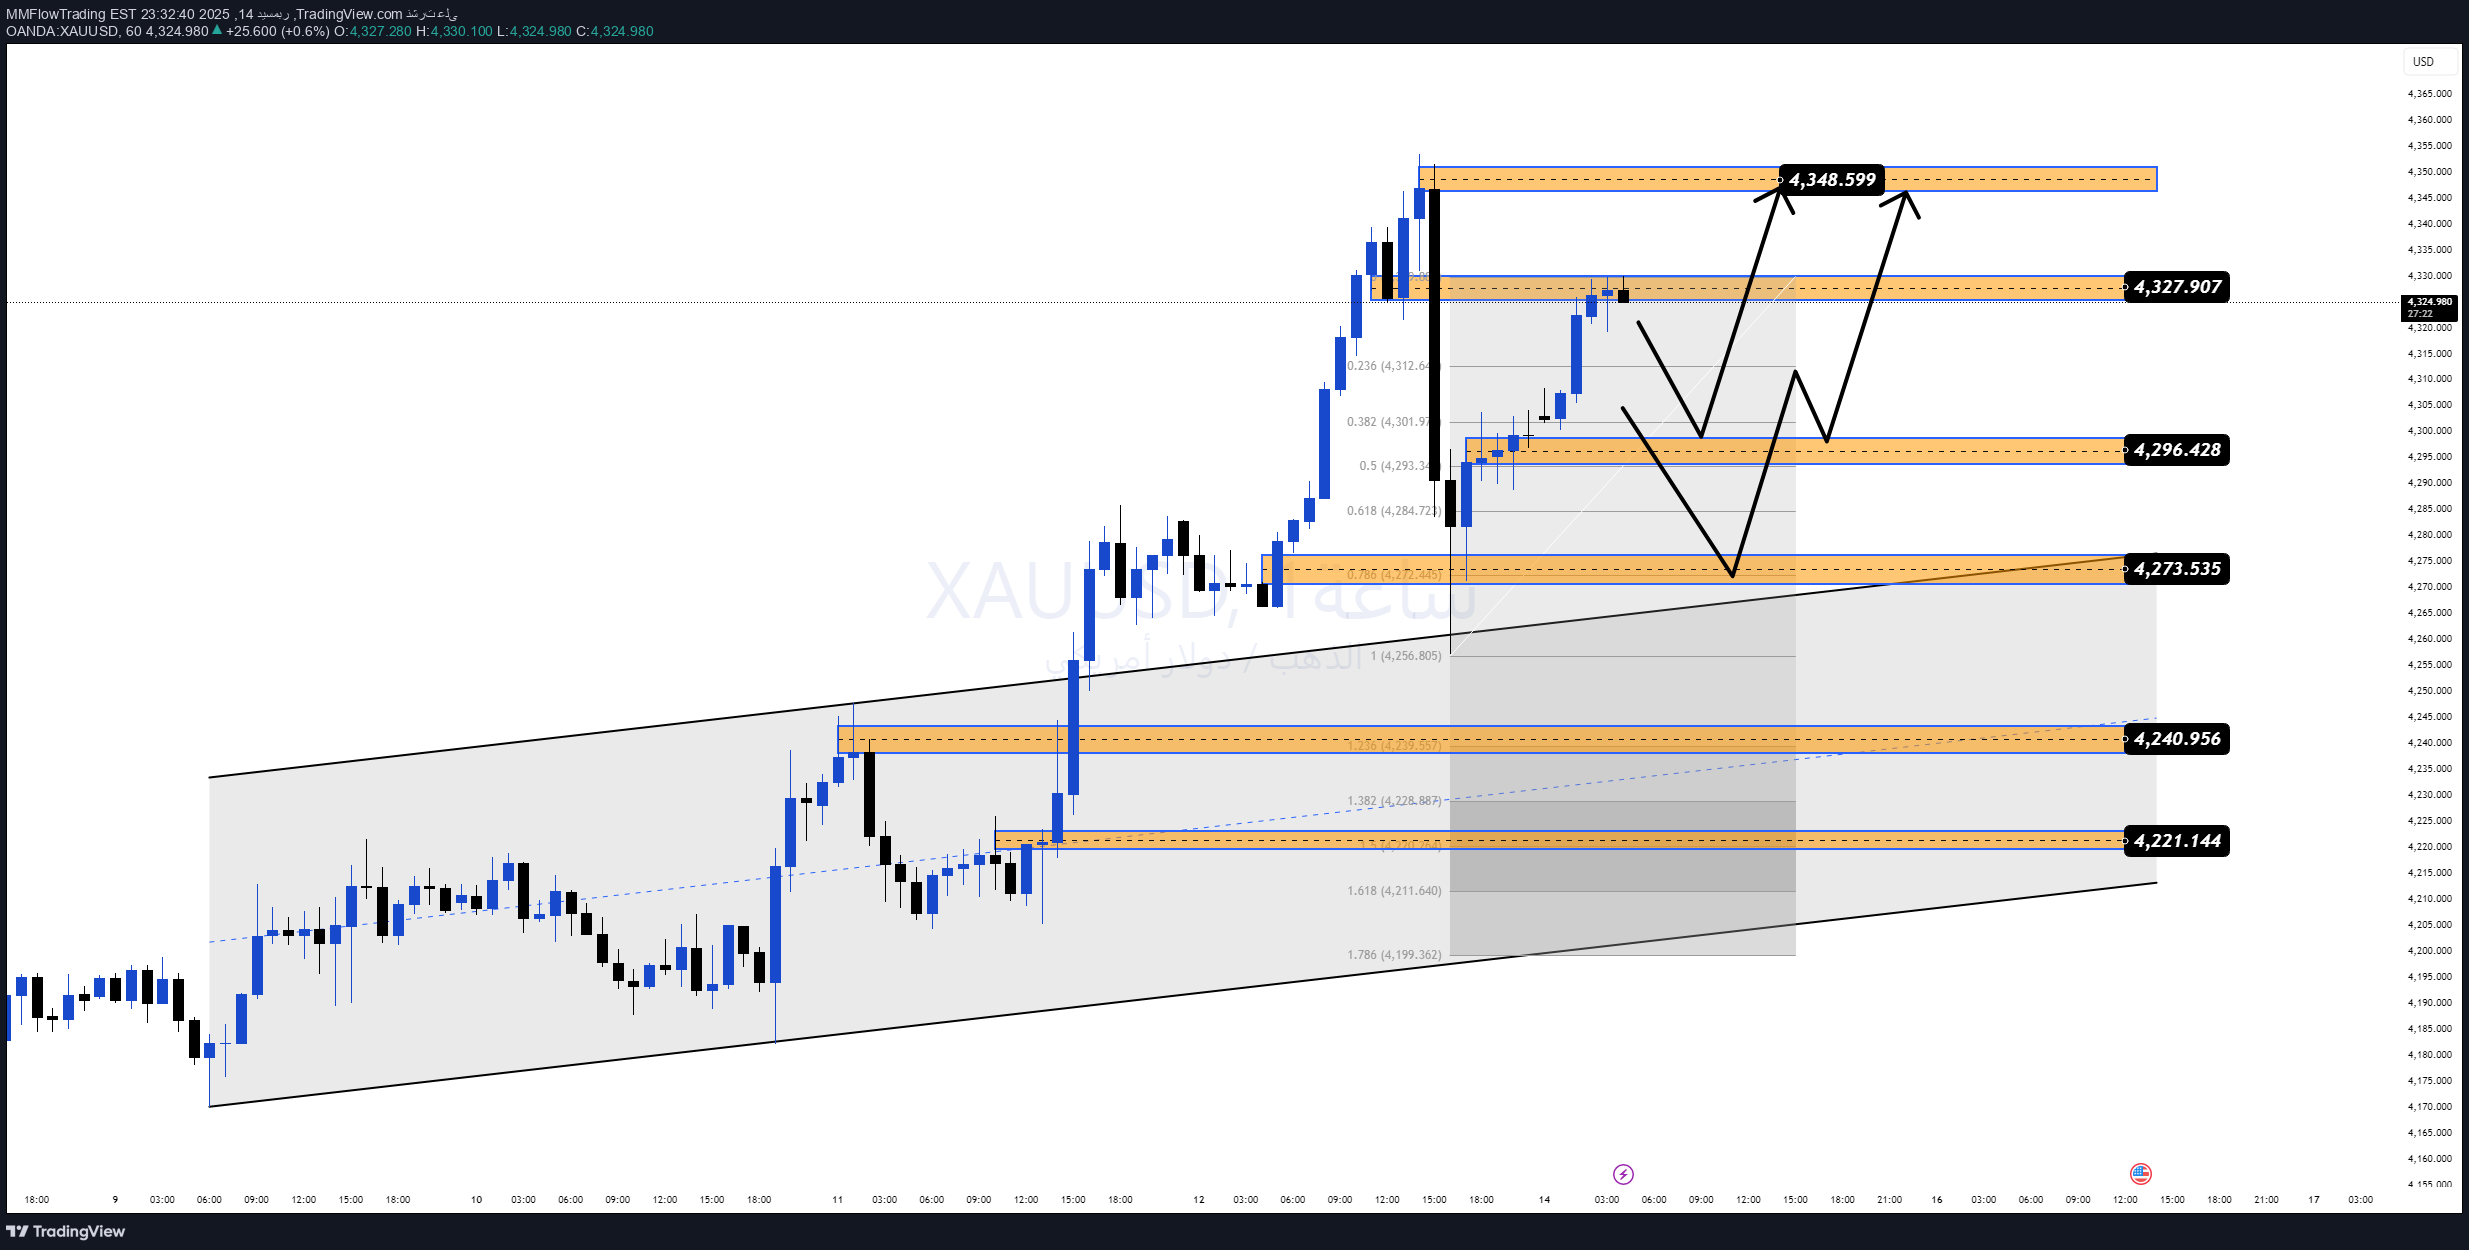
سیاق السوق یواصل الذهب الحفاظ على اتجاه صاعد قوی ویتداول داخل قناة صعودیة واضحة. بعد حرکة اندفاعیة قویة، دخل السوق فی مرحلة تصحیح فنی لإعادة توازن السیولة، وهو سلوک صحی فی الأسواق الاتجاهیة ولیس إشارة انعکاس. من الناحیة الأساسیة، تستمر توقعات الفیدرالی الحذِرة وآفاق خفض الفائدة فی دعم الذهب، مما یجعل الهبوط ذا طابع تصحیحی ویعزز استراتیجیات الشراء مع الاتجاه. الهیکل الفنی (H1) • هیکل صاعد مؤکد عبر Higher Highs وHigher Lows • تفاعل السعر عند مناطق تلاقی قویة (دعم الترند + الطلب + فیبوناتشی) • لا یوجد کسر هیکلی هابط مؤکد حتى الآن خطة التداول – أسلوب MMF السیناریو الرئیسی – BUY مع الاتجاه • منطقة الشراء: 4,296 – 4,292 • وقف الخسارة: أسفل 4,286 الأهداف: TP1: 4,327 TP2: 4,348 TP3: امتداد فی حال استمرار الزخم → الاستراتیجیة: انتظار التصحیحات، وعدم مطاردة السعر عند القمم. السیناریو البدیل • کسر وإغلاق واضح أسفل 4,241 یضعف الهیکل الصاعد • الترقب حتى تأکید هیکل جدید منظور MMF فی السوق الصاعد، الهدف لیس توقع القمة، بل شراء التصحیحات عند مناطق عالیة الاحتمال. طالما السعر أعلى الدعوم الرئیسیة، یظل التحیز الأساسی BUY.
MMFlowTrading
XAU/USD – Bullish Trend Confirmed, Buy on Pullbacks
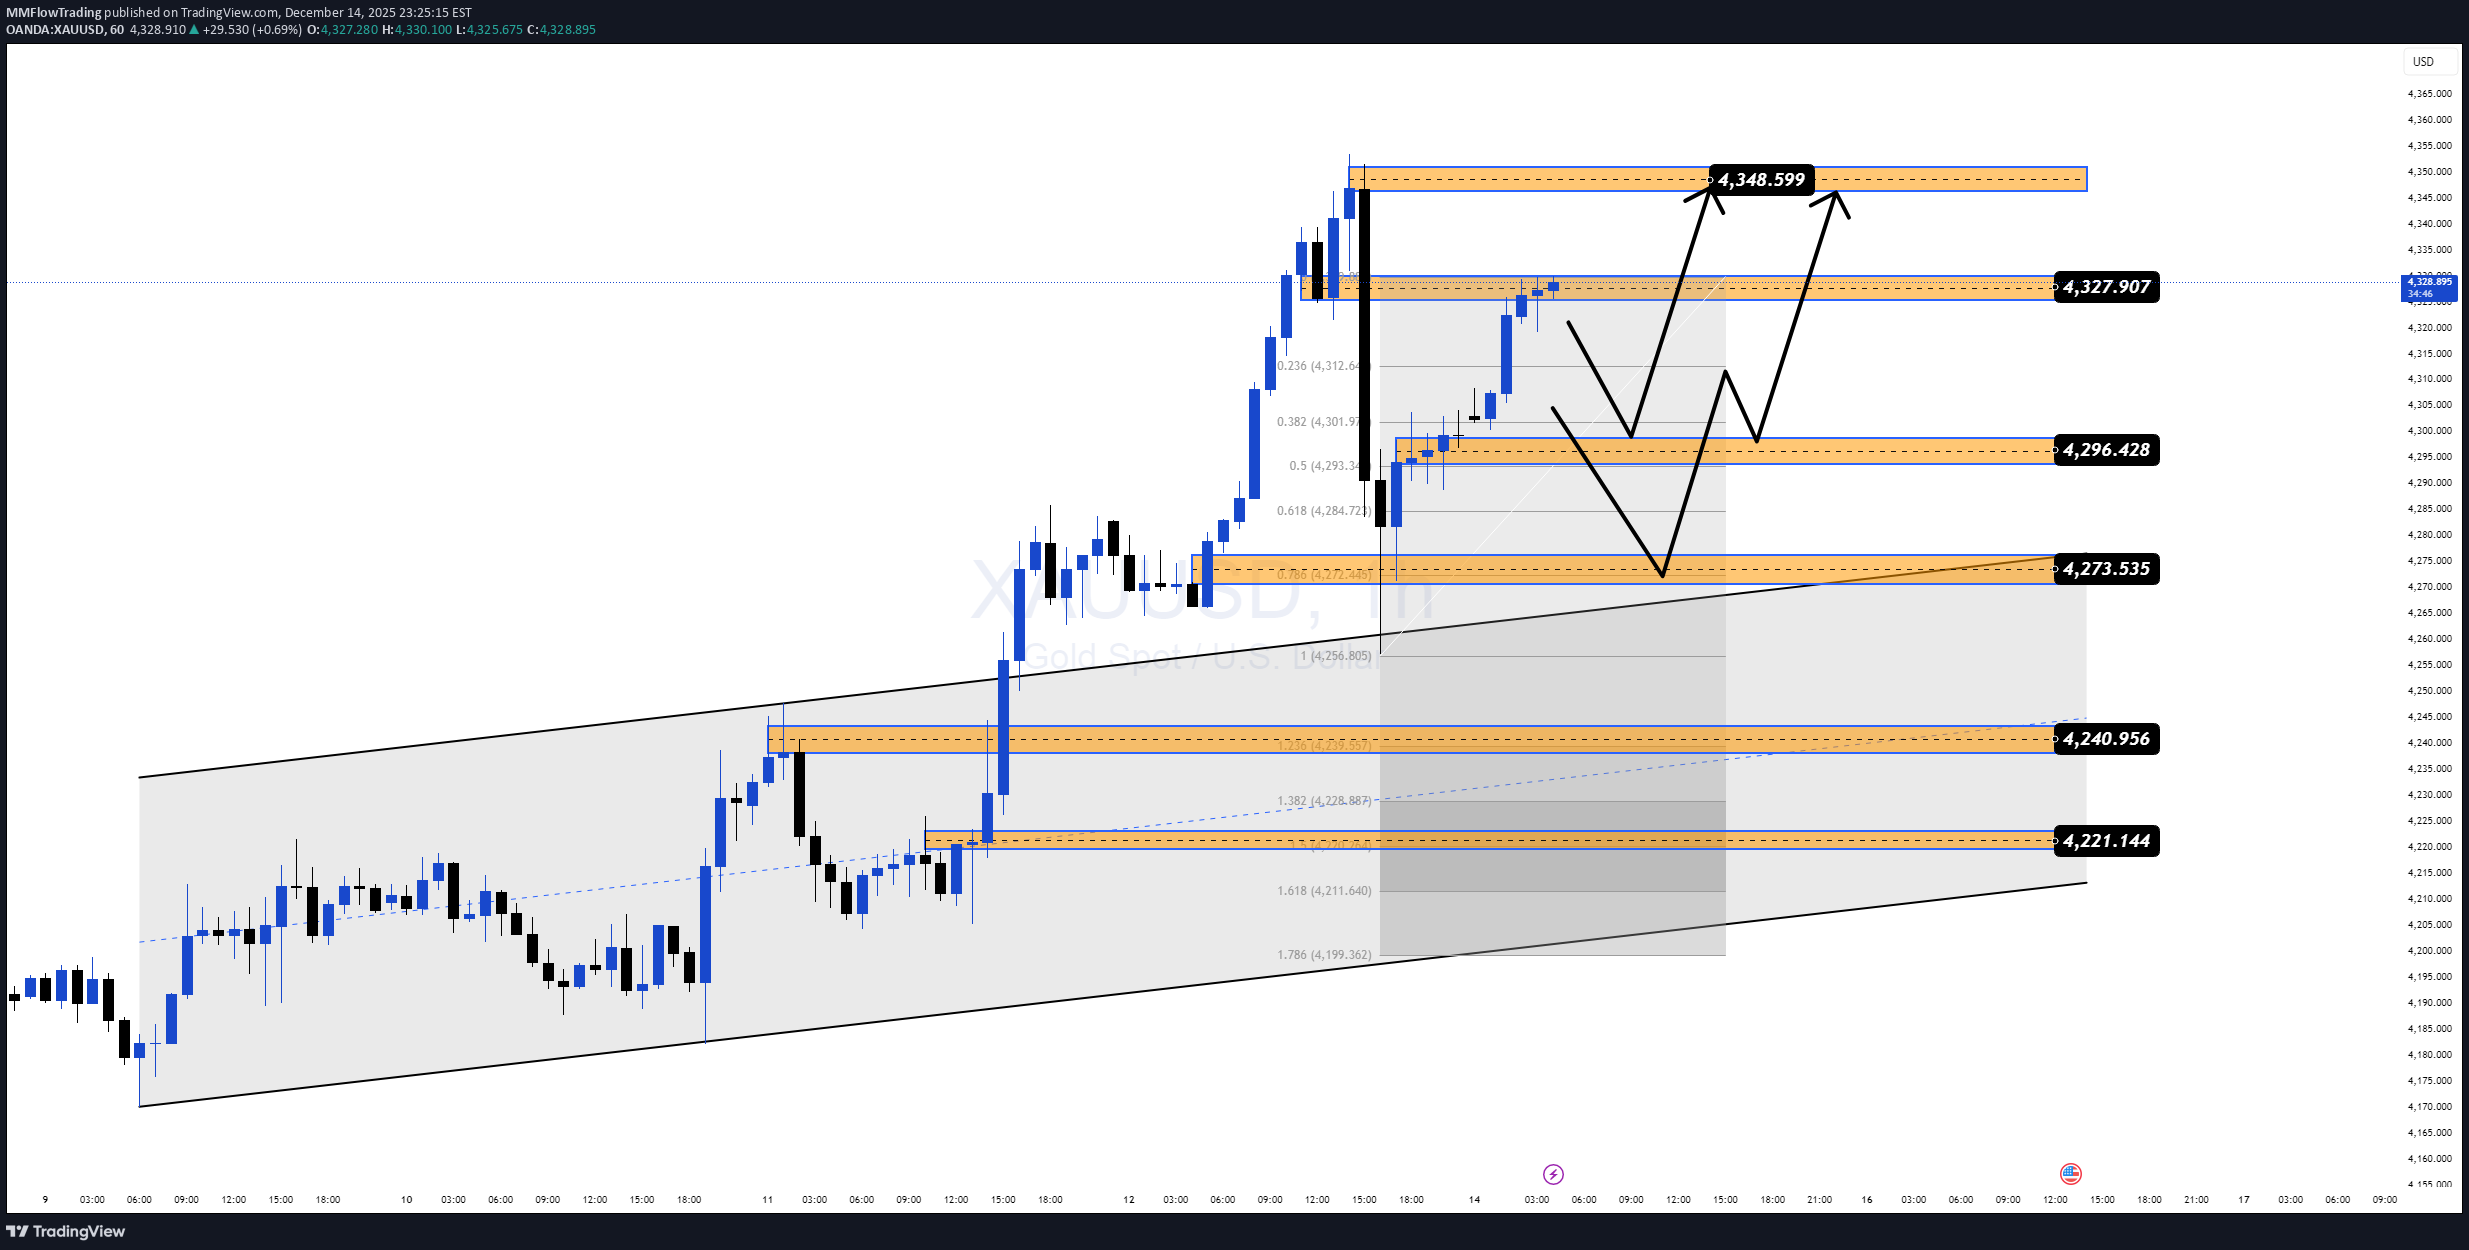
Market Context Gold remains firmly bullish, continuing to trade within a well-defined ascending channel. After a strong impulsive rally, the market is now entering a technical pullback phase to rebalance liquidity, which is a healthy behavior in a trending market rather than a sign of reversal. From a macro perspective, dovish Fed expectations and the outlook for lower interest rates continue to support Gold. This keeps downside moves corrective in nature and favors trend-following BUY strategies. Technical Structure (H1) • Bullish structure remains intact with Higher Highs and Higher Lows • Price is reacting at key confluence zones (trendline support + demand + Fibonacci) • No confirmed bearish structure break at this stage Trading Plan – MMF Style Primary Scenario – Trend-Following BUY • Preferred BUY zone: 4,296 – 4,292 • Stop Loss: below 4,286 Targets: TP1: 4,327 TP2: 4,348 TP3: Extension if bullish momentum continues → Strategy: wait for pullbacks into key demand zones. No FOMO chasing at highs. Alternative Scenario • If price breaks and closes clearly below 4,241, short-term bullish structure weakens • Stand aside and wait for a new structure confirmation MMF Perspective In a bullish market, the goal is not to predict the top, but to buy pullbacks at high-probability zones with favorable risk–reward. As long as price holds above key supports, the primary bias remains BUY.
MMFlowTrading
الذهب ورأس وكتفين مقلوب: آیا قیمت به زودی به اوج میرسد؟
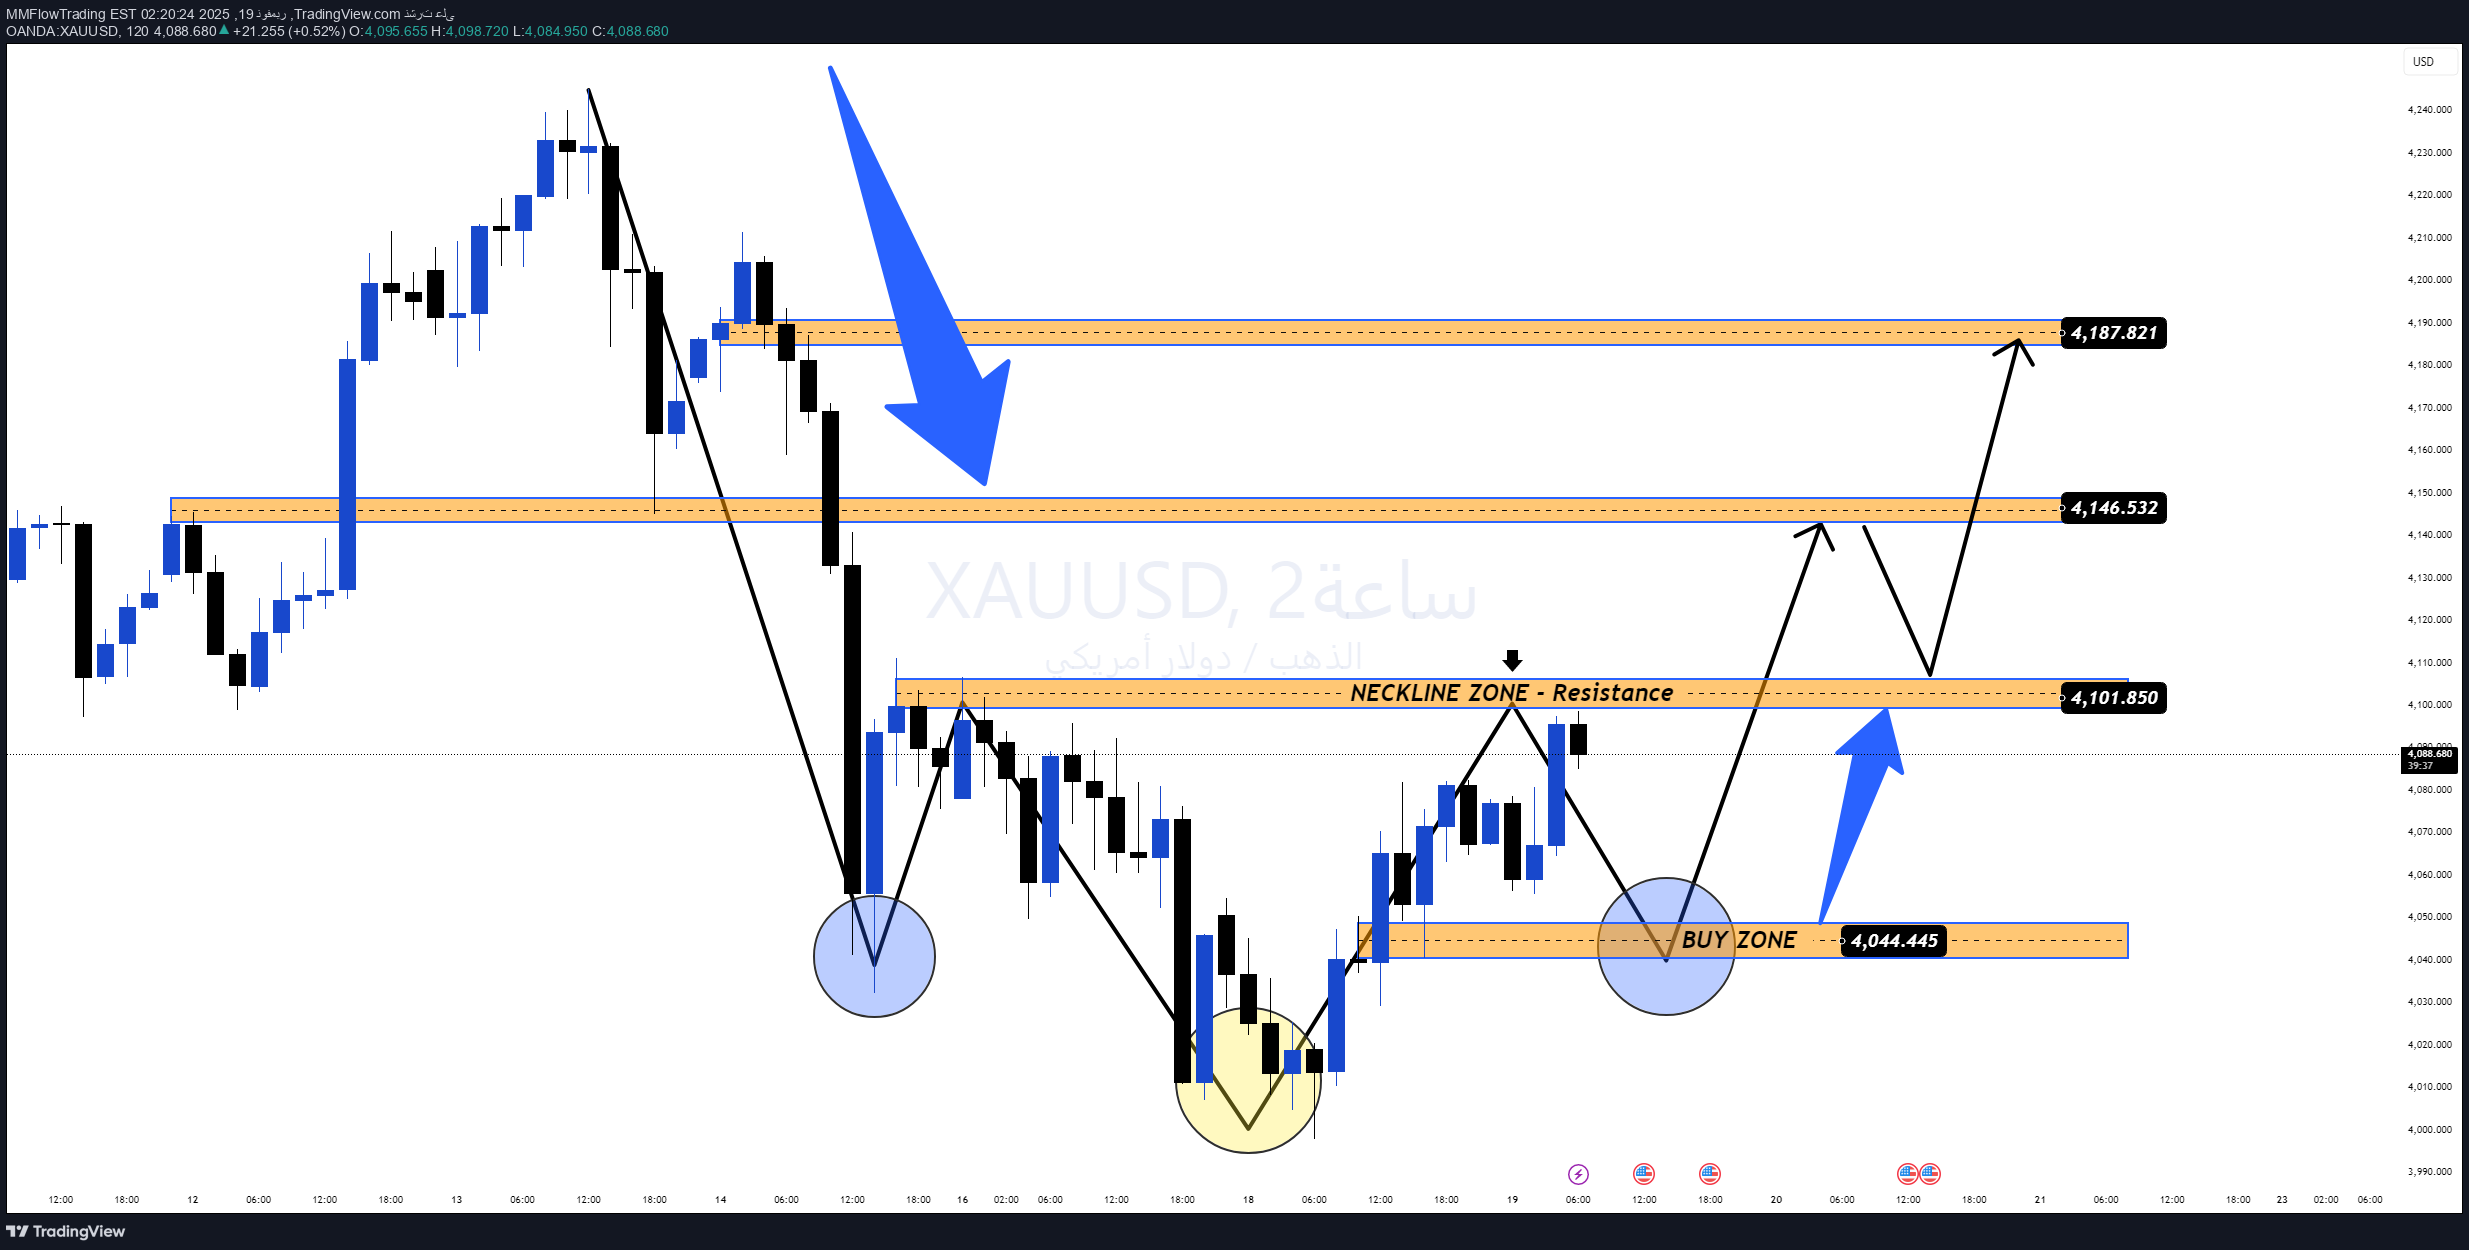
بعد انخفاض تصحیحی قصیر الأجل، مستوى 4,000 دولار قد أثار زخم شراء قوی، مما خلق ارتدادًا واضحًا فی الأسعار فی نهایة جلسة الأمس. الزیادة فی حجم الشراء تشیر إلى أن جانب الشراء یعود إلى السوق بعد عدة جلسات من الانخفاض. 📊 هیکل تقنی بارز على الرسم البیانی لمدة ساعتین، الذهب یکمل نمط الرأس والکتفین المقلوب – أحد أقوى أنماط الانعکاس الصعودی. • الرأس: قاع السیولة عند 4,00x • الکتفین: یتشکلان بشکل متماثل مع ارتداد جید • خط العنق: منطقة 4,101–4,102، حالیًا مقاومة رئیسیة من المحتمل أن یتحرک السعر: 1️⃣ تعدیل طفیف إلى منطقة خط العنق أو منطقة الشراء 4,044–4,046 2️⃣ إعادة اختبار – تراکم – تأکید الاختراق 3️⃣ اختراق نحو 4,146 → 4,187 عند اکتمال النمط 🎯 توقعات قصیرة الأجل قد تزداد التقلبات قبل البیانات الاقتصادیة القادمة، لذا تبقى الاستراتیجیة المعقولة: ✅ الأولویة للشراء وفقًا للنمط • انتظر إعادة اختبار خط العنق أو منطقة 4,044–4,046 • راقب قوة التأکید (الحجم – الزخم – الرفض) • الهدف نحو 4,146 → 4,187 إذا تم تفعیل النمط ⚠️ ملاحظة – الاتجاه الانعکاسی یتأکد فقط عندما یکسر السعر بوضوح منطقة 4,101–4,102. – یمیل شعور السوق حالیًا نحو التعافی، لکن هناک حاجة إلى إشارات واضحة قبل الدخول فی مراکز کبیرة (احتفاظ طویل الأجل).
MMFlowTrading
تحلیل طلا (XAU/USD): تلههای فروش فعالاند؛ فروش در اوج همچنان بهترین استراتژی!
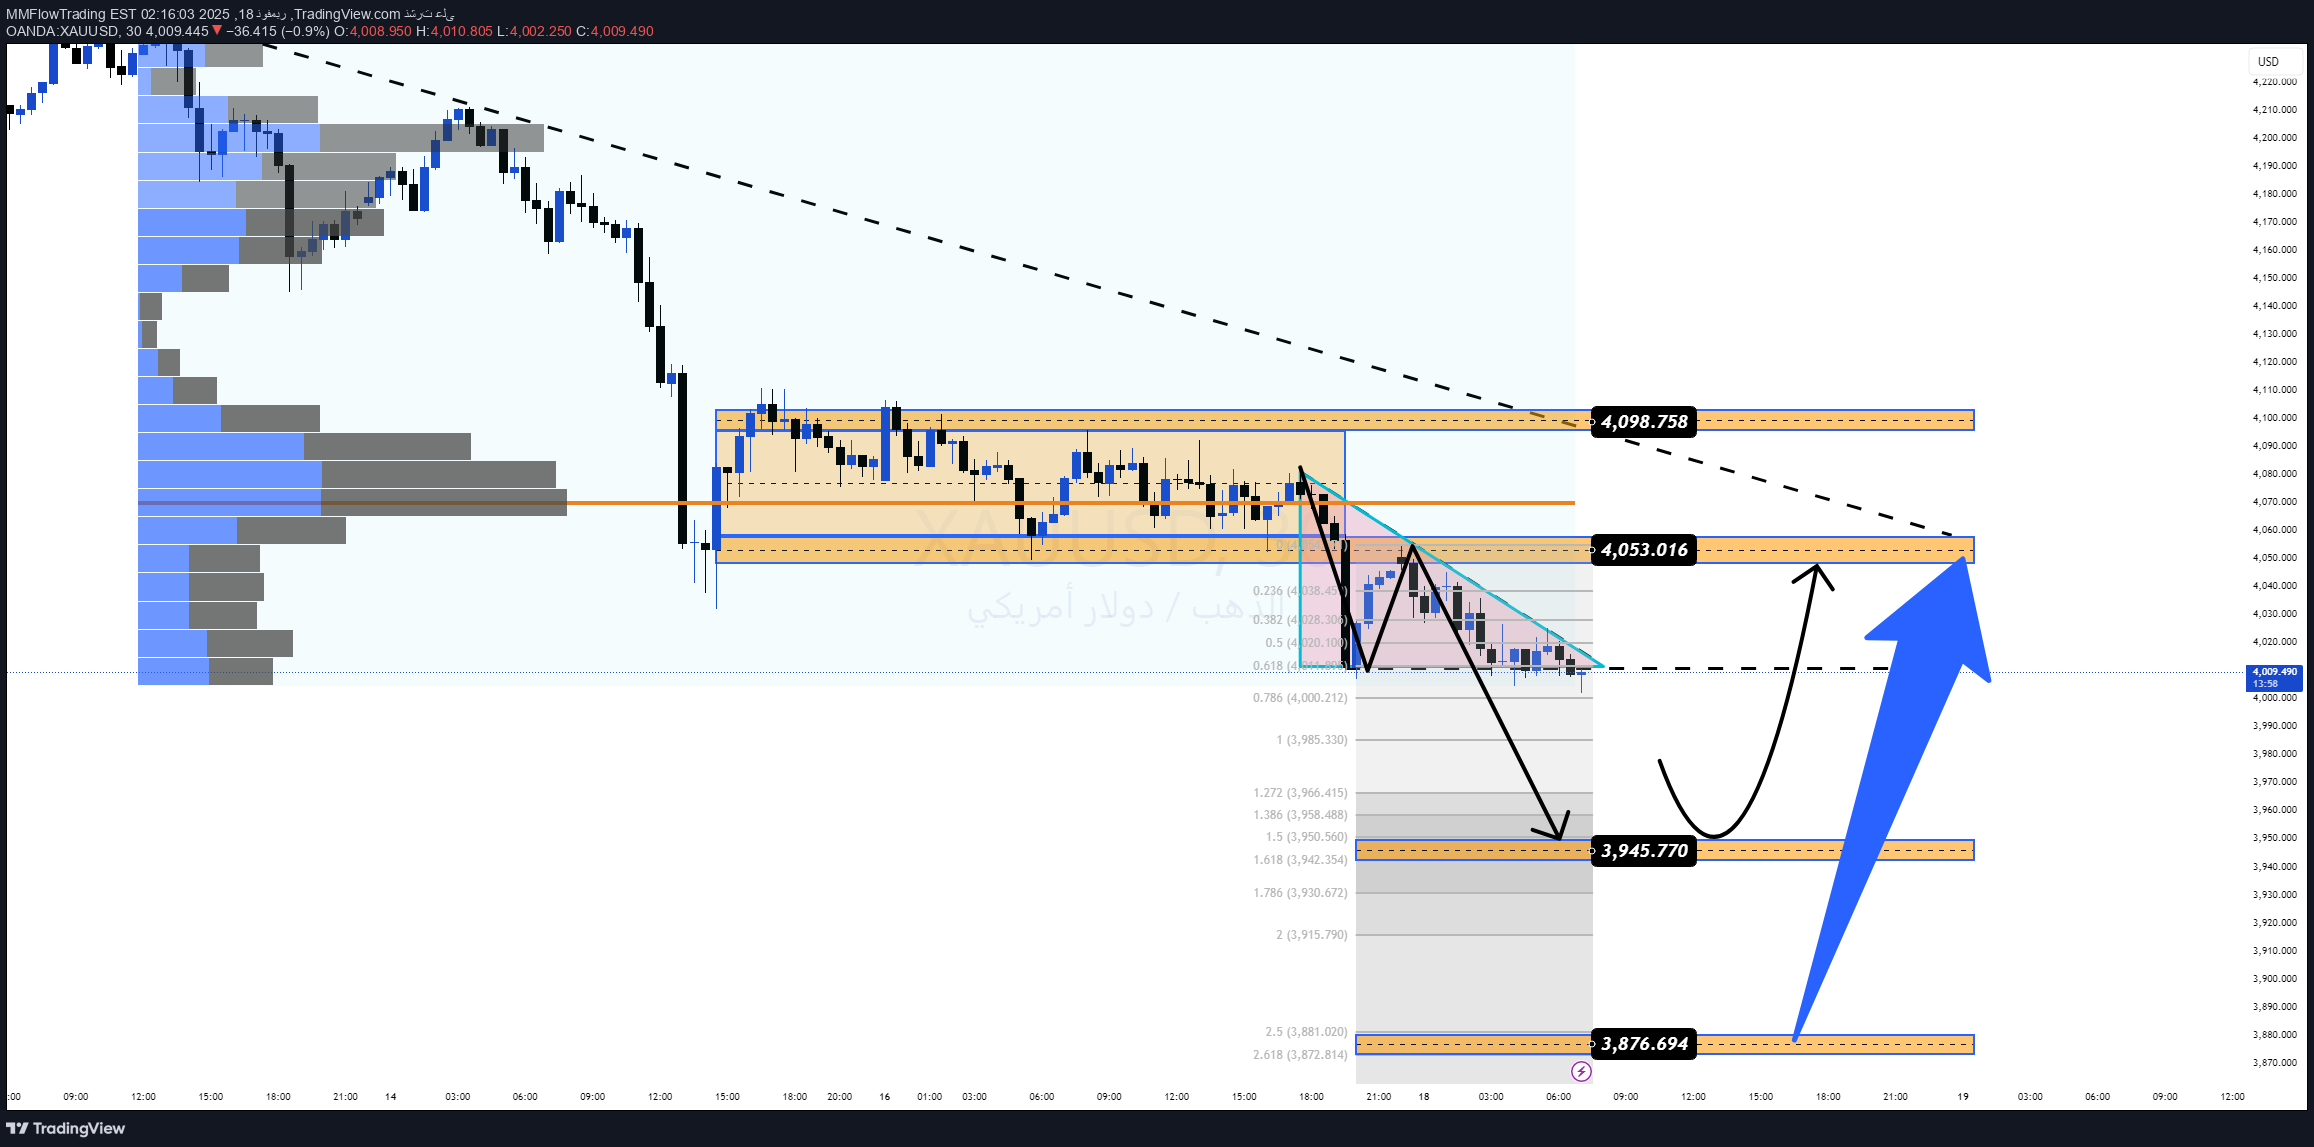
یستمر الذهب فی التداول تحت ضغط بیع کثیف، ویبقى محصوراً تحت 4,050$ ویطفو فوق أرضیة السیولة الرئیسیة عند 4,000$. مع تلاشی التوقعات لخفض الفائدة فی دیسمبر من قبل الفیدرالی والمشاعر العالمیة الحذرة، یبقى المشترون فی موقف دفاعی بینما یحافظ البائعون على السیطرة الهیکلیة. 📊 النظرة الفنیة (H1) یبقى السعر داخل نطاق توزیع ضیق بین 4,053$ → 4,000$، مع استمرار خط الاتجاه الهابط فی قمع الذهب. نقطة التحکم حول 4,053$ تعمل کسقف قوی؛ کل إعادة اختبار حتى الآن تم رفضها. تسلیط الضوء على الإسقاطات الفیبوناتشی من الانخفاض الأخیر على منطقتین رئیسیتین للسیولة الهابطة: 3,945$ → أول تجمع للسیولة 3,876$ → امتداد أعمق وطلب رئیسی الهیکل الحالی یشبه العلم الهابط، مما یشیر إلى أن السوق قد یکون یستعد لتوسع هبوطی آخر. 🎯 السیناریوهات الرئیسیة 1️⃣ انهیار هبوطی (السیناریو الأساسی) إذا فقد الذهب 4,000$، توقع تسارع الزخم نحو: 3,945$ 3,876$ هذا یبقى المسار الأکثر احتمالاً بینما السعر یبقى تحت 4,053$. 2️⃣ اکتساح السیولة → ارتداد تغطیة قصیرة إذا اکتسح السعر 3,945$ وشکل فتائل رفض صعودیة: قد یتطور ارتداد إغاثة نحو 4,000$، ثم 4,053$ (نقطة التحکم) وربما 4,098$ إذا اکتسب المشترون زخماً. لا یزال حرکة تصحیحیة إلا إذا استعاد الثیران الهیکل العلوی. ❌ إبطال (ضعف التحیز الهبوطی) قبول H4 فوق 4,098$ → سیغیر السرد ویجبر على إعادة تقییم اتجاه الاتجاه. ⚜️ نظرة MMFLOW TRADING الذهب لا یزال یتداول تحت القیمة وتحت خط الاتجاه — هذا لیس بیئة صعودیة بعد. یجب على السوق إما کسر 4,000$ أو استعادة 4,053$–4,098$ قبل أن یعود أی قناعة اتجاهیة أقوى. “دع السوق یظهر یده. فی اتجاه هبوطی، الارتفاعات الضعیفة هی فرص — لیست انعکاسات.”
MMFlowTrading
طلا زیر 4050 دلار گیر افتاد: آیا خرسها در کمین نقدینگی زیر 4000 دلار هستند؟
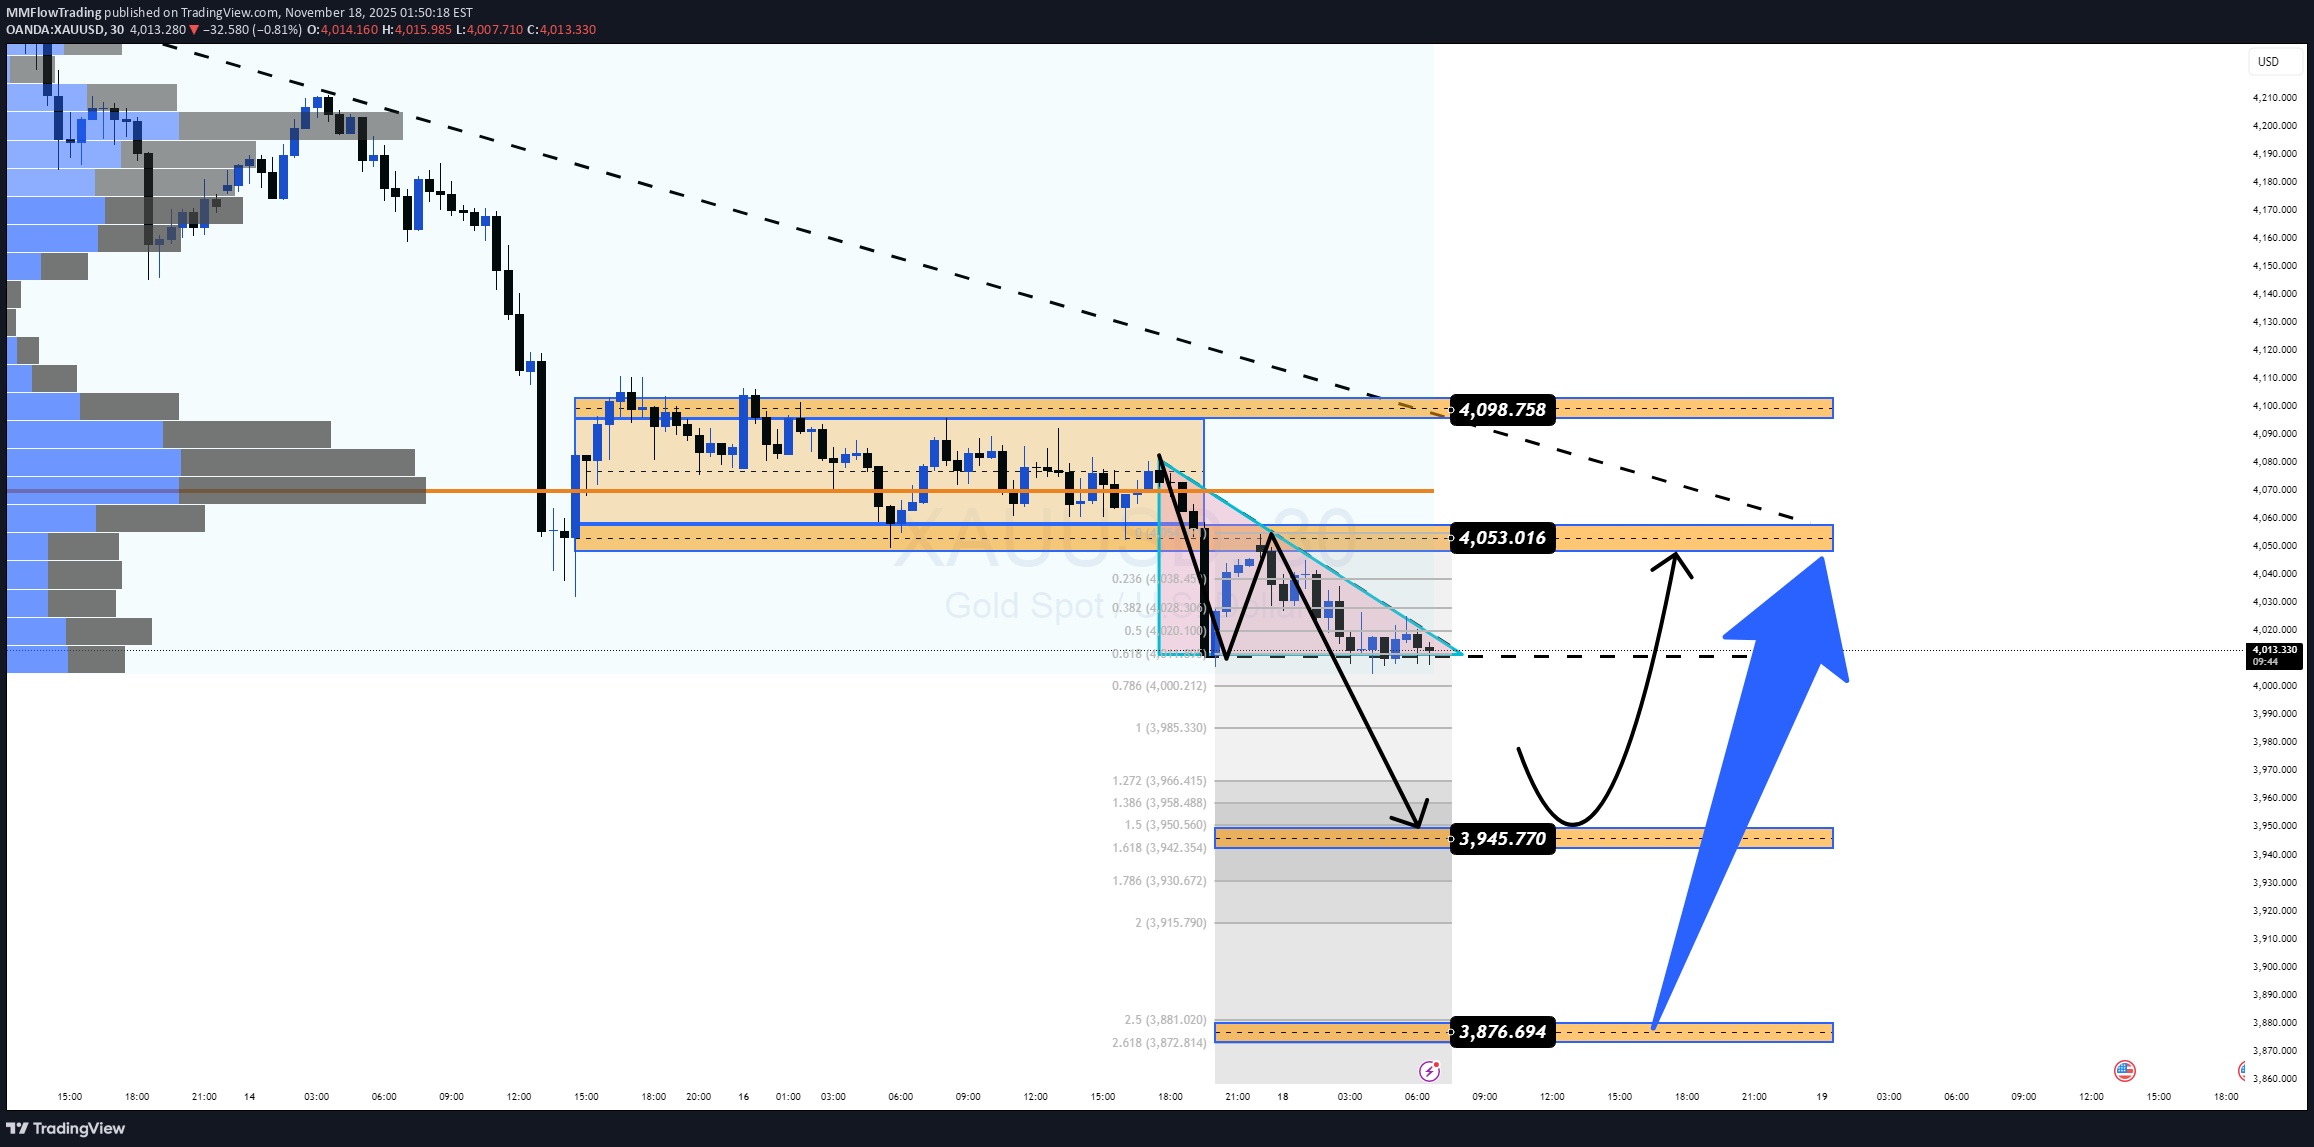
🔍 Market Context Gold has been under pressure for four consecutive sessions as expectations for a December Fed cut fade. The Dollar is supported by growth worries but not strong enough to trigger a clean risk-off bid into gold. Result: XAU/USD keeps hovering near weekly lows, with sellers patiently watching the 4,000$ liquidity shelf. 📊 Technical Structure – H1 (MMFLOW View) Overall bias remains bearish, with price capped by a descending trendline from the recent 4,24x high. Price is compressing inside a tight 4,053–4,000$ distribution range, which also aligns with a Volume Profile POC around 4,053$. The last leg down is tracked with Fibonacci extensions: Key downside liquidity cluster: 3,945$ → 3,876$ (1.272–1.618 extensions). Current PA looks like a bear flag / tight consolidation under resistance – a classic setup for either: a clean break below 4,000$ into deeper liquidity, or a shakeout dip into demand before a sharp short-covering bounce. In short: gold is coiling under POC 4,053$, preparing either a final flush to 3,945–3,876$ or a squeeze back into the old value area. 🎯 Idea Scenarios (for study, not signals) Scenario 1 – Trend Continuation: Break of 4,000$ As long as H1 closes stay below 4,053$, bearish bias is valid. A decisive break and retest failure at 4,000$ opens the door toward: 🎯 3,945$ – first liquidity pocket / 1.272 ext. 🎯 3,876$ – deeper liquidity / 1.618 ext. & key demand. For existing shorts from higher, those zones are logical areas to scale out / manage exits. Scenario 2 – Liquidity Sweep Then Short-Covering Bounce If price spikes into 3,945$ ± a few dollars and shows: long downside wicks, or clear M15–M30 rejection structure, Gold could stage a counter-trend rebound toward: 4,000–4,015$, then 4,053$ (POC), and potentially 4,098$ if momentum extends. This would be a liquidity-reaction play, not a confirmed trend reversal unless bulls reclaim and hold above 4,098$. Invalidation of the bearish view A sustained move with H4 closes above 4,098$ would weaken the current down-structure and force a reassessment of the medium-term bias. ⚜️ MMFLOW TRADING Insight When price is trapped under POC, patience beats FOMO. Let the market either: break and accept below 4,000$, or reclaim 4,053$–4,098$ …before committing heavily. Bears still have the upper hand, but bulls will only regain narrative if they defend 3,945–3,876$ and push price back into the old value area. “In a downtrend, your job isn’t to call the bottom – it’s to sell weak rallies and let liquidity do the heavy lifting.”
MMFlowTrading
طلاء الذهب يتراجع: مناطق البيع طلائية برای فروشندگان XAU/USD!
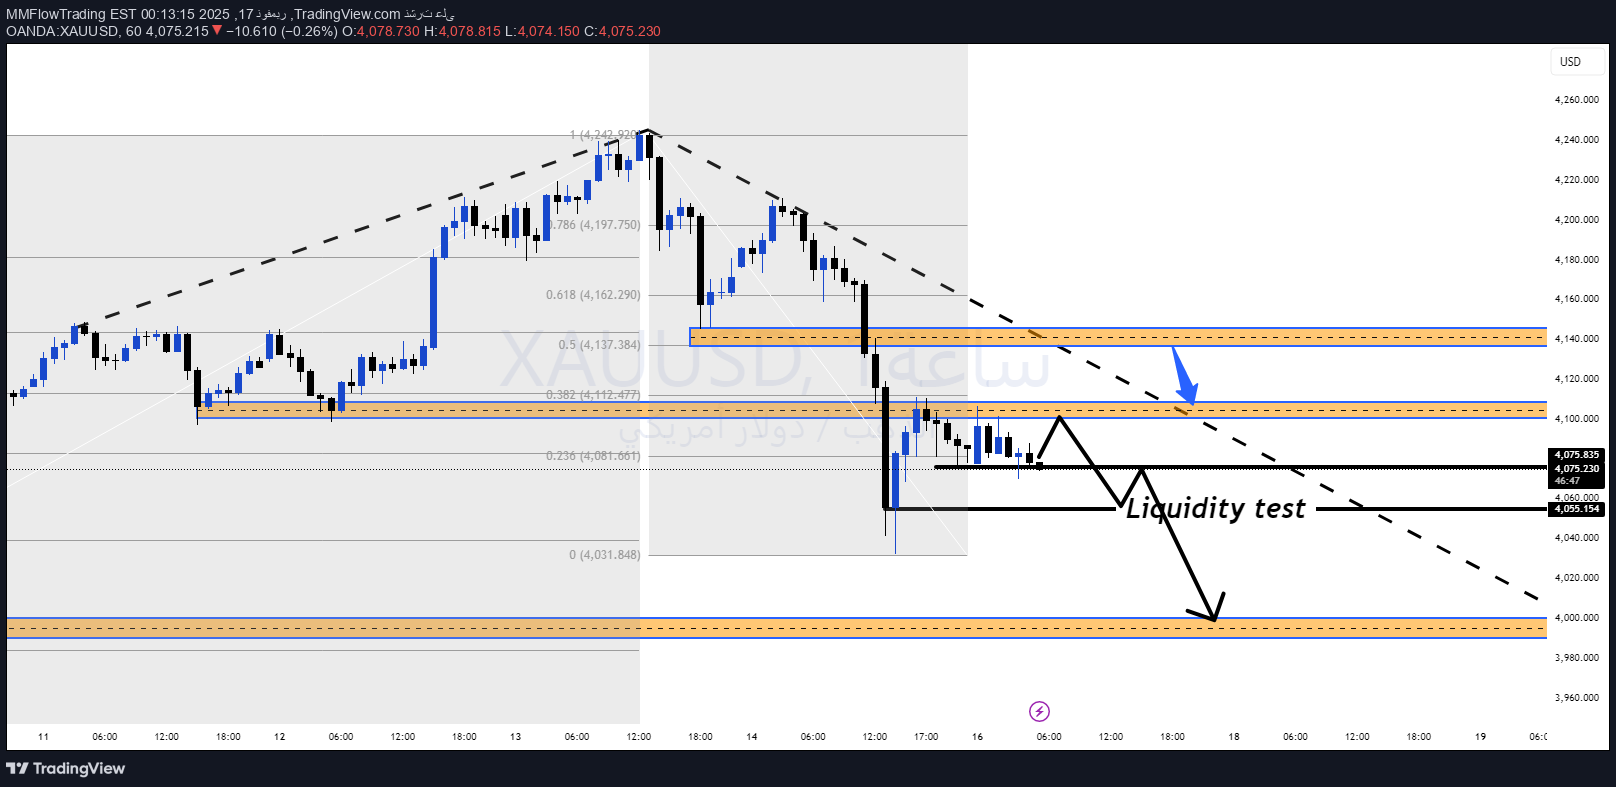
🔍 سیاق السوق یبقى الشعور بالمخاطر هشًا بینما یعید المستثمرون تقییم القصة العالمیة حول الأسعار والتحفیز. تشیر جولدمان ساکس إلى أن المخاوف المتزایدة بشأن حجم التحفیز المالی فی الیابان تعید المخاطر المالیة، مما یضع ضغطًا على السندات الحکومیة الیابانیة طویلة الأجل والین الیابانی. یمیل رأس المال إلى التحول إلى الدولار الأمریکی والأصول ذات العائد فی هذا البیئة، مما یحد من الارتفاع للذهب فی المدى القصیر. 📊 الهیکل الفنی لـ XAU/USD (H1) بعد الوصول إلى القمة حول 4,242 دولار، کسر الذهب اتجاهه الصاعد القصیر الأجل ویتحرک الآن فی هیکل هابط. السعر محصور حالیًا تحت منطقة فیبوناتشی 0.5–0.382 حول 4,11x، والتی تتداخل مع منطقة عرض قویة / سیولة بیع على الرسم البیانی. تحت السعر، لدینا سلسلة من جیوب السیولة / الدعم: 4,098 – 4,077 – 4,048 دولار: مستویات سیولة هابطة قصیرة الأجل. منطقة شراء OBS حول 4,00x: منطقة طلب رئیسیة حیث أطلق السعر سابقًا ارتفاعًا قویًا. السلوک السعری الحالی یظهر أن البائعین لا یزالون مسیطرین – کل ارتداد إلى 4,10x–4,14x یتم رفضه بسرعة، مما یتناسب مع نهج "بیع الارتفاع". 🎯 أفکار تداول تتبع الاتجاه (للمرجع) المناطق أدناه هی مناطق فنیة للمراقبة، ولیست إشارات أو نصائح مالیة. السیناریو 1 – بیع عند ارتداد طفیف منطقة بیع 1: 4,102 – 4,104 SL: 4,110 مستویات TP: TP1: 4,098 TP2: 4,077 TP3: 4,048 الفکرة: یقوم السعر بارتداد طفیف داخل العرض المحلی، ثم یستأنف الضغط البیعی نحو جیوب السیولة الأدنى. السیناریو 2 – ارتداد أعمق إلى تلاقی فیبوناتشی/خط الاتجاه منطقة بیع 2: 4,142 – 4,144 (تلاقی خط الاتجاه الهابط + مجموعة فیبوناتشی) SL: 4,150 مستویات TP: TP1: 4,133 TP2: 4,105 TP3: 4,088 TP4: 4,060 الفکرة: إذا استحوذ السوق أولاً على سیولة صاعدة أکثر، فإن منطقة 4,14x تقدم منطقة R:R أفضل لتتوافق مع الاتجاه الهابط لـ H1. ⚜️ رؤیة تداول MMFLOW طالما بقی السعر تحت 4,14x واستمر هیکل H1 فی طباعة قمم أدنى، یظل الذهب فی مرحلة توزیع. یتم التعامل مع الارتدادات إلى نطاق سیولة 4,10x–4,14x کفرص لتحسین إدخالات البیع، بینما تعد منطقة شراء OBS 4,00x هی المنطقة الرئیسیة لإعادة تقییم أی عملیة قاع أکبر محتملة. "فی الاتجاه الهابط، لیس عملنا هو تحدید القاع – بل هو استخدام کل ارتداد ضعیف للبیع من موقع أفضل."
Disclaimer
Any content and materials included in Sahmeto's website and official communication channels are a compilation of personal opinions and analyses and are not binding. They do not constitute any recommendation for buying, selling, entering or exiting the stock market and cryptocurrency market. Also, all news and analyses included in the website and channels are merely republished information from official and unofficial domestic and foreign sources, and it is obvious that users of the said content are responsible for following up and ensuring the authenticity and accuracy of the materials. Therefore, while disclaiming responsibility, it is declared that the responsibility for any decision-making, action, and potential profit and loss in the capital market and cryptocurrency market lies with the trader.