
LucasMgoldview
@t_LucasMgoldview

What symbols does the trader recommend buying?
Purchase History
پیام های تریدر
Filter
XAUUSD – Bear flag unfolding, sellers still hold the power
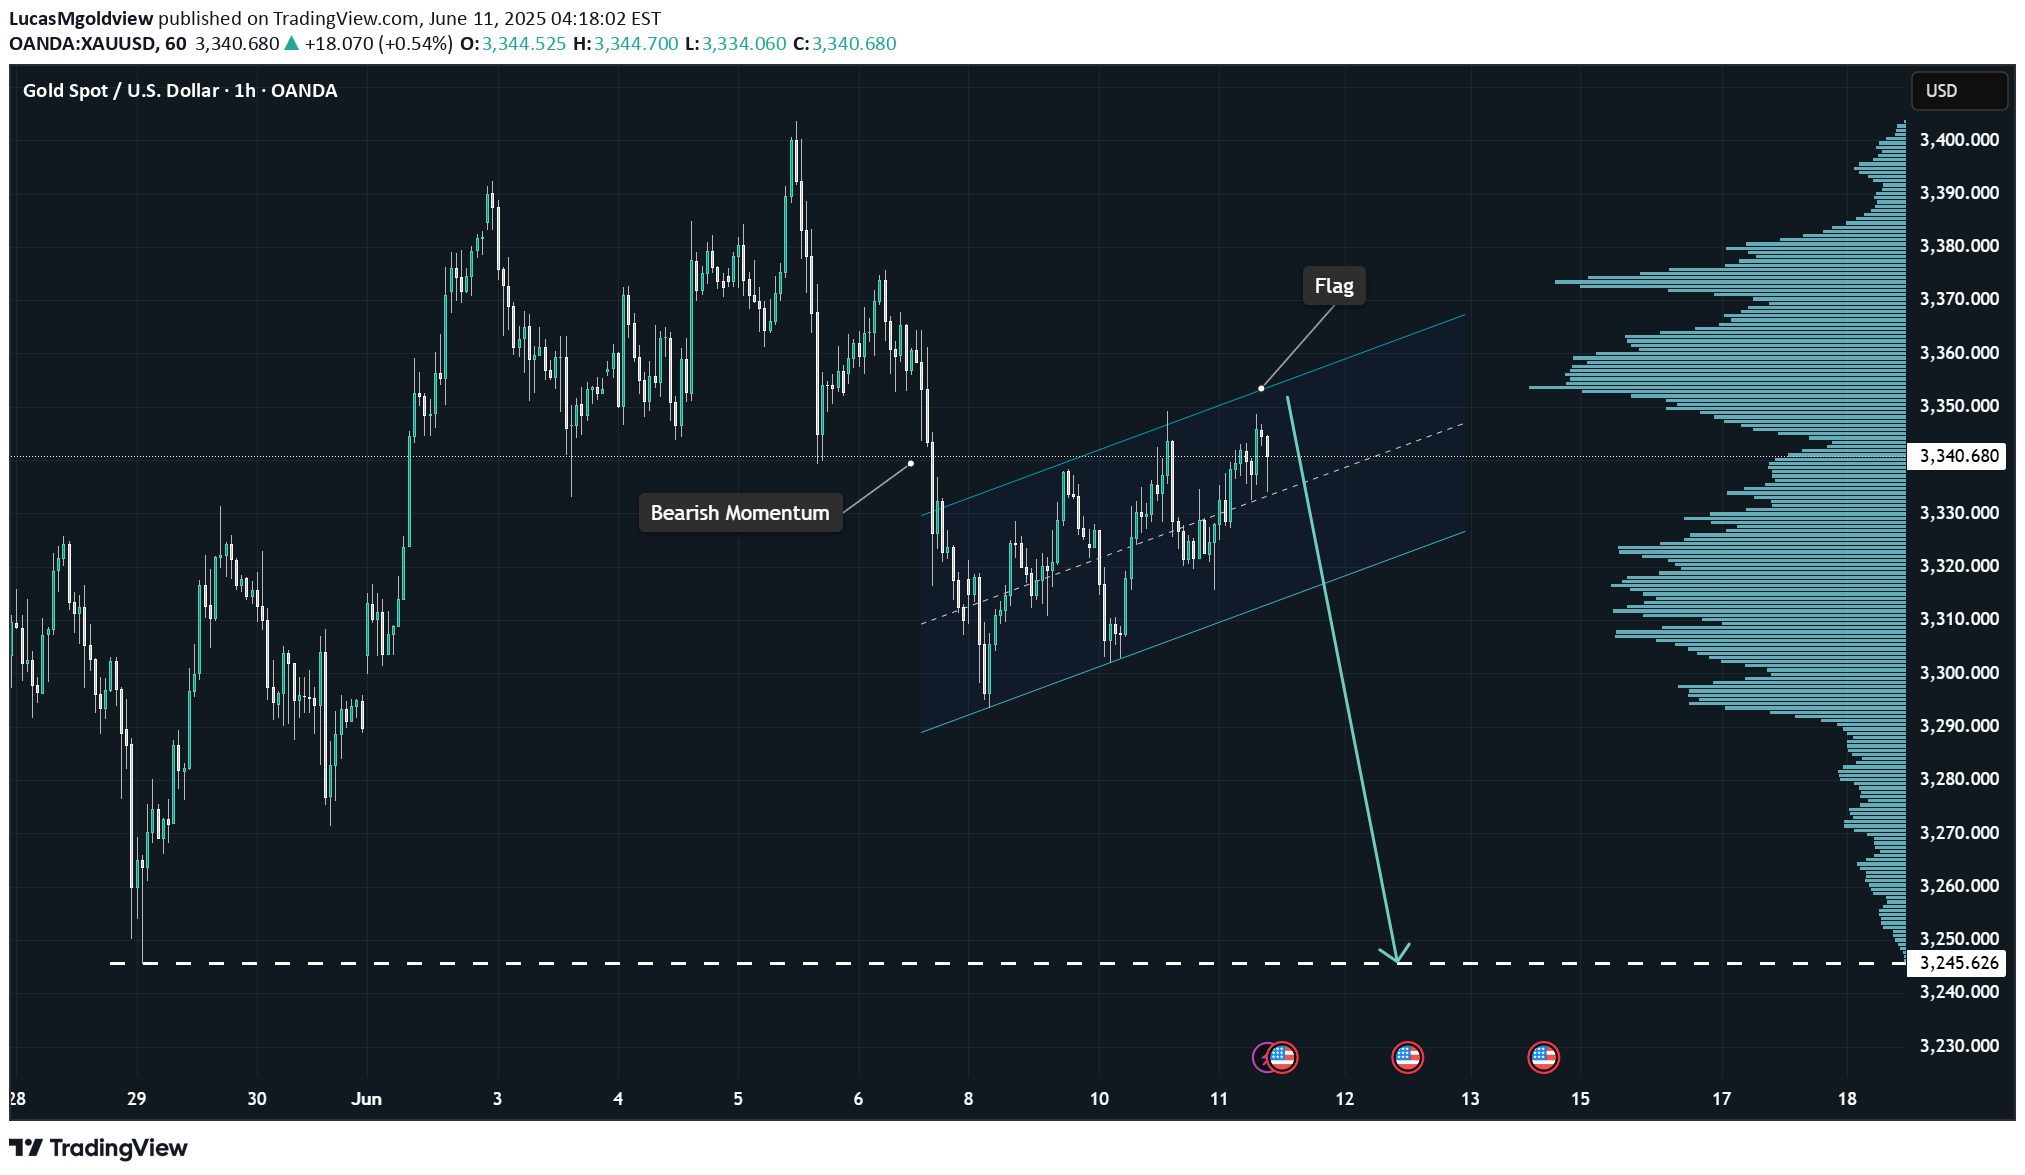
XAUUSD is currently trading within a short-term ascending channel, identified as a “bear flag” pattern, which often appears as a technical correction within the main downtrend. The previous bearish momentum remains strong, and the recent recovery lacks breakout strength, showing that buying pressure is weakening.The current price structure reflects a temporary consolidation before a potential breakout. If it breaks below the lower boundary of the flag channel, I expect the price to move toward the target level of 3,245, where high liquidity is concentrated, as shown by the Volume Profile indicator.As long as the price remains within the flag channel and fails to break above the resistance area, sellers still have the upper hand. However, if the price breaks above the upper boundary of the flag and holds, the bearish scenario will be invalidated.As usual, I will wait for confirmation before entering a position.
Gold ises in the short term, approaching key level.
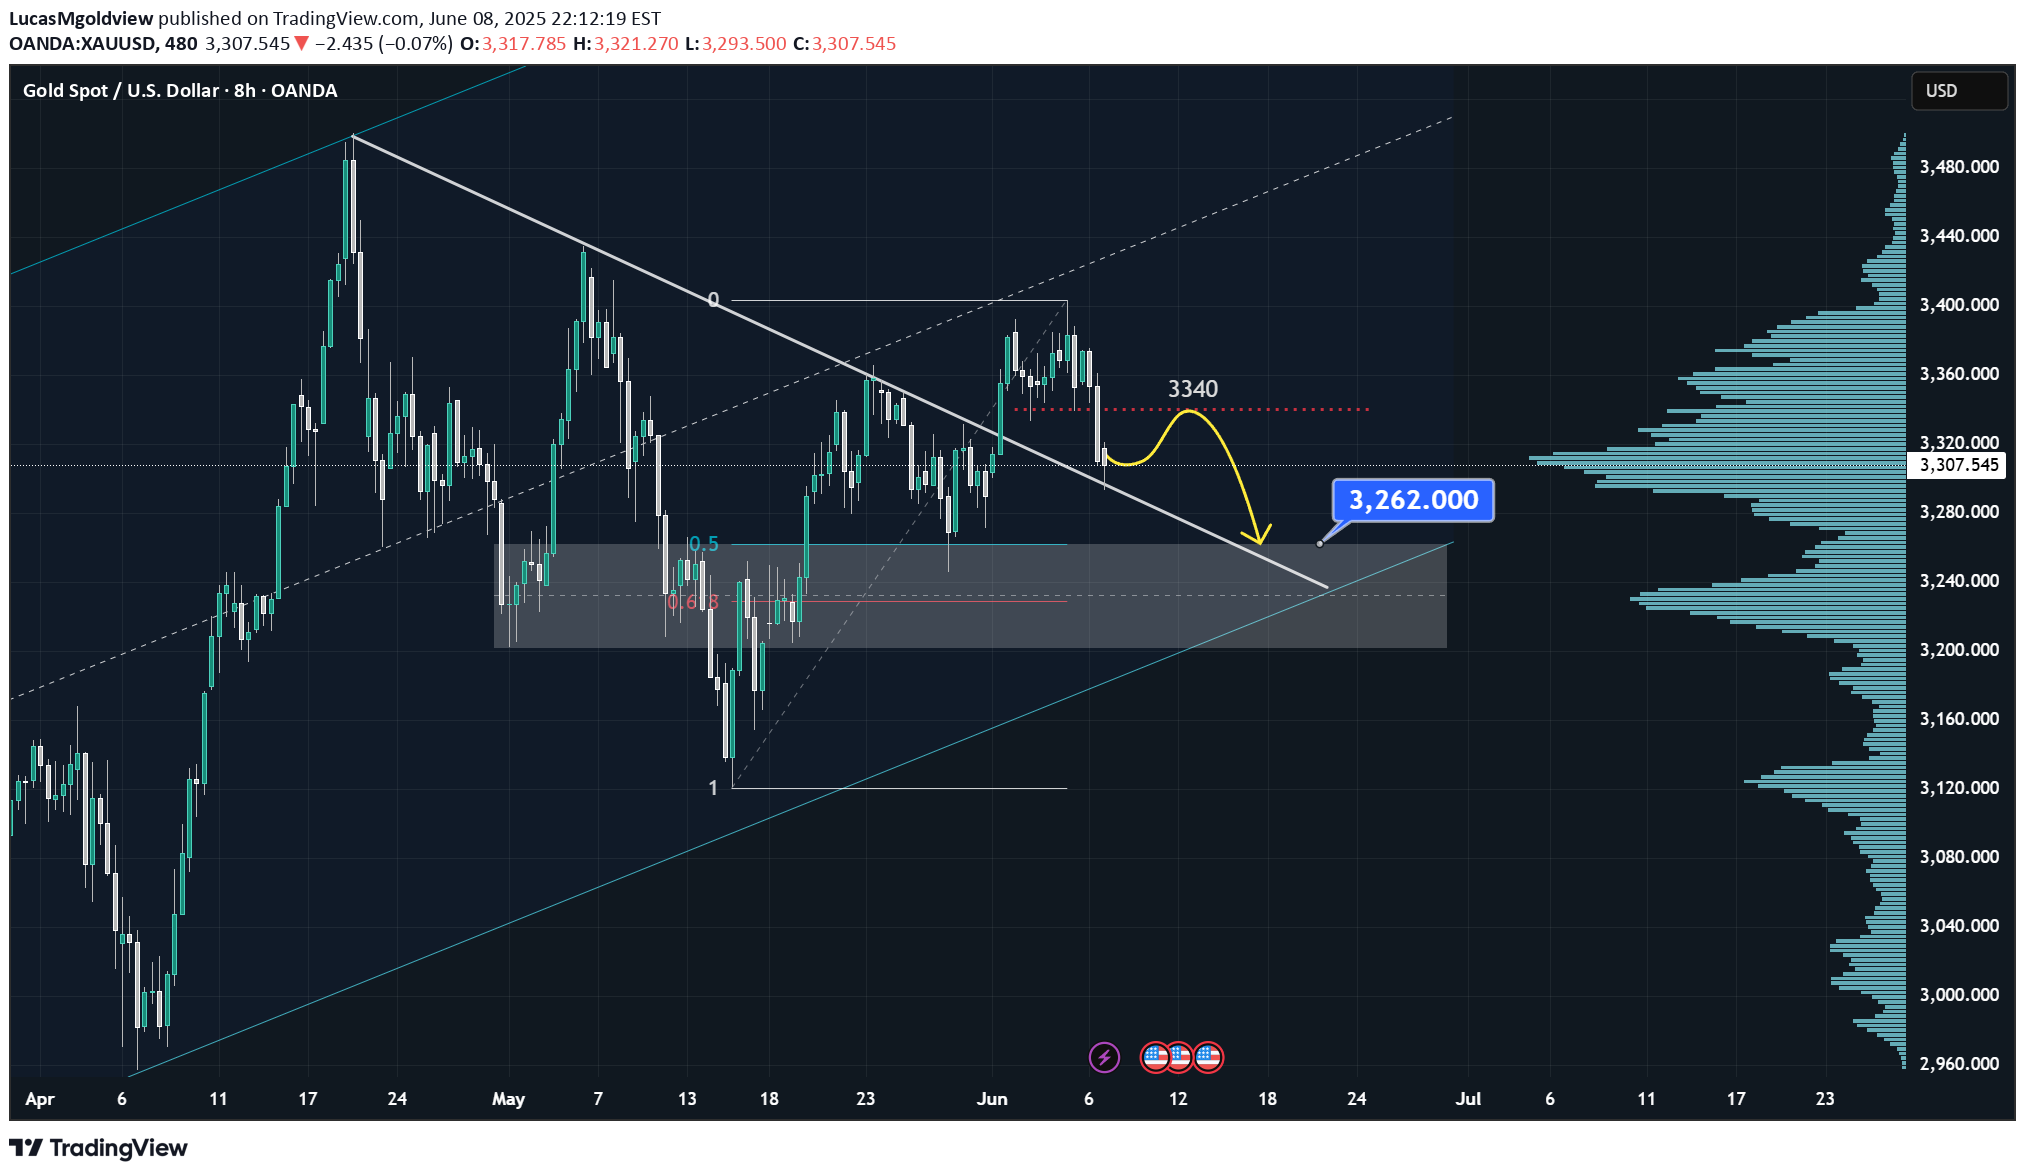
Based on the recent price action perspective, Gold's movement may have signaled weakness and could serve as a key trigger for bearish traders. This is why I anticipate further follow-through selling activity. The bearish outlook has not yet been confirmed, however, a rebound from the confluence zone could once again attract sellers for a potential move toward the 3,262 support area.But a strong upward move and a break above the confluence zone around 3,340 would allow Gold to reclaim 3,400 and push even higher.Please note that I will not engage without proper confirmation.
XAUUSD Analysis: Potential Pullback and Continuation

XAUUSD is currently trading within an ascending channel, reflecting a clear bullish structure.Price may return to the lower boundary of the channel before potentially continuing higher. This dynamic support provides a confluence zone for a possible bullish reaction. A successful retest here could pave the way for a move toward the $3,500 level, aligning with the midline of the channel and representing a reasonable bullish target.However, failure to hold this dynamic support could indicate that bullish momentum is weakening and may shift the short-term trend to neutral or bearish.Traders should monitor confirmation signals such as bullish engulfing patterns, strong rejection wicks at the lower trendline, or increased volume on the rebound before considering long positions.Let me know your thoughts or if you see it differently! 🚀
XAUUSD – Bullish Continuation Ahead?

XAUUSD is currently trading within an ascending channel, with price recently bouncing off the channel’s support trendline after a pullback. This recovery indicates that buyers are stepping in, maintaining the bullish structure within the channel.If the upward momentum continues, we may see a move toward 3,400 USD, which aligns with the upper boundary of the channel. This level could act as a potential short-term target before any reaction from sellers. A clear breakout above this resistance zone could open the door for further gains. However, failure to sustain this momentum might lead to another test of the lower boundary.Traders should watch for bullish confirmation signals such as higher lows, strong bullish candlesticks, or rising volume before considering long positions.If you agree with this outlook or have any additional insights, feel free to share your thoughts!I will enter my position right now, because there is a reversal signal
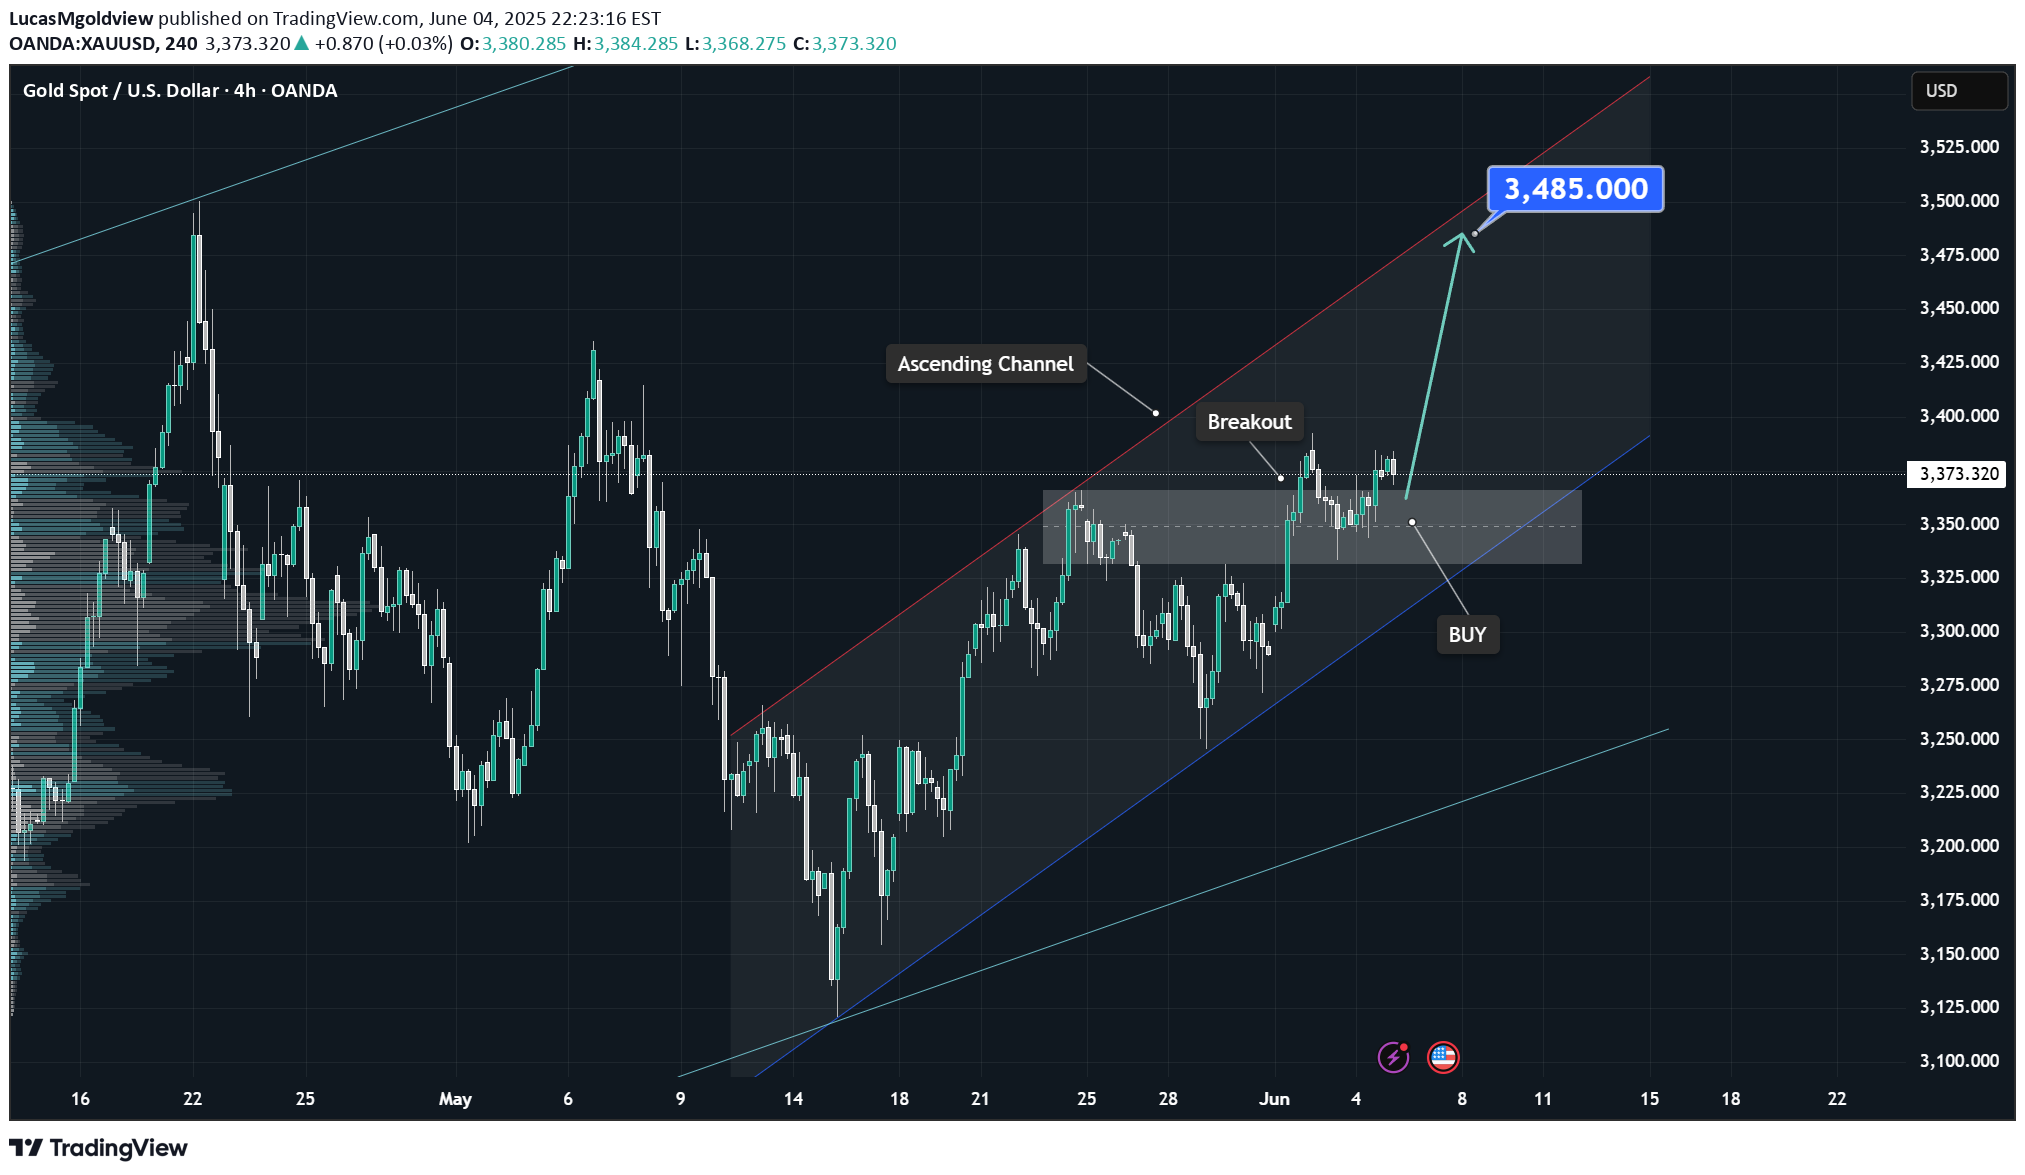
XAUUSD Trending Higher – Bullish Continuation Toward 3.485
XAUUSD is currently trading within an ascending channel, maintaining a bullish structure. The price has broken above a key resistance area that has now turned into support, aligning with the potential for continued upside. The recent retest of this level has been successful, indicating strong buyer interest and reinforcing the bullish outlook.With momentum favoring the uptrend, the price could move toward the 3.485 level, aligning with the upper boundary of the channel. However, failure to hold this level could indicate a potential shift in momentum.Traders should watch for bullish confirmation signals, such as a bullish engulfing candle, strong rejection wicks from the support zone, or increasing buying volume, before considering long positions.Let me know your thoughts or any additional insights you might have!
XAUUSD – Will the Channel Hold for a Push Toward 3,480?

XAUUSD is a typical case of a market trading within an ascending channel, with price action consistently respecting both its upper and lower boundaries.The price has broken through a clear resistance zone and may come back to retest. This area also coincides with the gold pocket of the recent volatility and therefore deserves special attention. If it holds as support, then it would be a confirmation of the bullish structure, allowing a good move toward the target area of 3,480, the midline of the channel.As long as the price remains above this support area, the validity of the bullish setup remains intact. However, failing to stay above this level may invalidate the bullish scenario and increase the likelihood of a pullback to the lower boundary of the channel.Please note that I will not participate without proper confirmation.
Gold Surges After Trade Deal – What’s Next?
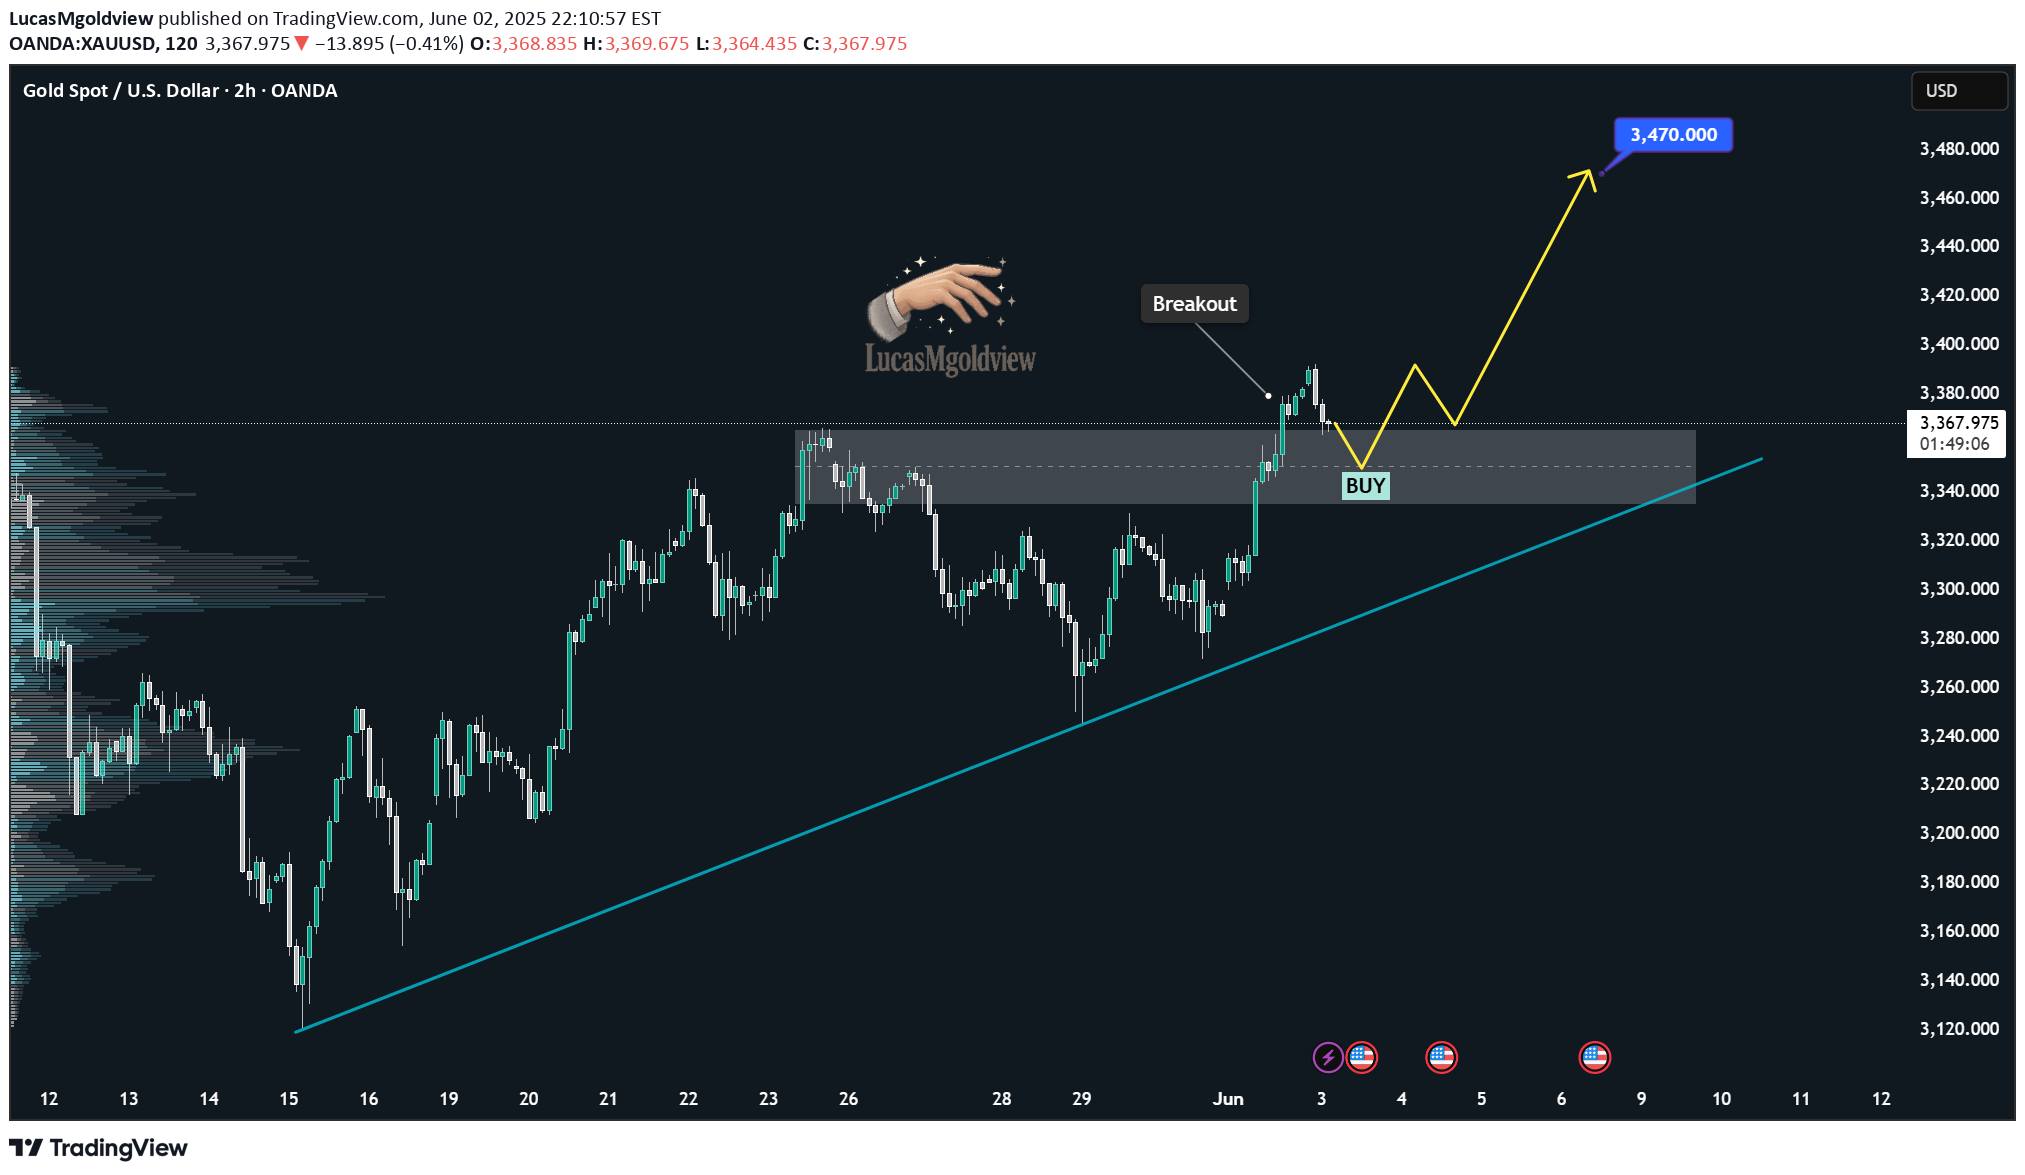
XAUUSD has recently shown a strong upward trend, supported by both a technical breakout structure and positive fundamental developments. After a prolonged rally from the lows of the previous weekend’s close, it has decisively broken through the key resistance zone between $3,365 and $3,370, which has now been clearly removed. With this breakout, the structure confirms the upward momentum and the expectation is to retest this newly formed support zone before continuing the uptrend.The price is currently around $3,368 and a pullback to the $3,365 to $3,370 zone will offer a high-probability buying opportunity. This aligns with classic price behavior: after a breakout, the market often returns to test the former resistance level, which has now turned into support. If we see it retest, it would confirm the technical setup for a continued move toward the projected target of $3,470.From a fundamental perspective, the Chinese Ministry of Commerce issued a statement refuting accusations from the US of violating the bilateral trade agreement (published on June 2, 2025), claiming these allegations are "groundless." According to the reached agreement, the US agreed to reduce tariffs on Chinese goods from 145% to 30% within 90 days. In return, China also pledged to lower tariffs on US goods from 125% to 10% over the same period. President Donald Trump stated over the weekend that China had not complied with the agreement and warned of increased tariffs on steel and aluminum this week.Additionally, the ongoing Russia-Ukraine conflict continues to escalate, increasing pressure on risk assets and supporting gold prices. Tim Waterer, Chief Market Analyst at KCM Trade, commented that with rising trade and geopolitical tensions, it’s no surprise that gold has started the new week with an upward trend.From a technical standpoint, the overall structure remains bullish. The breakout is clear and supported by volume. Any deeper pullback that breaks below $3,335 would invalidate the short-term bullish trend, as it would signal a failure to hold above the former resistance level and could mean the beginning of a deeper correction toward trendline support.In conclusion, the current market behavior suggests it is in the process of forming a bullish continuation, supported by the clear breakout above previous resistance, rising geopolitical and trade tensions.The price is likely to retest the breakout zone, offering a potential long setup forecasting a move higher if momentum remains strong. The technical picture is supported by future growth plans, making it a safe-haven asset to watch closely in the coming weeks to confirm the pullback and continuation.
Bullish Momentum Stalls as Gold Hits Key Resistance

Right now, we can see that gold’s upward momentum is starting to stall at a resistance level that has historically acted as a strong barrier and triggered significant reversals in the past. Given its historical relevance, the way price behaves here could increase the likelihood of a pullback if sellers step in.If sellers confirm their presence through bearish signals such as long upper wicks, bearish candlesticks, or fading buyer strength, I believe we could see a move down toward the 3,324 level. However, a clean breakout above this resistance would challenge the bearish outlook and open the door for further upside. This is a critical area where price action is likely to offer valuable clues about the market’s next move.Just my personal view on support and resistance, not financial advice. Always confirm your setups and manage risk accordingly.Good luck!
Gold Slips Below 3,300 – Is the Downtrend Still in Play?

Gold ended the week at 3,290 dollars per ounce, down about 15 dollars from its overnight high at 3,305.The main driver behind this decline was the rebound in the US dollar, as recent American economic data pointed to a more resilient outlook, reducing the need for safe-haven assets. Meanwhile, market sentiment was further dampened by ongoing legal uncertainties surrounding former President Trump’s proposed trade tariffs, which made investors more cautious with riskier assets.From a technical perspective, bearish pressure has persisted since gold topped out near 3,365 in mid-May. Price is now hovering near a mid-range support zone, and if selling continues in the early sessions next week, the 3,265 level could be the next downside target.I believe gold may remain highly volatile in the coming days, especially as traders await the US Non-Farm Payrolls report on June 5. As long as price stays below the 3,305 mark, the bearish outlook remains intact.
XAUUSD: Is the Downtrend Likely to Continue?

XAUUSD is a classic case of a market continuing its downtrend after rejecting resistance within a clearly defined descending channel. This move indicates that sellers are stepping in and maintaining the bearish structure inside the channel.If the downward momentum persists, we could see a move toward the 3,250 level, which aligns with a significant internal support area within the channel. This zone could serve as a short-term target. A decisive break below this level may open the door to further declines. However, failure to sustain this bearish move could result in a retest of the upper channel boundary.Traders should watch for confirmation signals such as lower highs forming below the recent supply zone or strong bearish candles near resistance before considering short setups.If you agree with this outlook or have any additional insights, feel free to share your thoughts!Work was going well on Friday
Disclaimer
Any content and materials included in Sahmeto's website and official communication channels are a compilation of personal opinions and analyses and are not binding. They do not constitute any recommendation for buying, selling, entering or exiting the stock market and cryptocurrency market. Also, all news and analyses included in the website and channels are merely republished information from official and unofficial domestic and foreign sources, and it is obvious that users of the said content are responsible for following up and ensuring the authenticity and accuracy of the materials. Therefore, while disclaiming responsibility, it is declared that the responsibility for any decision-making, action, and potential profit and loss in the capital market and cryptocurrency market lies with the trader.