
Kizaru187
@t_Kizaru187

What symbols does the trader recommend buying?
Purchase History
پیام های تریدر
Filter
Kizaru187
AXS SETUP

### Entry Points - **Primary Entry**: 4.712 USDT (38.2% Fibonacci retracement) - This level shows a good opportunity for entry as it aligns with the Fibonacci retracement level and potential support zone. - **Secondary Entry**: 4.041 USDT (lower accumulation zone) - If the price drops, this is another key level for buying, close to the 1.0 Fibonacci extension. ### Target (Take Profit) Levels - **First Target (TP1)**: 5.242 USDT (61.8% Fibonacci retracement) - The first target aligns with a common resistance level at the 61.8% Fibonacci, where partial profit-taking is advised. - **Second Target (TP2)**: 7.000 USDT - A higher target that suggests a potential breakout if the momentum continues. - **Third Target (TP3)**: 9.000 USDT - A more extended target for those holding the position longer, representing a strong rally. ### Stop Loss - **Stop Loss**: 3.602 USDT - This is below the recent low and the 1.0 Fibonacci level, providing a solid point to minimize losses if the trade does not work out. ### Key Levels and Observations - **Fibonacci Levels**: - 38.2% retracement at 4.712 USDT. - 61.8% retracement at 5.242 USDT (TP1). - 88.6% retracement near the lower support zone. - **Harmonic Pattern**: The chart appears to show a potential harmonic pattern that indicates a bullish reversal if it completes. - **Volume Profile**: Increasing volume at lower price levels indicates potential accumulation by buyers. ### Trade Plan Summary 1. **Enter** the trade around 4.712 USDT or lower at 4.041 USDT if the price pulls back further. 2. **Set Stop Loss** at 3.602 USDT to limit downside risk. 3. **Target Levels**: - **First Target (TP1)** at 5.242 USDT. - **Second Target (TP2)** at 7.000 USDT. - **Third Target (TP3)** at 9.000 USDT. This strategy focuses on taking advantage of the Fibonacci retracement levels and potential bullish harmonic pattern, with defined targets and risk management through the stop loss level.
Kizaru187
ONE SETUP

Based on the provided chart for **ONE/USDT** (Harmony on Binance) on a 1-day timeframe, here is a detailed trading plan: ### Entry Points - **Primary Entry**: 0.01354 USDT (38.2% Fibonacci retracement) - This is the ideal entry level where the price is showing some consolidation and potential upward movement. - **Secondary Entry**: 0.01215 USDT (88.6% Fibonacci retracement) - A lower entry for additional accumulation if the price drops, still within a strong support zone. ### Target (Take Profit) Levels - **First Target (TP1)**: 0.01663 USDT - This target aligns with the 61.8% Fibonacci retracement, which is a common area of resistance where traders may take profits. - **Second Target (TP2)**: 0.02200 USDT - A more extended target that reflects a potential breakout above the resistance level. - **Third Target (TP3)**: 0.02800 USDT - This would be a significant rally target if the price continues to move upwards, aligning with a key resistance zone. ### Stop Loss - **Stop Loss**: 0.00795 USDT - Set below the recent low (1.0 Fibonacci level), ensuring a reasonable risk management strategy if the trade does not move in your favor. ### Key Levels and Observations - **Fibonacci Levels**: - 38.2% retracement at 0.01354 USDT. - 61.8% retracement at 0.01663 USDT (TP1). - 88.6% retracement at 0.01215 USDT (secondary entry). - **Harmonic Pattern**: A potential bullish harmonic pattern suggests that the price could reverse and move upwards. - **Volume Profile**: There’s an increase in volume around the current price levels, which might indicate an accumulation phase before a breakout. ### Technical Indicators - **RSI & MACD**: While not shown on the current chart, the structure suggests that the price might be at the end of a bearish phase, indicating the start of a potential bullish reversal. ### Trade Plan Summary 1. **Enter** the trade between 0.01215 USDT and 0.01354 USDT. 2. **Set Stop Loss** at 0.00795 USDT to limit downside risk. 3. **Target Levels**: - **First Target (TP1)** at 0.01663 USDT. - **Second Target (TP2)** at 0.02200 USDT. - **Third Target (TP3)** at 0.02800 USDT. This trading strategy is designed to take advantage of the potential upside, while managing risk with a defined stop loss level. The trade relies on Fibonacci retracement levels and the harmonic pattern formation for key decision-making points.
Kizaru187
VET SETUP

Based on the provided chart for VET/USDT on a 1-day timeframe from Binance, here is a detailed trading plan: ### Entry Points - **Primary Entry**: Around 0.02335 USDT - This is the key entry level where price has formed a consolidation and potential reversal area. - **Secondary Entry (Lower)**: 0.02042 USDT - This lower entry can be used if the price dips further but remains within the support zone, providing another opportunity to enter at a discounted price. ### Target (Take Profit) Levels - **First Target (TP1)**: 0.02750 USDT - This level is a 61.8% Fibonacci retracement from the recent swing high and may act as a resistance level. - **Second Target (TP2)**: 0.04000 USDT - A significant target and resistance level where the price may face some selling pressure. - **Third Target (TP3)**: 0.05500 USDT - A more ambitious target, representing a larger upside potential if the trend continues upward. ### Stop Loss - **Stop Loss**: 0.01731 USDT - The stop loss is set below the most recent support level to protect against further downside. This level ensures a tight risk management strategy. ### Key Levels and Observations - **Fibonacci Levels**: - 38.2% retracement at 0.02427 USDT (resistance area). - 50% retracement at 0.02588 USDT. - 61.8% retracement at 0.02750 USDT (TP1). - **Harmonic Pattern**: The chart forms a harmonic pattern, indicating potential bullish momentum once it breaks above the resistance zone. - **Volume Profile**: There’s significant activity in the current price range, indicating a possible accumulation zone before a breakout. ### Technical Indicators - **RSI**: Suggesting the potential for a bullish reversal from oversold conditions, which strengthens the bullish bias. - **MACD**: Positive divergence forming, indicating a potential upward momentum shift in the coming days. ### Trade Plan Summary 1. **Enter** the trade between 0.02042 USDT and 0.02335 USDT. 2. **Set Stop Loss** at 0.01731 USDT to minimize risk. 3. **Target Levels**: - **First Target (TP1)** at 0.02750 USDT. - **Second Target (TP2)** at 0.04000 USDT. - **Third Target (TP3)** at 0.05500 USDT. This strategy leverages both Fibonacci retracement levels and harmonic pattern completion for potential upside. Ensure to adjust your position size and manage risk accordingly.First TP 50%
Kizaru187
GLMER BUY
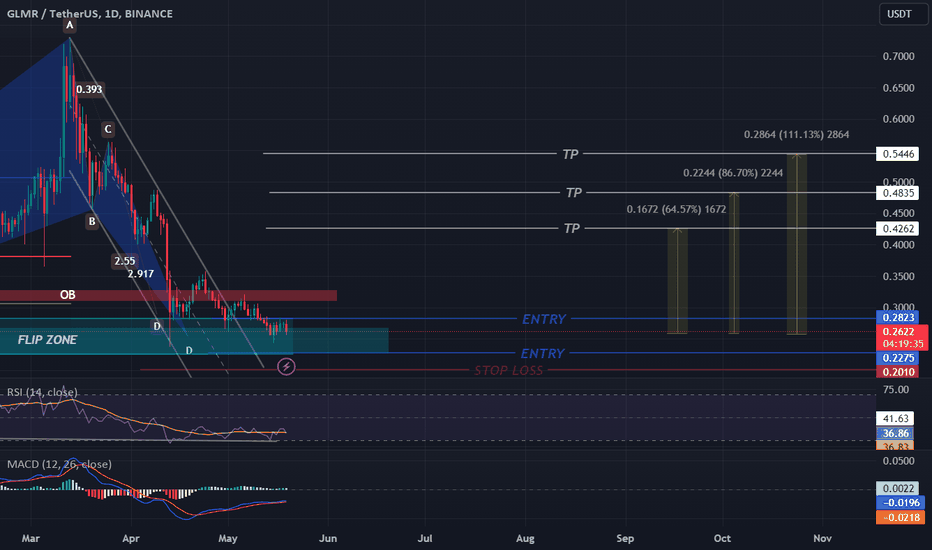
Based on the provided chart for GLMR/USDT on a 1-day timeframe from Binance, here is a detailed trading plan: ### Entry Point - **Entry Zone**: Between 0.2275 and 0.2823 USDT - This range represents a key support area where the price has previously found buying interest. Entering within this zone can help capitalize on potential upward movement while minimizing downside risk. ### Target (Take Profit) Levels - **First Target (TP1)**: 0.4262 USDT - This level is identified as a significant resistance where the price might face selling pressure. - **Second Target (TP2)**: 0.4835 USDT - This level aligns with a higher resistance zone and provides a reasonable medium-term target. - **Third Target (TP3)**: 0.5446 USDT - This level is a long-term target and a major resistance level, indicating substantial upside potential. ### Stop Loss - **Stop Loss**: 0.2010 USDT - This stop loss level is set below the support zone to protect against a deeper downside move. It helps manage risk by limiting potential losses. ### Key Levels and Observations - **Resistance Levels**: - 0.4262 USDT (TP1) - 0.4835 USDT (TP2) - 0.5446 USDT (TP3) - **Support Levels**: - 0.2823 USDT (upper entry zone) - 0.2275 USDT (lower entry zone) ### Technical Indicators - **Volume Profile**: Shows significant trading activity around the entry zone, suggesting strong interest and potential support. - **Harmonic Pattern**: Indicates the potential price move based on the harmonic pattern, suggesting possible retracement levels and target zones. - **RSI**: Currently around 36.99, which is in the lower range, indicating potential oversold conditions and a possible reversal. - **MACD**: Shows a potential bullish crossover, suggesting increasing bullish momentum. ### Trade Plan Summary 1. **Enter** the trade within the 0.2275 to 0.2823 USDT range. 2. **Set Stop Loss** at 0.2010 USDT to manage risk. 3. **Target Levels**: - **First Target (TP1)** at 0.4262 USDT. - **Second Target (TP2)** at 0.4835 USDT. - **Third Target (TP3)** at 0.5446 USDT. Always remember to manage your risk appropriately and adjust your trade parameters based on market conditions. Use proper position sizing and consider overall market trends when making trading decisions.
Kizaru187
ONE BUY

Based on the provided chart for ONE/USDT on a 1-day timeframe from Binance, here's a detailed trading plan: ### Entry Point - **Entry Zone**: Between 0.01877 and 0.02101 USDT - This range represents a significant support zone where the price is likely to find buying interest. Entering within this zone maximizes the potential for an upward move while minimizing downside risk. ### Target (Take Profit) Levels - **First Target (TP1)**: 0.02550 USDT - This level is identified as the nearest resistance where the price might face selling pressure. - **Second Target (TP2)**: 0.02816 USDT - This level aligns with previous resistance and provides a reasonable medium-term target. - **Third Target (TP3)**: 0.03108 USDT - This level represents a higher resistance zone and aligns with historical price action. - **Fourth Target (TP4)**: 0.03719 USDT - This level is a long-term target and a significant resistance level, indicating substantial upside potential. ### Stop Loss - **Stop Loss**: 0.01612 USDT - This stop loss level is set below the support zone to protect against a deeper downside move. It helps in managing risk by limiting potential losses. ### Key Levels and Observations - **Resistance Levels**: - 0.02550 USDT (TP1) - 0.02816 USDT (TP2) - 0.03108 USDT (TP3) - 0.03719 USDT (TP4) - **Support Levels**: - 0.02101 USDT (upper entry zone) - 0.01877 USDT (lower entry zone) ### Technical Indicators - **Volume Profile**: Shows high trading activity around the entry zone, suggesting strong interest and potential support. - **Harmonic Pattern**: Indicates the potential price move based on the harmonic pattern, suggesting possible retracement levels and target zones. - **RSI**: Currently around 48.76, which is neutral, indicating no extreme conditions (overbought or oversold). - **MACD**: Shows a potential bullish crossover, suggesting increasing bullish momentum. ### Trade Plan Summary 1. **Enter** the trade within the 0.01877 to 0.02101 USDT range. 2. **Set Stop Loss** at 0.01612 USDT to manage risk. 3. **Target Levels**: - **First Target (TP1)** at 0.02550 USDT. - **Second Target (TP2)** at 0.02816 USDT. - **Third Target (TP3)** at 0.03108 USDT. - **Fourth Target (TP4)** at 0.03719 USDT. Always remember to manage your risk appropriately and adjust your trade parameters based on market conditions. Use proper position sizing and consider overall market trends when making trading decisions.
Kizaru187
ENJ BUY
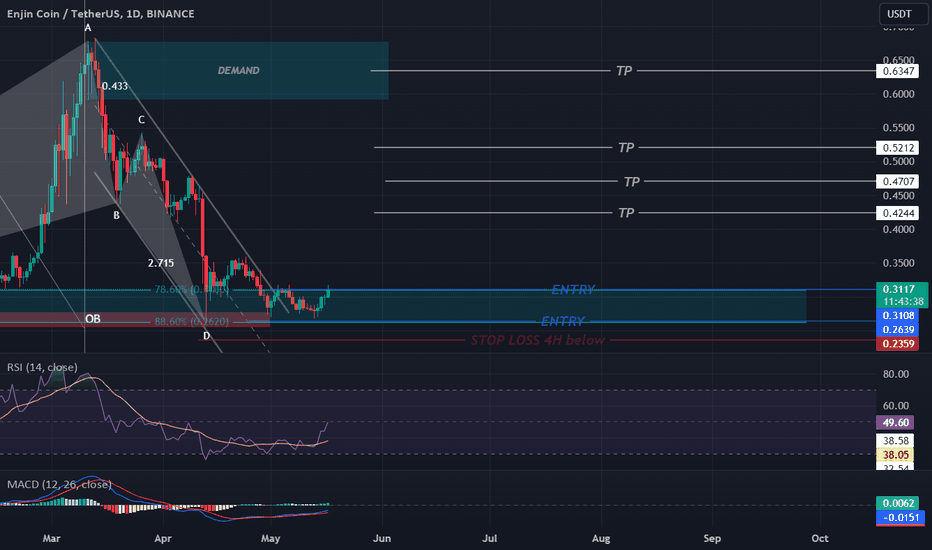
Based on the provided chart for ENJ/USDT on a 1-day timeframe from Binance, here's a detailed trading plan: ### Entry Point - **Entry Zone**: Between 0.2639 and 0.3110 USDT - This range represents a significant support zone where the price is likely to find buying interest. Entering within this zone maximizes the potential for an upward move while minimizing downside risk. ### Target (Take Profit) Levels - **First Target (TP1)**: 0.4244 USDT - This level is identified as the nearest resistance where the price might face selling pressure. - **Second Target (TP2)**: 0.4707 USDT - This level aligns with previous resistance and provides a reasonable medium-term target. - **Third Target (TP3)**: 0.5212 USDT - This level represents a higher resistance zone and aligns with historical price action. - **Fourth Target (TP4)**: 0.6347 USDT - This level is a long-term target and a significant resistance level, indicating a substantial upside potential. ### Stop Loss - **Stop Loss**: 0.2359 USDT - This stop loss level is set below the support zone to protect against a deeper downside move. It helps in managing risk by limiting potential losses. ### Key Levels and Observations - **Resistance Levels**: - 0.4244 USDT (TP1) - 0.4707 USDT (TP2) - 0.5212 USDT (TP3) - 0.6347 USDT (TP4) - **Support Levels**: - 0.3110 USDT (upper entry zone) - 0.2639 USDT (lower entry zone) ### Technical Indicators - **Volume Profile**: Shows high trading activity around the entry zone, suggesting strong interest and potential support. - **ABCD Pattern**: Indicates the potential price move based on the harmonic pattern, suggesting possible retracement levels and target zones. - **RSI**: Currently around 49.60, which is neutral, indicating no extreme conditions (overbought or oversold). - **MACD**: Shows a potential bullish crossover, suggesting increasing bullish momentum. ### Trade Plan Summary 1. **Enter** the trade within the 0.2639 to 0.3110 USDT range. 2. **Set Stop Loss** at 0.2359 USDT to manage risk. 3. **Target Levels**: - **First Target (TP1)** at 0.4244 USDT. - **Second Target (TP2)** at 0.4707 USDT. - **Third Target (TP3)** at 0.5212 USDT. - **Fourth Target (TP4)** at 0.6347 USDT. Always remember to manage your risk appropriately and adjust your trade parameters based on market conditions. Use proper position sizing and consider overall market trends when making trading decisions.
Kizaru187
AXS BUY
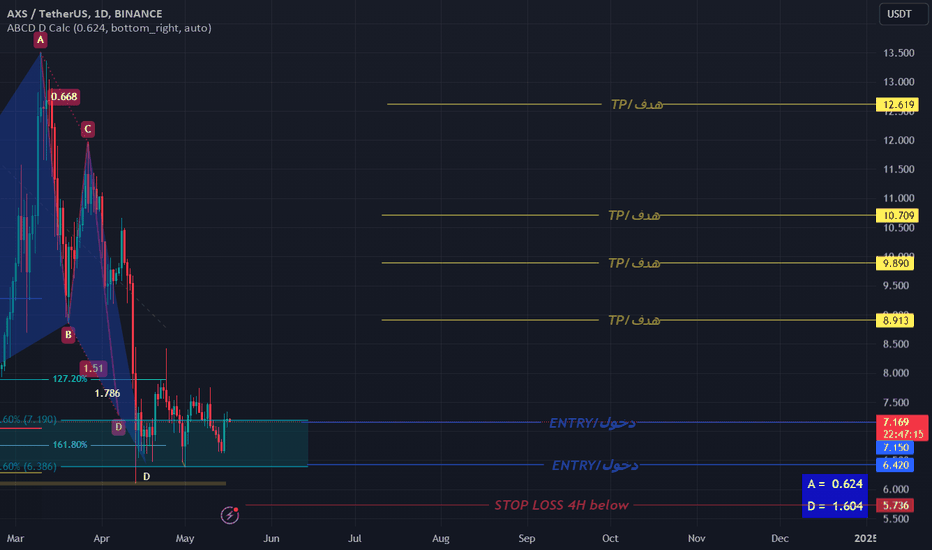
Based on the provided chart for AXS/USDT on a 1-day timeframe from Binance, here's a detailed trading plan: ### Entry Point - **Entry Zone**: Between 6.420 and 7.190 USDT - This range represents a significant support zone where the price is likely to find buying interest. ### Target (Take Profit) Levels - **First Target (TP1)**: 8.913 USDT - This level is the nearest target where the price is likely to encounter resistance. - **Second Target (TP2)**: 9.890 USDT - This level aligns with previous resistance and is a reasonable next target. - **Third Target (TP3)**: 10.709 USDT - This level is a higher resistance zone and aligns with previous price action. - **Fourth Target (TP4)**: 12.619 USDT - This level is a higher resistance level and a long-term target. ### Stop Loss - **Stop Loss**: 5.736 USDT - This stop loss level is set below the support zone to protect against a deeper downside move. ### Key Levels and Observations - **Resistance Levels**: - 8.913 USDT - 9.890 USDT - 10.709 USDT - 12.619 USDT - **Support Levels**: - 7.190 USDT (upper entry zone) - 6.420 USDT (lower entry zone) ### Technical Indicators - **Volume Profile**: Shows high trading activity around the entry zone, suggesting strong interest and potential support. - **ABCD Pattern**: Indicates the potential price move based on the harmonic pattern, suggesting possible retracement levels and target zones. ### Trade Plan Summary 1. **Enter** the trade within the 6.420 to 7.190 USDT range. 2. **Set Stop Loss** at 5.736 USDT to manage risk. 3. **Target Levels**: - **First Target (TP1)** at 8.913 USDT. - **Second Target (TP2)** at 9.890 USDT. - **Third Target (TP3)** at 10.709 USDT. - **Fourth Target (TP4)** at 12.619 USDT. Always remember to manage your risk appropriately and adjust your trade parameters based on market conditions.still valid
Kizaru187
LRC BUY
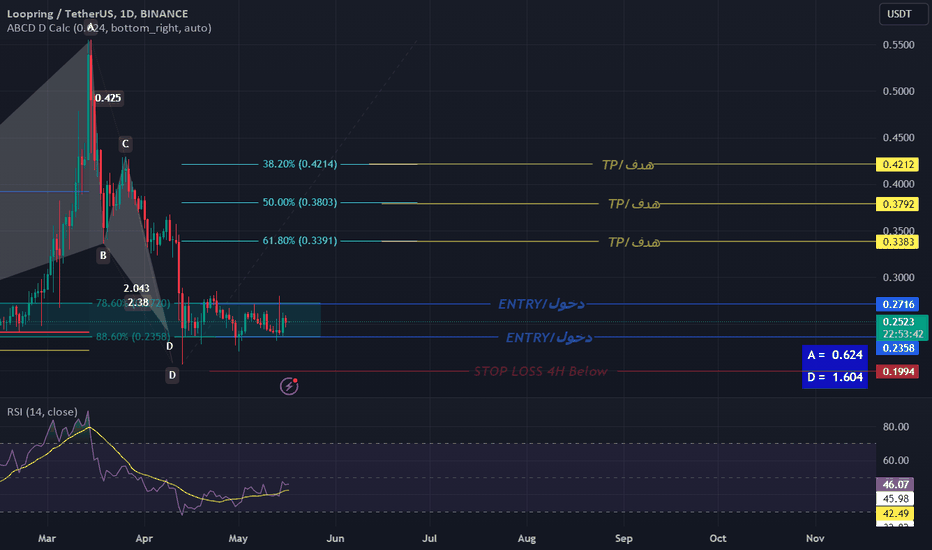
Based on the provided chart for LRC/USDT on a 1-day timeframe from Binance, here's a detailed trading plan: ### Entry Point - **Entry Zone**: Between 0.2358 and 0.2521 USDT - This range represents a significant support zone where the price is likely to find buying interest. ### Target (Take Profit) Levels - **First Target (TP1)**: 0.3383 USDT - This level is around the 61.8% Fibonacci retracement, which often acts as a strong resistance. - **Second Target (TP2)**: 0.3792 USDT - This level is a higher resistance zone and aligns with the 50% Fibonacci retracement. - **Third Target (TP3)**: 0.4212 USDT - This level corresponds to the 38.2% Fibonacci retracement and is a strong resistance area. ### Stop Loss - **Stop Loss**: 0.1994 USDT - This stop loss level is set below the support zone to protect against a deeper downside move. ### Key Levels and Observations - **Resistance Levels**: - 0.3383 USDT (61.8% Fibonacci retracement) - 0.3792 USDT (50% Fibonacci retracement) - 0.4212 USDT (38.2% Fibonacci retracement) - **Support Levels**: - 0.2521 USDT (current level within the entry zone) - 0.2358 USDT (lower end of the entry zone) ### Technical Indicators - **RSI**: Currently around 42.48, indicating a neutral to slightly bearish market sentiment with no strong overbought or oversold conditions. - **Volume Profile**: Shows high trading activity around the entry zone, suggesting strong interest and potential support. ### Chart Patterns and Analysis - **ABCD Pattern**: This pattern suggests that the price has completed a significant move and is likely to retrace to a Fibonacci level before resuming its trend. - **Volume Profile**: Indicates a significant volume around the current price level, which often acts as a support zone. ### Trade Plan Summary 1. **Enter** the trade within the 0.2358 to 0.2521 USDT range. 2. **Set Stop Loss** at 0.1994 USDT to manage risk. 3. **Target Levels**: - **First Target (TP1)** at 0.3383 USDT. - **Second Target (TP2)** at 0.3792 USDT. - **Third Target (TP3)** at 0.4212 USDT. Always remember to manage your risk appropriately and adjust your trade parameters based on market conditions.
Disclaimer
Any content and materials included in Sahmeto's website and official communication channels are a compilation of personal opinions and analyses and are not binding. They do not constitute any recommendation for buying, selling, entering or exiting the stock market and cryptocurrency market. Also, all news and analyses included in the website and channels are merely republished information from official and unofficial domestic and foreign sources, and it is obvious that users of the said content are responsible for following up and ensuring the authenticity and accuracy of the materials. Therefore, while disclaiming responsibility, it is declared that the responsibility for any decision-making, action, and potential profit and loss in the capital market and cryptocurrency market lies with the trader.